Ocean Power Market Size and Share
Market Overview
| Study Period | 2021 - 2031 |
|---|---|
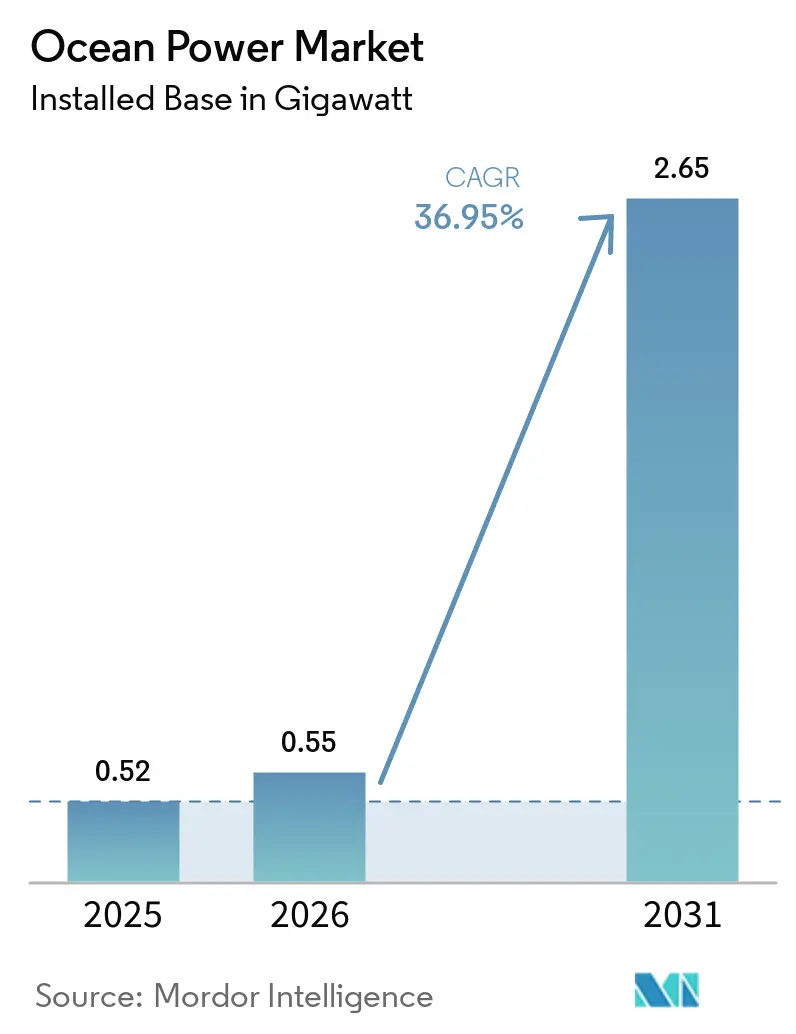
| Market Volume (2026) | 0.55 gigawatt |
| Market Volume (2031) | 2.65 gigawatt |
| Growth Rate (2026 - 2031) | 36.95% CAGR |
| Fastest Growing Market | Asia-Pacific |
| Largest Market | Asia-Pacific |
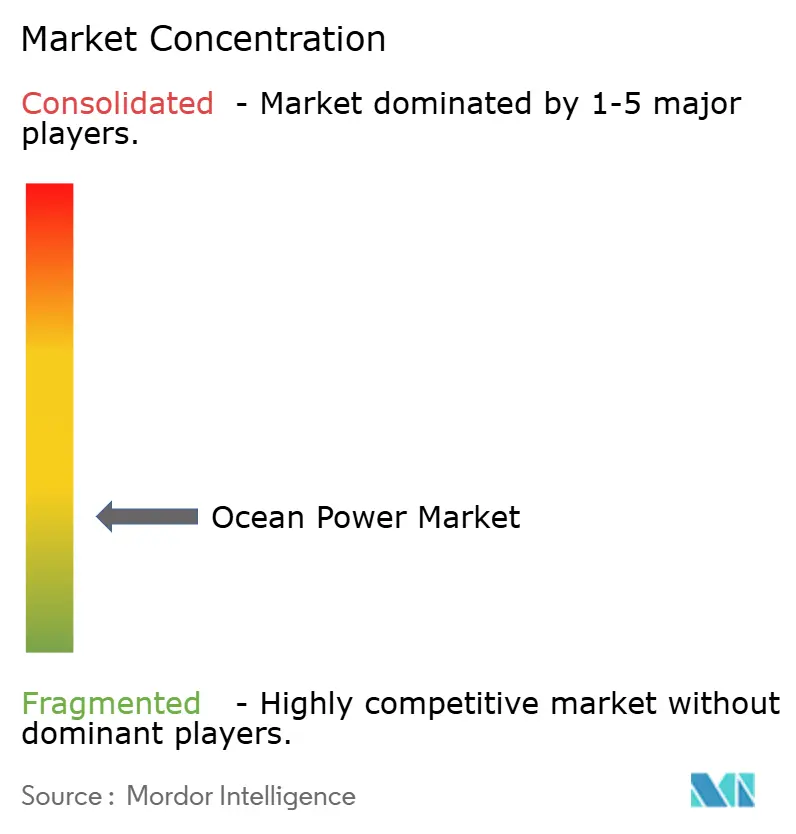
| Market Concentration | Low |
Major Players *Disclaimer: Major Players sorted in no particular order Image © Mordor Intelligence. Reuse requires attribution under CC BY 4.0. | |
Ocean Power Market Analysis by Mordor Intelligence
The Ocean Power Market size in terms of installed base was valued at 0.52 gigawatt in 2025 and is estimated to grow from 0.55 gigawatt in 2026 to reach 2.65 gigawatt by 2031, at a CAGR of 36.95% during the forecast period (2026-2031). Growing installation experience is lowering perceived technology risk, while targeted feed-in tariffs and lease auctions are steering early-stage capital toward bankable tidal and wave projects. Developers are blending marine-energy assets with offshore wind foundations, shared subsea cables, and hydrogen electrolysis, which compresses balance-of-plant costs and accelerates grid integration. A steady decline in the levelized cost of electricity (LCOE) for second-generation tidal turbines, now at USD 0.15 per kWh, positions the technology as a predictable complement to variable wind and solar resources. At the same time, island nations are embracing marine energy as a hedge against diesel-price volatility and shipping disruptions, creating near-term demand for compact, modular systems that can be installed without large cranes or heavy-lift vessels. System reliability is also improving, with several tidal arrays now posting capacity factors above 40%, narrowing the performance gap with fixed-bottom offshore wind.
Key Report Takeaways
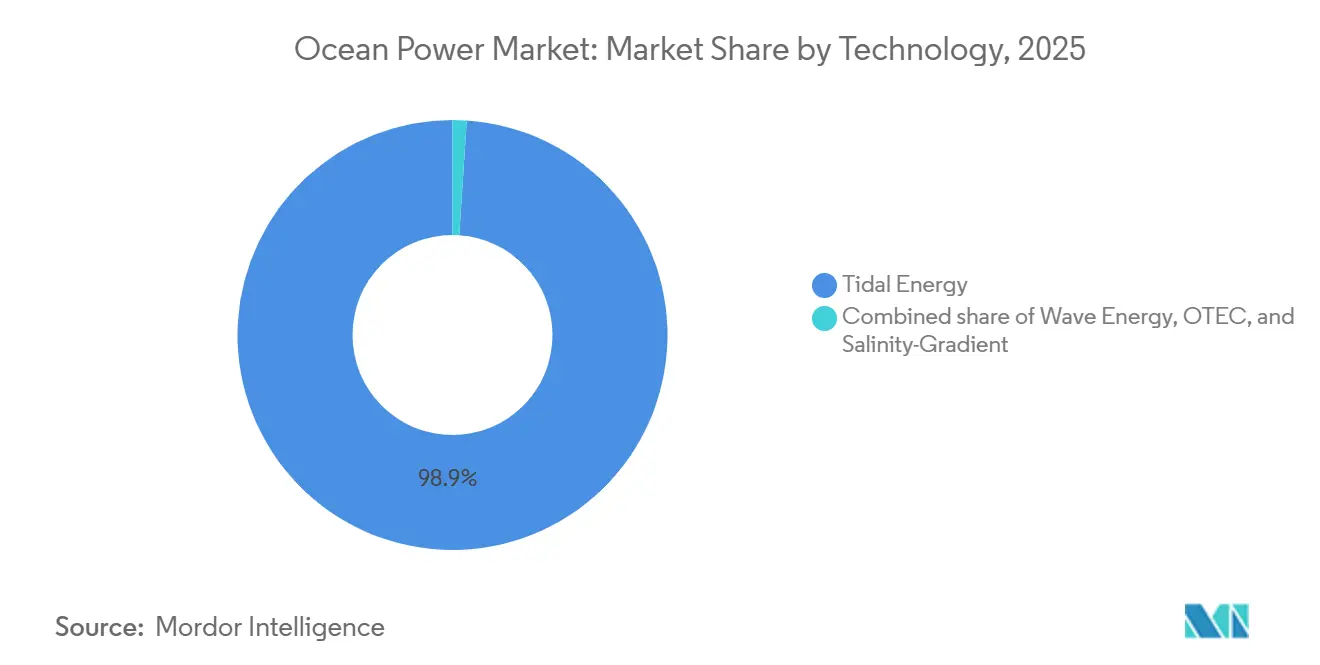
- By technology, tidal energy led with a 98.94% ocean power market share in 2025; ocean thermal energy conversion (OTEC) is forecast to expand at a 120.0% CAGR through 2031.
- By application, power generation accounted for 78.3% of the ocean power market size in 2025, while desalination is advancing at a 41.6% CAGR through 2031.
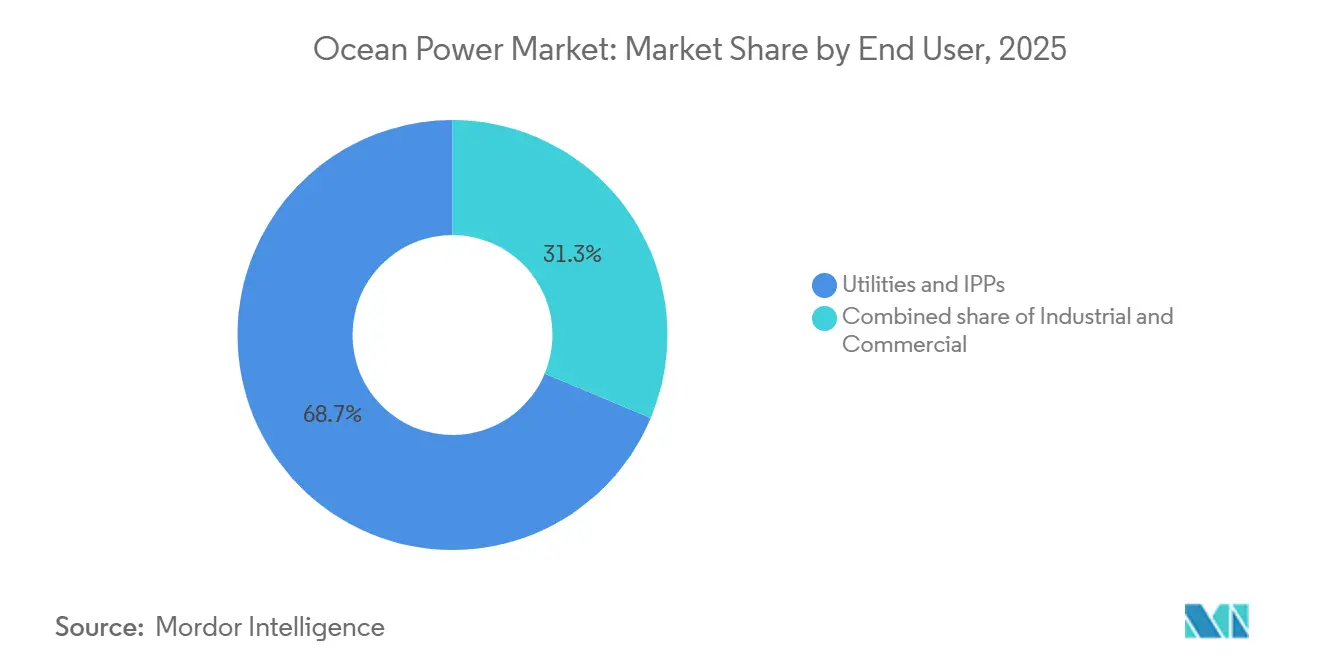
- By end-user, utilities and independent power producers commanded 68.7% of demand in 2025; industrial customers are projected to grow at a 43.7% CAGR to 2031.
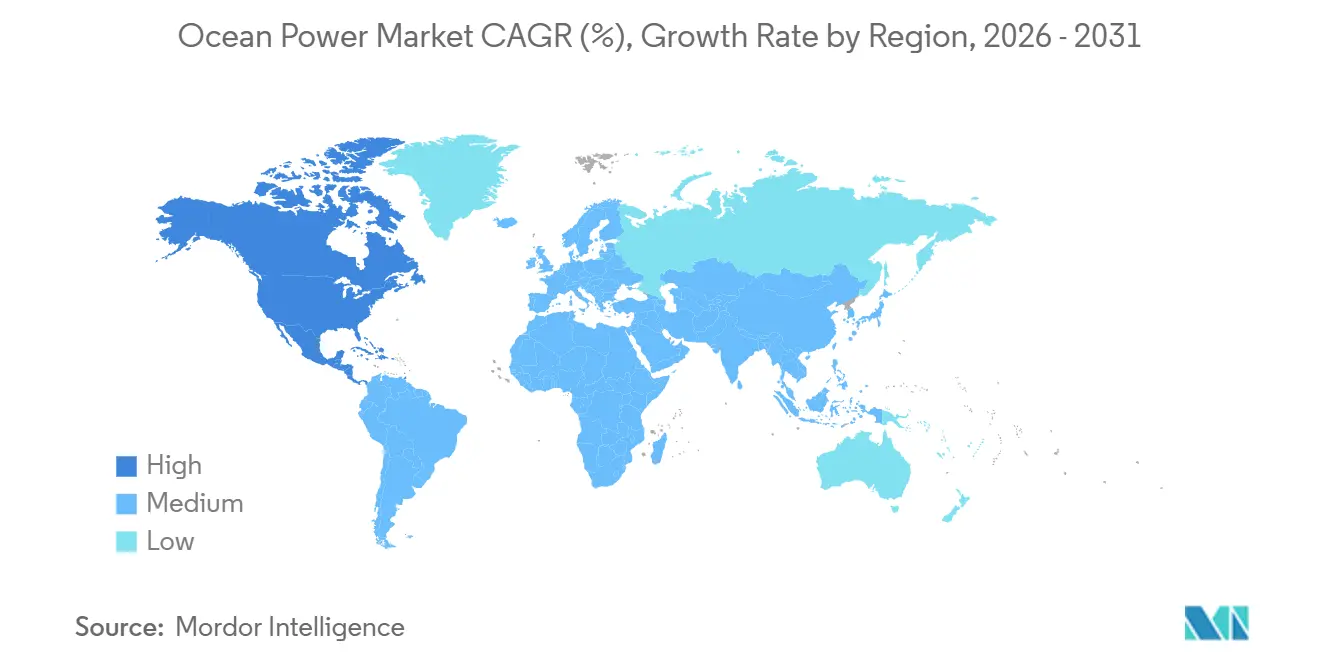
- By region, Asia-Pacific captured 51.15% of installed capacity in 2025, whereas North America is projected to lead growth at a 71.9% CAGR through 2031.
Note: Market size and forecast figures in this report are generated using Mordor Intelligence’s proprietary estimation framework, updated with the latest available data and insights as of January 2026.
Global Ocean Power Market Trends and Insights
Drivers Impact Analysis*
| Driver | (~) % Impact on CAGR Forecast | Geographic Relevance | Impact Timeline |
|---|---|---|---|
| Renewable-energy targets and policy incentives | +8.2% | Global, concentrated in EU, North America, Asia-Pacific | Medium term (2-4 years) |
| Declining LCOE for tidal and wave technologies | +7.5% | North America, Europe, Asia-Pacific coastal nations | Long term (≥ 4 years) |
| Predictable baseload resource availability | +6.1% | Island nations in the Pacific, Caribbean, Indian Ocean | Medium term (2-4 years) |
| Offshore hydrogen and aquaculture co-location | +5.8% | Europe, China, South Korea, Japan | Long term (≥ 4 years) |
| Naval decarbonization requirements | +4.3% | North America, Europe, Asia-Pacific military procurement | Medium term (2-4 years) |
| Island-grid resilience programs | +5.0% | Pacific Islands, Caribbean, Maldives, remote communities | Short term (≤ 2 years) |
| Source: Mordor Intelligence | |||
Renewable-energy targets & policy incentives
National decarbonization roadmaps now feature explicit capacity allocations for marine energy instead of bundling it into residual renewable categories. France set a 250 MW tidal-stream target for 2030 and offers feed-in tariffs of USD 0.16 per kWh that guarantee predictable cash flow, helping developers raise senior debt.[1]French Ministry for Ecological Transition, “Programmation Pluriannuelle de l'Énergie 2025 Update,” ecologie.gouv.fr The United States earmarked USD 112 million in 2025 for wave-energy converter testing at the grid-connected PacWave site off Oregon, giving device manufacturers a route to commercial-scale demonstrations.[2]U.S. Department of Energy, “Water Power Technologies Office FY 2025 Budget,” energy.gov Spain is investing in 60 MW of wave capacity for the Canary Islands to displace liquefied natural-gas imports, underscoring how archipelago jurisdictions are leveraging abundant wave resources for supply security. These policies provide technology-specific price floors that de-risk merchant exposure and encourage equity investors to back first-commercial arrays. As rule-making evolves, early movers are locking in long-term offtake agreements that will underpin the next wave of capacity additions through 2031.
Declining LCOE accelerates commercial viability
Cost reductions stem from turbine upsizing, modular arrays, and design lessons imported from offshore wind. Orbital Marine Power’s 2 MW O2 turbine halves the number of foundations per megawatt, trimming subsea installation costs and simplifying electrical collection. CorPower Ocean’s phase-control system tunes a buoy’s resonance to local sea states, boosting annual energy capture by 30% and pulling levelized costs toward USD 0.18 per kWh in field trials. Shared crew boats and jack-up barges between tidal and wind farms in Scotland have cut O&M expenses by 18%, while automated fiber-placement machines now fabricate composite blades in six weeks instead of twelve. As these process gains propagate, the new-build LCOE gap between marine energy and fixed-bottom offshore wind continues to narrow, expanding the addressable market for dispatchable, low-carbon baseload power.
Predictable baseload resource availability complements intermittent renewables
Tidal currents follow lunar cycles with 98% forecast accuracy, enabling grid operators to schedule dispatch without batteries or fast-ramping gas turbines. Minesto’s Dragon 12 kites recorded a 42% capacity factor in the Faroe Islands, providing 35% of annual electricity demand and eliminating costly diesel peakers. Wave energy is more variable yet still offers 85% accuracy in 72-hour forecasts for significant wave height, letting utilities bid firm capacity into day-ahead markets. Hawaii’s Kaneohe Bay point-absorber array demonstrated that marine energy can shore up island grids during trade-wind lulls when solar and conventional wind falter, cutting curtailment charges and frequency excursions. For archipelagos dependent on imported fuels, predictable baseload output offsets higher upfront capex by insulating ratepayers from volatile oil prices.
Offshore hydrogen production creates synergistic value chains
Marrying tidal-stream power with offshore electrolyzers eliminates onshore grid ties and captures value in green hydrogen, oxygen, and seawater-cooled data centers. Scotland’s Orkney Islands pilot produces 40 kg of hydrogen per day for ferry refueling, while waste heat warms seaweed aquaculture pens, elevating kelp growth by 18%.[3]European Marine Energy Centre, “Annual Report 2025,” emec.org.uk South Korea’s Shinan complex integrates 50 MW of tidal generation and supplies hydrogen to nearby fertilizer plants, sharing moorings and ports to improve project IRR by four percentage points. Chinese authorities green-lit 15 MW of tidal-hydrogen pilot projects in Zhejiang that bundle steel decarbonization with marine-energy leasing, illustrating how vertical integration attracts industrial offtakers that value both electrons and molecules Cnooc.Com.Cn. These colocation models rewrite conventional cost structures and accelerate large-scale uptake in heavy industry.
Restraints Impact Analysis*
| Restraint | (~) % Impact on CAGR Forecast | Geographic Relevance | Impact Timeline |
|---|---|---|---|
| High capex and financing hurdles | -4.8% | Global, particularly emerging markets with limited project finance | Medium term (2-4 years) |
| Complex environmental permitting | -3.2% | Europe, North America, select Asia-Pacific coastal zones | Short term (≤ 2 years) |
| Advanced-composite supply bottlenecks | -2.1% | Global, carbon-fiber manufacturing hubs | Medium term (2-4 years) |
| Non-standard grid-code compliance | -1.7% | Regional, affecting variable-frequency tidal generators and island microgrids | Short term (≤ 2 years) |
| Source: Mordor Intelligence | |||
High CAPEX requirements challenge project financing
Marine-energy arrays cost USD 4,000-7,000 per kW up front, versus USD 1,300 for offshore wind, deterring commercial lenders that lack actuarial data on component lifetimes. Orbital Marine Power secured USD 36.93 million in 2024 only after the UK Infrastructure Bank guaranteed 60% of construction risk, illustrating that public backstops remain critical.[4]UK Infrastructure Bank, “Project Financing for Marine Energy,” ukib.org.uk Carnegie Clean Energy slipped into voluntary administration in 2024 after a 42% cost overrun on its Western Australian wave project, highlighting the sector’s exposure to subsea-construction contingencies. Emerging-market developers often face debt costs above 8% because transactions are sub-20 MW and lack standardized templates. Blended-finance structures with multilateral lenders help, but they introduce complex covenant stacks that erode project returns.
Complex environmental permitting delays project development
Regulators require multi-year baseline studies on marine mammals and benthic habitats, adding EUR 2-4 million to pre-FID budgets for a 10 MW tidal array under the EU Marine Strategy Framework Directive. The United States obliges developers to coordinate with seven federal agencies, extending approval cycles to five years for novel designs. Eco Wave Power’s Gibraltar expansion endured 18 months of additional scrutiny over bluefin tuna migration despite acoustic monitoring that showed negligible impact. As a result, permitting risk pushes up equity return hurdles and delays revenue realization, especially for first-of-a-kind devices.
*Our forecasts treat driver/restraint impacts as directional, not additive. The impact forecasts reflect baseline growth, mix effects, and variable interactions.
Segment Analysis
By Technology: Tidal Dominance Masks OTEC Growth Potential
Tidal energy delivered 98.94% of installed capacity in 2025, reflecting validated component lifetimes and capacity factors above 40% that anchor utility-scale bankability. The ocean power market size for tidal is poised to maintain leadership even as competing designs mature, because site developers can leverage subsea cables and maintenance fleets originally built for offshore wind. Minesto’s low-velocity kite devices open new geographies where fixed-axis rotors cannot function, unlocking an estimated 10 GW of previously stranded resource. Wave energy, still under 50 MW globally, is improving availability through phase-control buoy systems that shave structural loads during storm peaks. OTEC, though negligible today, will grow at a triple-digit pace as floating platforms bypass costly onshore cold-water pipes and pair electricity sales with desalination and aquaculture revenue. Compliance with IEC 62600 standards is accelerating cross-border equipment sales, expanding addressable capacity in the ocean power market.
Floating, multi-output OTEC prototypes such as Bluerise’s 1.5 MW platform scheduled for 2027 combine electricity, freshwater, and chilled-water aquaculture in one hull, widening revenue streams while spreading fixed costs. Wave devices like CorPower’s C4 achieve real-time resonance tuning that pulls unit-cost metrics toward utility triggers for procurement. Tidal technology will remain the backbone of cumulative installations through 2031, especially in Canada’s Bay of Fundy and Indonesia’s Lombok Strait, where current velocities support 45% capacity factors. However, the diversified pipeline suggests that by 2031, more than 25% of new capacity additions will come from non-tidal systems, signaling a slow but steady broadening of the ocean power market technology mix.


By Application: Desalination’s Rapid Rise
Power generation captured 78.3% of demand in 2025 because utilities sought dispatchable renewables to hedge against thermal plant retirements. The ocean power market size associated with desalination is now climbing sharply as wave-driven reverse osmosis sidesteps the need for batteries on remote islands. Gibraltar’s Eco Wave Power plant supplies 500 m³ per day of potable water, using storage tanks rather than lithium-ion systems to smooth variable output, thus trimming system cost by 35%. Carnegie’s CETO design pressurizes seawater subsea, eliminating high-energy pumps onshore and cutting desalination energy budgets by 40%. As diesel-powered desalination costs approach USD 2.50 per m³ in the Maldives, dual-purpose marine-energy systems improve project IRR by 6–8 percentage points compared with electricity-only configurations, ensuring that desalination’s 41.6% CAGR remains intact through 2031.
Telecommunications and data platforms are a nascent but lucrative use case, with subsea data centers seeking 1-5 MW of compact tidal power to avoid lengthy export cables. Microsoft’s Project Natick validated energy savings from ambient seawater cooling and could seed a pipeline of subsea compute facilities powered entirely by tidal arrays. Marine propulsion applications, though small today, are drawing navy and commercial shipping interest for auxiliary onboard power that trims fuel bills by 10%. Cumulatively, multi-product offerings will unlock new revenue pools and deepen the penetration of ocean power market technologies in water-stressed and logistics-constrained locations.
By End-User: Industrial Offtakers Accelerate Hydrogen Integration
Utilities and independent power producers absorbed 68.7% of 2025 installations, propelled by feed-in tariffs that deliver predictable returns. Industrial customers, however, are forecast to grow at 43.7% CAGR as they co-locate electrolyzers with tidal turbines to manufacture green hydrogen for ammonia synthesis, steelmaking, and chemical feedstocks. The Shinan project in South Korea pairs 50 MW of tidal generation with electrolysis and seaweed farming, supplying 8,000 ton of hydrogen annually to nearby steel mills. Zhejiang province in China is backing 15 MW of tidal-hydrogen pilots that will feed refineries consuming about 200,000 t of hydrogen yearly. Because industrial firms internalize avoided carbon-tax liabilities and ESG premiums, they tolerate higher capex and anchor long-term offtake contracts that stabilize developer cash flow.
Commercial users, including island resorts, marinas, and aquaculture farms, adopt modular wave units below 500 kW to rid themselves of diesel logistics. A Norwegian salmon farm cut diesel usage by 1.8 million L annually and saved USD 1.2 million in operating costs by adopting a 1 MW wave array. This broadening customer base reduces exposure to single-buyer risk and cushions the ocean power market against policy shifts in any one jurisdiction. Utilities will maintain scale leadership, but the fastest incremental megawatts will come from industrial customers eager to decarbonize hard-to-abate processes.
Geography Analysis
Asia-Pacific commanded 51.15% of global capacity in 2025 as China alone installed 270 MW of tidal-stream projects in Zhejiang and Fujian, leveraging offshore wind supply chains to slash transmission costs by 22% Nea.Gov.Cn. South Korea's Sihwa barrage generated 552 GWh in 2025, proving that estuary-scale projects with 9-m tidal ranges can secure 25% capacity factors and attract sovereign-wealth financing. Japan funded four wave pilots totaling 12 MW for remote islands where diesel displacement saves USD 0.35 per kWh, while Australia deployed 8 MW of wave capacity off Perth that feeds desalination for coastal mining operations. Across Southeast Asia, untapped straits in Indonesia and the Philippines offer 18 GW of theoretical resource, but grid constraints and absent tariffs leave installed capacity below 5 MW.
North America is set to record a 71.9% CAGR through 2031 following the US Bureau of Ocean Energy Management's 2025 auction for 600 MW of tidal and wave leases off Oregon, California, and Maine. The PacWave test site supplies real-time performance metadata that satisfies lender due-diligence standards, unlocking commercial debt for pre-commercial arrays. Canada's Bay of Fundy floating tidal farm achieved a 38% capacity factor in 2024 without seabed anchors, while Mexico's Baja California is procuring 15 MW of wave capacity to feed agricultural desalination facilities. Regulatory streamlining by the Federal Energy Regulatory Commission in 2024 reduced marine-energy licensing timelines to three years for projects under 5 MW, signaling that policy frictions are abating.
Europe's market is anchored by the UK's 12 MW MeyGen array and France's 250 MW tidal-stream roadmap under the Programmation Pluriannuelle de l’Énergie. The UK Crown Estate issued 11 seabed leases in 2025 worth up to 1 GW, while Spain's Basque Energy Agency commissioned a 2 MW oscillating water column that serves 600 households. The Netherlands integrated a 10 MW tidal array with offshore wind to balance grid frequency during calm periods, and Denmark's WavePiston installed 5 MW of modular wave plates targeting cost parity with wind by 2029. South America and the Middle East remain subscale, with Brazil's 10 MW Pecém wave project stalled over financing and Saudi Arabia's 5 MW Red Sea pilot postponed amid permitting reviews, underlining regional disparities in investment readiness.

Competitive Landscape
The ocean power market is moderately fragmented. Orbital Marine Power and SIMEC Atlantis Energy lead tidal deployments at 8 MW and 6 MW, respectively, yet both rely on development-bank loans and public guarantees, signaling that private-sector risk appetite remains thin. Wave technology providers such as CorPower Ocean, Eco Wave Power, and Bombora pursue divergent architectures, hydraulic pistons, oscillating arms, or submerged membranes, each creating unique supply chains that preclude component standardization. Minesto’s low-velocity kites enter sites too deep or slow for fixed rotors, while start-ups like OceanBased Perpetual Energy target sub-500 kW modular units for island microgrids ignored by large utilities.
Strategic moves reflect vertical integration and cross-industry collaboration. IHI Corporation partnered with Japan’s Ministry of Defense in 2025 to migrate aerospace-grade composites into tidal blades, reducing weight by 25% and improving fatigue life. Hyundai Heavy Industries purchased 30% of a domestic tidal developer in 2024 to exploit shipyard automation that lowers turbine fabrication costs by 18%. Patent filings grew 40% in 2025, focused on variable-pitch rotor blades, intelligent power-take-off algorithms, and hybrid subsea cable architectures, indicating a maturing intellectual-property race. Compliance with IEC 62600 testing is emerging as a market gatekeeper, with utilities favoring devices bearing third-party certificates that de-risk insurance premiums and downtime. Consolidation will rise modestly as larger OEMs buy niche innovators, but bespoke engineering for each site will keep the overall market concentration moderate.
Ocean Power Industry Leaders
SIMEC Atlantis Energy
Orbital Marine Power
Ocean Power Technologies Inc.
Eco Wave Power Global AB
Carnegie Clean Energy
- *Disclaimer: Major Players sorted in no particular order

Recent Industry Developments
- March 2026: Eco Wave Power successfully completed a pilot test agreement with Shell at the Port of Los Angeles, which included a comprehensive project lifecycle analysis. Additionally, the company expanded its activities in South Africa by completing a feasibility study at the Port of Ngqura to assess the potential for wave energy deployment at the location.
- July 2025: Eco Wave Power Global AB entered into an agreement with C&S Welding Inc. to install its wave energy floaters and energy conversion unit at the Port of Los Angeles.
- July 2025: Wales and Galicia collaborated to advance tidal energy blade technology, improving the efficiency and performance of tidal energy systems through an international partnership.
- May 2025: CorPower Ocean, a Swedish wave energy developer, signed a berth agreement to establish a 5 MW wave energy array at the European Marine Energy Centre (EMEC) in Orkney, Scotland.


Global Ocean Power Market Report Scope
Ocean Power Technologies (OPT) stands at the forefront of renewable wave energy. The company crafts systems, including the PowerBuoy, that tap into energy from waves, wind, and solar sources. These innovations cater to remote offshore, defense, and commercial needs. OPT's autonomous and self-sufficient systems not only generate power but also facilitate data communications, bolstering maritime intelligence and offshore endeavors. As a result, they play a pivotal role in sectors like security, energy, and defense.
The ocean power market is segmented by technology, application, end-user, and geography. By technology, the market is segmented into tidal energy, wave energy, OTEC, and salinity-gradient. By application, the market is segmented into power generation, desalination, marine propulsion, and data & telecom platforms. By end-user, the market is segmented into utilities and IPPs, industrial, and commercial. The report also covers the market size and forecasts for 21 countries across major regions. Market forecasts are provided in terms of volume (GW).
| Tidal Energy |
| Wave Energy |
| Ocean Thermal Energy Conversion (OTEC) |
| Salinity-Gradient (Blue Energy) |
| Power Generation |
| Desalination |
| Marine Propulsion |
| Data & Telecom Platforms |
| Utilities and IPPs |
| Industrial |
| Commercial |
| North America | United States |
| Canada | |
| Mexico | |
| Europe | United Kingdom |
| France | |
| Spain | |
| Netherland | |
| Denmark | |
| Russia | |
| Rest of Europe | |
| Asia-Pacific | China |
| India | |
| Japan | |
| South Korea | |
| ASEAN Countries | |
| Australia and New Zealand | |
| Rest of Asia-Pacific | |
| South America | Brazil |
| Argentina | |
| Colombia | |
| Rest of South America | |
| Middle East and Africa | United Arab Emirates |
| Saudi Arabia | |
| South Africa | |
| Egypt | |
| Rest of Middle East and Africa |
| By Technology | Tidal Energy | |
| Wave Energy | ||
| Ocean Thermal Energy Conversion (OTEC) | ||
| Salinity-Gradient (Blue Energy) | ||
| By Application | Power Generation | |
| Desalination | ||
| Marine Propulsion | ||
| Data & Telecom Platforms | ||
| By End-User | Utilities and IPPs | |
| Industrial | ||
| Commercial | ||
| By Region | North America | United States |
| Canada | ||
| Mexico | ||
| Europe | United Kingdom | |
| France | ||
| Spain | ||
| Netherland | ||
| Denmark | ||
| Russia | ||
| Rest of Europe | ||
| Asia-Pacific | China | |
| India | ||
| Japan | ||
| South Korea | ||
| ASEAN Countries | ||
| Australia and New Zealand | ||
| Rest of Asia-Pacific | ||
| South America | Brazil | |
| Argentina | ||
| Colombia | ||
| Rest of South America | ||
| Middle East and Africa | United Arab Emirates | |
| Saudi Arabia | ||
| South Africa | ||
| Egypt | ||
| Rest of Middle East and Africa | ||


Key Questions Answered in the Report
How fast is the ocean power market expected to grow through 2031?
Installed capacity is forecast to reach 2.65 GW in 2031, expanding at a 36.95% CAGR from 2026.
Which technology dominates current installations?
Tidal-stream systems supplied 98.94% of global capacity in 2025 thanks to proven component lifetimes and 40% capacity factors.
Why are island nations prioritizing marine energy over solar or wind?
Tidal and wave resources provide predictable baseload output that stabilizes frequency and displaces costly diesel imports.
What drives industrial demand for marine energy?
Co-located electrolyzers turn tidal electricity into green hydrogen for ammonia and steel production, helping firms cut Scope 1 emissions.
How are governments supporting project finance?
Policy mechanisms include feed-in tariffs, sovereign loan guarantees, and dedicated lease areas that reduce revenue and permitting risk.
Which geography dominates current installations?
Asia-Pacific accounted for 51.15% of the installed capacity in 2025, while North America is expected to lead growth with a CAGR of 71.9% through 2031.
Page last updated on:


