
Diesel As Fuel Market Size and Share
Market Overview
| Study Period | 2021 - 2031 |
|---|---|
| Market Size (2026) | USD 263.19 Billion |
| Market Size (2031) | USD 310.03 Billion |
| Growth Rate (2026 - 2031) | 3.33 % |
| Fastest Growing Market | Asia Pacific |
| Largest Market | Asia Pacific |
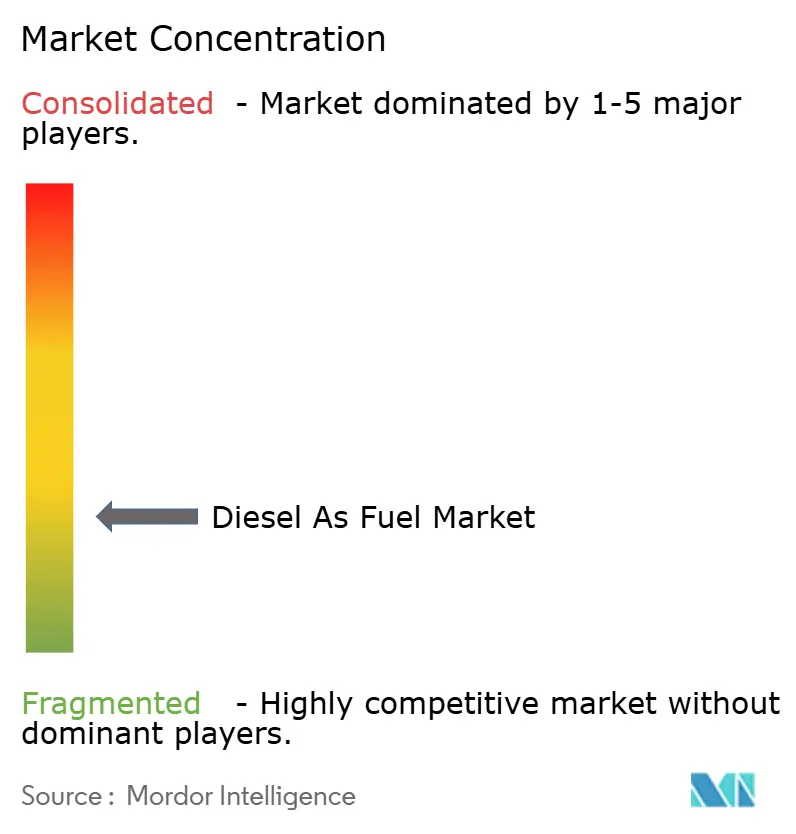
| Market Concentration | Low |
Major Players *Disclaimer: Major Players sorted in no particular order Image © Mordor Intelligence. Reuse requires attribution under CC BY 4.0. | |
Diesel As Fuel Market Analysis by Mordor Intelligence
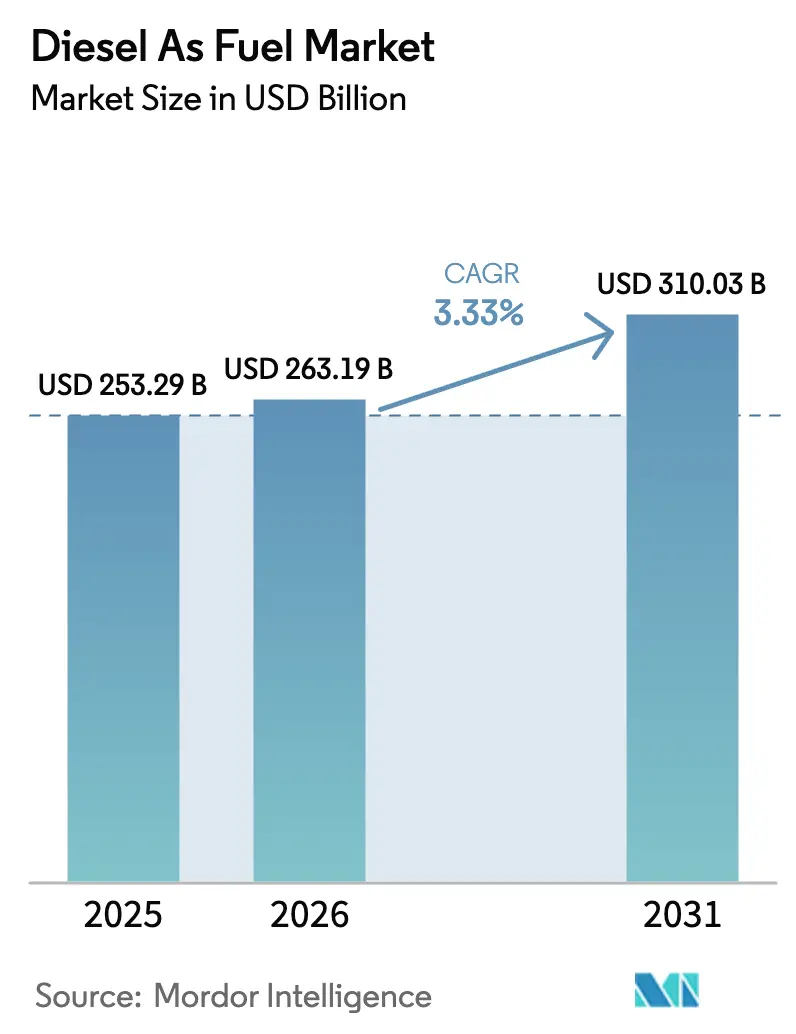
The Diesel As Fuel Market size was valued at USD 253.29 billion in 2025 and is estimated to grow from USD 263.19 billion in 2026 to reach USD 310.03 billion by 2031, at a CAGR of 3.33% during the forecast period (2026-2031).
Freight recovery after the pandemic, coupled with sustained industrial activity, underpins steady global volume even as carbon-pricing schemes challenge margins in OECD countries. The pivot toward ultra-low-sulfur diesel (ULSD) continues to compress refining spreads, yet it creates price premiums for suppliers that can meet stringent fuel-quality rules. Rapid growth in biodiesel blending, data-center backup power, and marine bunker fuel offsets demand erosion in urban bus fleets that are electrifying at a pace. Competitive dynamics hinge on refiners’ capacity to co-process renewable feedstocks, invest in synthetic diesel pilots, and supply high-cetane grades for specialized applications.
Key Report Takeaways
- By grade, ULSD held 67.5% of the diesel fuel market share in 2025. Biodiesel blends spanning B5–B20 are expanding at a 7.5% CAGR through 2031.
- By application, on-road transportation accounted for 73.8% of the diesel fuel market size in 2025, while marine bunker fuel is advancing at a 5.2% CAGR to 2031.
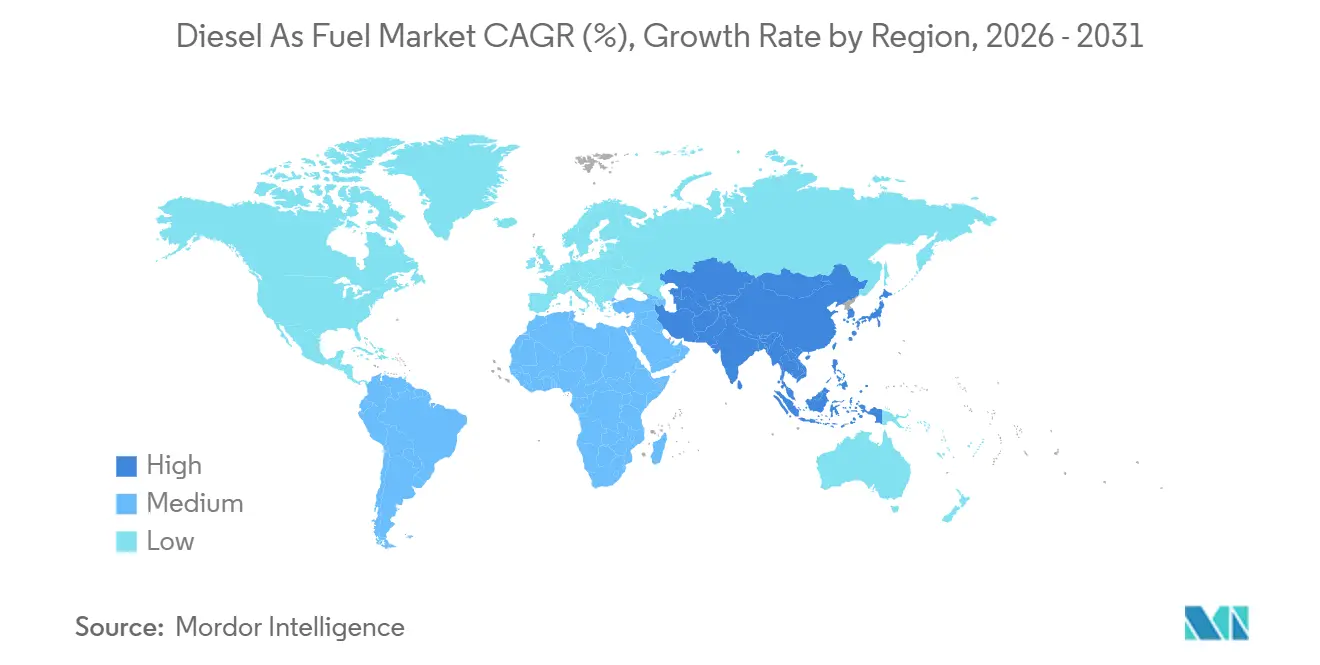
- Asia-Pacific commanded 42.1% of 2025 consumption, and its diesel fuel market size is forecast to grow at a 3.9% CAGR to 2031.
- Shell, BP, and TotalEnergies collectively controlled about 18% of global supply in 2025, while the top 10 players together accounted for roughly 55% of output.
Note: Market size and forecast figures in this report are generated using Mordor Intelligence’s proprietary estimation framework, updated with the latest available data and insights as of January 2026.
Market Trends and Insights
Drivers Impact Analysis of Diesel As Fuel Market*
| Driver | (~) % Impact on CAGR Forecast | Geographic Relevance | Impact Timeline |
|---|---|---|---|
| Rapid truck & bus fleet growth in emerging Asia | +0.8% | Asia-Pacific core, spillover to Middle East | Medium term (2-4 years) |
| Surging demand for backup power in data-center buildouts | +0.4% | Global, concentrated in North America & Asia-Pacific | Short term (≤ 2 years) |
| Post-pandemic rebound in global marine freight ton-miles | +0.6% | Global, led by Asia-Europe and transpacific routes | Medium term (2-4 years) |
| Government-mandated ULSD adoption | +0.5% | Global, accelerating in South America & Middle East | Long term (≥ 4 years) |
| Rise of synthetic e-diesel pilots in Europe | +0.2% | Europe, early adoption in Germany & Netherlands | Long term (≥ 4 years) |
| Mining sector’s shift from coal to high-cetane diesel blends | +0.3% | South America, Australia, South Africa | Medium term (2-4 years) |
| Source: Mordor Intelligence | |||
Rapid Truck & Bus Fleet Growth in Emerging Asia
Commercial vehicle registrations in India, Indonesia, and Vietnam climbed 11% in 2025, outstripping GDP growth as e-commerce and cold-chain logistics widen beyond metro hubs.[1]Joe Brock, “Asia’s Truck Sales Surge,” Reuters, reuters.com India’s Bharatmala highway program added 4,200 km of expressways, encouraging operators to deploy heavier trucks that consume 18% more fuel per ton-kilometer. ASEAN delays in adopting Euro-V emission norms keep diesel engines dominant for buses, effectively locking in demand through at least 2029. China’s Belt and Road corridors channel diesel-powered freight into Central Asia, where sparse charging infrastructure preserves a 30% cost edge over liquefied natural gas. Together, these factors lift regional demand and provide a structural tailwind for the diesel fuel market.
Surging Demand for Backup Power in Data-Center Buildouts
Hyperscalers commissioned 18 GW of data-center capacity in 2025, and each megawatt requires roughly 1.2 million L of on-site diesel storage to guarantee 99.999% uptime.[2]IEA, “Data Centers and Electricity Demand,” iea.org Amazon Web Services and Microsoft Azure now specify ULSD with cetane above 50 to limit particulate emissions during generator tests, raising procurement standards industry-wide. Where grids remain unreliable, such as in India and parts of sub-Saharan Africa, gensets run continuously, driving per-facility use above 8 million L annually. The International Energy Agency forecasts 9.2% annual diesel demand growth from data-center backup through 2028, reinforcing the diesel fuel market’s resilience despite broader decarbonization policies.
Post-Pandemic Rebound in Global Marine Freight Ton-Miles
Container volumes hit 187 million TEU in 2025, exceeding 2019 levels as inventory restocking and near-shoring strategies buoyed activity. The International Maritime Organization’s sulfur cap prompted shipowners to adopt ULSD-compliant marine gas oil, lifting demand for low-sulfur distillates despite higher bunker costs. Maersk and CMA CGM are piloting methanol dual-fuel vessels, yet diesel will dominate marine fuel through 2030 because alternative-fuel retrofits remain capital-intensive. Tanker and bulk-carrier segments face lighter decarbonization pressure, ensuring continued diesel growth and supporting the diesel fuel market.
Government-Mandated ULSD Adoption
Brazil, Saudi Arabia, and the UAE introduced 10-ppm sulfur limits in 2024-2025, aligning with EU and U.S. standards and tightening the global supply of high-sulfur grades.[3]David Sheppard, “Refiners Brace for ULSD Mandates,” Financial Times, ft.com Refiners invested USD 200–500 million per hydrotreating unit to meet specifications, but premium pricing enables payback within six years. India’s Bharat Stage VI experience serves as a template for other South Asian markets, while ISO 8217 marine fuel rules accelerate ULSD penetration in port cities. These mandates secure a durable compliance-driven pull for the diesel fuel market.
Restraints Impact Analysis of Diesel As Fuel Market*
| Restraint | (~) % Impact on CAGR Forecast | Geographic Relevance | Impact Timeline |
|---|---|---|---|
| Rapid electrification of city bus fleets | -0.6% | Global, led by China, Europe, select U.S. cities | Short term (≤ 2 years) |
| Stringent carbon-pricing schemes in OECD economies | -0.5% | Europe, North America, select Asia-Pacific markets | Medium term (2-4 years) |
| AI-optimized route planning cutting long-haul diesel usage | -0.3% | North America & Europe logistics hubs | Medium term (2-4 years) |
| Growing investor divestment from fossil-fuel refining | -0.4% | Global, concentrated in publicly traded refiners | Long term (≥ 4 years) |
| Source: Mordor Intelligence | |||
Rapid Electrification of City Bus Fleets
Shenzhen converted its 16,000-bus fleet to battery-electric in 2024, displacing 345 million L of diesel annually and setting a standard replicated by other tier-1 cities. London ordered 500 electric double-deckers in 2025 as part of a diesel phase-out by 2030. Electric buses captured 28% of 2025 global urban procurements, up from 12% in 2022, driven by battery costs below USD 100/kWh and dense charging networks. Intercity and rural routes remain diesel-reliant due to range limits, creating a split that compresses urban demand yet sustains growth in peri-urban segments, with mixed implications for the diesel fuel market.
Stringent Carbon-Pricing Schemes in OECD Economies
EU ETS allowances averaged EUR 85/tCO₂ in early 2025, adding EUR 0.23/L to diesel pricing and curbing German and French demand by 3.2% year-over-year.[4]Kate Abnett, “EU Carbon Price Tops €85,” Reuters, reuters.com California’s Low Carbon Fuel Standard lifts costs USD 0.18/gal, pushing fleets toward renewable diesel and compressed natural gas. Canada’s carbon tax reached CAD 170/t in 2025, encouraging modal shift to rail. Rising compliance costs consolidate market share toward integrated refiners capable of absorbing administrative overheads, tempering growth prospects within the diesel fuel market.
*Our forecasts treat driver/restraint impacts as directional, not additive. The impact forecasts reflect baseline growth, mix effects, and variable interactions.
Diesel As Fuel Market Segment Analysis
By Grade:
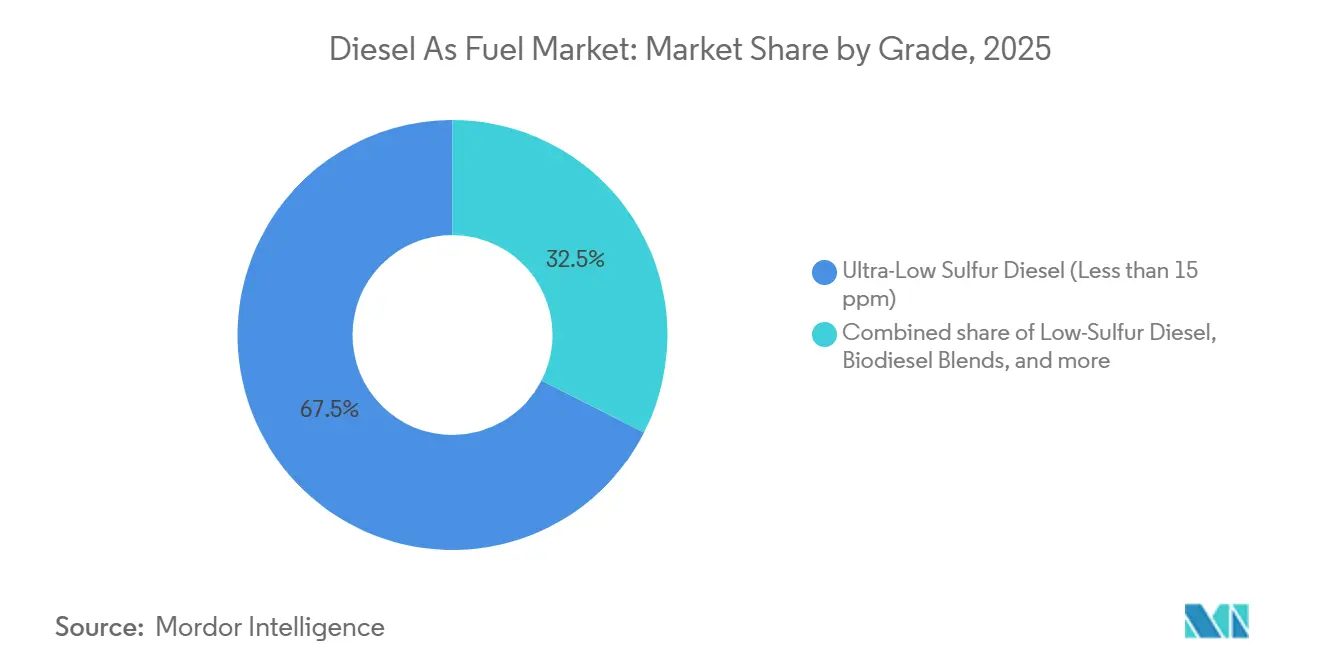
ULSD Dominance Meets Biodiesel MomentumULSD below 15 ppm sulfur captured 67.5% of 2025 demand as regulators converged on tighter emission standards. Low-sulfur diesel in the 15-500 ppm tier lingers in markets with under-invested refinery assets, while high-sulfur grades shrink to a sub-3% niche by 2028. Biodiesel blends from B5 to B20 are advancing 7.5% annually on the back of Brazil’s B15 mandate, EU renewable quotas, and U.S. state tax incentives. The diesel fuel market size for biodiesel blends is projected to reach USD 72 billion by 2031, expanding its footprint alongside conventional ULSD. Synthetic diesel remains pilot-scale, yet USD 1.2 billion in 2025 venture funding signals a pathway to commercialization.
Premium pricing on ULSD offsets USD 2-3/bbl hydrotreating costs, rewarding refiners with deep desulfurization capacity. Blending of fatty-acid methyl esters drives demand for high-cetane base stocks that maintain oxidative stability, providing a margin uplift for hydrocracking-equipped plants. Synthetic diesel’s 85% lower life-cycle emissions position it as a compliance lever for fleets under carbon-intensity caps, though USD 1.80/L production costs presently confine uptake to high-value niches. Collectively, grade shifts illustrate how environmental mandates are reshaping value pools within the diesel fuel market.



By Application:
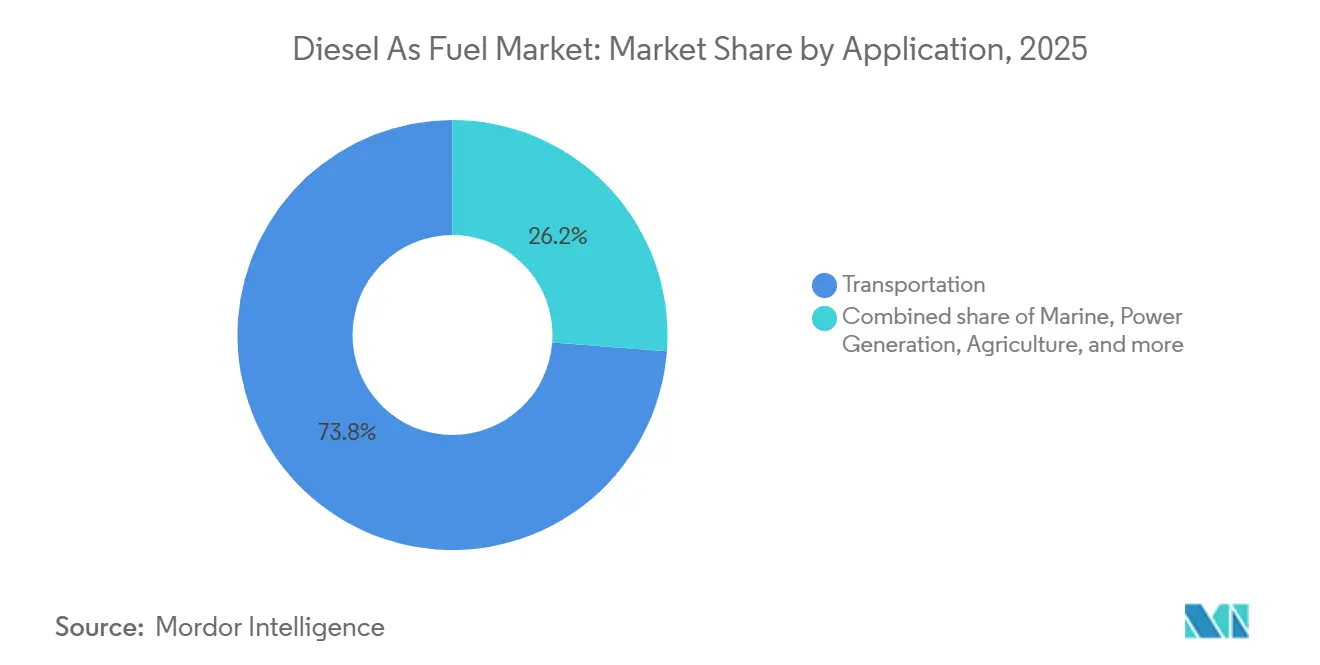
Transportation Leads, Marine AcceleratesOn-road transportation held 73.8% of 2025 diesel consumption, spanning heavy-duty trucks, buses, and light commercial vans. Marine bunker fuel is growing 5.2% annually as shipping volumes rebound and shipowners pivot to low-sulfur blends. Industrial equipment retains a stable share, anchored by construction and mining machinery operating off-grid. Agricultural demand increases modestly in emerging markets as mechanization spreads, but precision farming and electric implements trim growth in OECD regions. Power generation via diesel gensets expands 6.8% in locales with unstable grids, propelled by hyperscale data-center and telecom-tower installations.
Marine outperformance stems from high retrofit costs, USD 5-15 million per vessel, to switch fuels, locking owners into diesel through at least 2030. While urban delivery fleets electrify quickly, battery weight and charging times keep long-haul trucks diesel-dependent. Farming demand diverges: India and Brazil expand mechanized acreage, whereas European farmers favor biodiesel blends to satisfy sustainability metrics. These cross-currents ensure the diesel fuel market accommodates both legacy mass-scale transportation and emerging specialized applications.
Geography Analysis
APAC Diesel As Fuel Market
Asia-Pacific accounted for 42.1% of 2025 global consumption and is set to grow 3.9% annually through 2031. India’s highway expansion and Dedicated Freight Corridor projects channel diesel trucks into underserved regions, while local refiners added 12% ULSD capacity to align with Bharat Stage VI norms. China’s tier-1 cities watch demand slide as electric buses proliferate, yet intercity freight remains diesel-intensive due to sparse charging infrastructure. ASEAN economies, notably Indonesia and Vietnam, sustain growth because Euro-III engines remain legal, and e-commerce fuels fleet additions. Australia’s mining sector anchors high-cetane diesel demand, preserving volume despite broader regional decarbonization pressures.
Europe and North America Diesel As Fuel Market
Europe experiences a 1.8% annual contraction as carbon pricing, low-emission zones, and fleet electrification shrink passenger-vehicle consumption. Germany, France, and the U.K. lead the decline, though heavy-duty trucking and marine bunker fuel stabilize aggregate demand. EU Renewable Energy Directive III boosts biodiesel and synthetic diesel uptake, with Germany and the Netherlands hosting most pilot plants. North America grows 2.1% on robust freight along the U.S.–Mexico–Canada corridor and escalating data-center backup needs. East Coast refinery closures tightened distillate stocks in 2025, prompting record imports and underscoring supply-chain exposure.
MEA and South America Diesel As Fuel Market
South America and the Middle East emerge as growth pockets. Brazil’s B15 mandate and mechanized farming push volumes upward, while Argentina’s Vaca Muerta shale boom lifts diesel for drilling operations. Saudi Arabia and the UAE increase ULSD capacity to satisfy domestic demand and export to Africa and South Asia, leveraging feedstock cost advantages. Sub-Saharan Africa remains a frontier, with diesel powering generators, irrigation, and mining, yet infrastructure gaps temper expansion. South Africa’s transition to Euro-V standards raises quality benchmarks, but uneven enforcement outside major cities limits full compliance.

Regulatory Landscape
Diesel fuel regulation continues to tighten around sulfur limits and tailpipe emissions control, which is pushing demand toward ultra-low-sulfur diesel (ULSD) and higher-quality distillates. Several markets moved toward 10 ppm sulfur limits during 2024-2025 (including Brazil, Saudi Arabia, and the UAE), aligning with mature OECD frameworks and reinforcing the need to meet fuel specification requirements such as ASTM D975 and EN 590 for market access.
Policy enforcement and market oversight are also shaping diesel pricing and transparency dynamics. In the United States, California regulators (through the California Energy Commission and its Division of Petroleum Market Oversight) have flagged scrutiny of wholesale diesel pricing mechanisms and transparency in 2026, adding a governance layer alongside carbon-intensity and fuel-quality programs that already affect procurement, compliance documentation, and blending strategies.
Competitive Landscape
Roughly 55% of global output resides with the 10 largest refiners and national oil companies, signaling moderate concentration. Exxon Mobil, Shell, BP, and TotalEnergies co-process renewable feedstocks at legacy sites, preserving utilization and satisfying decarbonization targets. Shell’s Pernis refinery blended 1.2 million t of renewable input in 2025, producing EN 590-compliant fuel for European markets. State-owned players such as Saudi Aramco, Sinopec, and PetroChina add capacity across Asia and the Middle East to serve freight-driven demand where carbon pricing is limited. Indian Oil Corporation and Reliance Industries dominate South Asia, leveraging scale to serve domestic and export markets.
White-space opportunities center on synthetic diesel, biodiesel infrastructure, and high-cetane formulations. Smaller refiners are installing hydrotreaters to access ULSD premiums, while technology firms race to patent catalysts and stabilization additives; patent filings rose 18% in 2024-2025. Compliance with ASTM D975 and EN 590 standards grants market access in OECD regions, making quality assurance a competitive lever. Capital allocation now divides: integrated majors hedge exposure with renewable projects, whereas national champions double down on conventional refining, reflecting divergent regional trajectories for the diesel fuel market.
Diesel As Fuel Industry Leaders
Chevron Corporation
Exxon Mobil Corporation
Shell Plc
BP Plc.
Saudi Aramco
- *Disclaimer: Major Players sorted in no particular order
Diesel As Fuel Market Companies Covered in this Report
- Exxon Mobil
- Chevron
- Shell
- BP
- TotalEnergies
- Saudi Aramco
- Sinopec
- PetroChina
- Rosneft
- Lukoil
- ENI
- Petrobras
- Kuwait Petroleum
- QatarEnergy
- Indian Oil Corp
- Bharat Petroleum
- Reliance Industries
- Valero Energy
- Marathon Petroleum
- SK Energy

Market Opportunities and Future Outlook
A near-term opportunity set centers on supplying compliant low-sulfur distillates and blended diesel to end markets where electrification is not uniform, particularly heavy-duty freight, marine distillate demand tied to low-sulfur requirements, and stationary backup power for critical infrastructure. Procurement standards are also tightening. For example, large data-center operators are specifying ULSD with higher cetane requirements to reduce particulate emissions during generator testing, which supports demand for premium grades and additive-enabled performance differentiation.
Another concrete whitespace is the buildout of renewable and bio-based diesel supply and blending infrastructure alongside conventional diesel distribution. Chevron positioned itself as a major U.S. bio-based diesel producer in early 2026, and its Geismar renewable diesel facility reached about 22,000 barrels per day in 2026, illustrating how incumbents are expanding lower-carbon diesel alternatives within existing end-use demand. California is also expanding its lead in renewable and biodiesel production, which is creating a visible demand and offtake environment for producers, marketers, and terminal operators managing feedstock sourcing, blending, and specification compliance across petroleum diesel and diesel substitutes.
Recent Industry Developments in Diesel As Fuel Market
- July 2026: Saudi Aramco initiated preliminary discussions regarding the expansion of the East-West (Petroline) pipeline capacity by up to 2 million barrels per day to bypass the Strait of Hormuz. The proposal would increase international logistics capacity for refined products and support diesel and distillate shipments to global markets. It is also aimed at reducing transit risk and improving supply assurance for energy traders and downstream customers.
- June 2026: Shell Plc published a second quarter 2026 update reporting an indicative global refining margin of approximately $20 per barrel and refinery utilization near 100 percent. The figures point to strong diesel market margins and high throughput capacity, reinforcing refinery resilience. This, in turn, influences diesel supply expectations and price formation for components of the diesel value chain.
- April 2026: Exxon Mobil Corporation reported that Middle East disruptions and reduced crude availability at Asia Pacific operations lowered global Energy Products throughput by about 2% in Q1 2026 vs Q4 2025. The throughput impact highlights vulnerability in diesel supply chains and potential margin pressure across Asia-Pacific and global markets.


Diesel As Fuel Market Report Scope and Research Methodology
Market Definition and Coverage
This market tracks the value of diesel used as a fuel across major end uses, based on consumption volumes and typical selling prices, and then summed at the regional and global level. It covers fuel grades and blends used in transportation, marine, industrial and construction, agriculture, and power generation.
Scope exclusions: Non-fuel uses of middle distillates (for example, chemical feedstock use) are excluded from this sizing.
Segments Covered in This Report
- By Grade
- Ultra-Low Sulfur Diesel (Less than 15 ppm)
- Low-Sulfur Diesel (15 to 500 ppm)
- High-Sulfur Diesel (Over 500 ppm)
- Biodiesel Blends (B5 to B20)
- Synthetic Diesel
- By Application
- Transportation
- Marine
- Industrial and Construction
- Agriculture
- Power Generation
- By Geography
- North America
- United States
- Canada
- Mexico
- Europe
- Germany
- United Kingdom
- France
- Italy
- NORDIC Countries
- Russia
- Rest of Europe
- Asia-Pacific
- China
- India
- Japan
- South Korea
- ASEAN Countries
- Australia and New Zealand
- Rest of Asia-Pacific
- South America
- Brazil
- Argentina
- Colombia
- Rest of South America
- Middle East and Africa
- Saudi Arabia
- United Arab Emirates
- South Africa
- Egypt
- Rest of Middle East and Africa
- North America
Data Sources, Market Sizing, and Validation
Desk Research
Desk work starts with mapping the demand pool using public energy and transport statistics, then aligning those series to the fuel definitions used in the model. We lean on sources such as the International Energy Agency for energy balances, the US Energy Information Administration for distillate and diesel indicators, and Eurostat for regional fuel consumption and transport activity context.
To keep price and trade assumptions realistic, we also review public releases from OPEC and the World Bank for fuel price and macro indicators, and UN Comtrade for trade direction signals where relevant. Company annual reports, investor presentations, and reputable press are used to understand product mix moves such as ULSD upgrades and biodiesel blend adoption, with selective use of paid subscriptions for company financials, patent databases, and shipment-level import and export checks. The sources listed here are illustrative, and many other public documents were also referenced for data collection, cross-checks, and clarification.
Primary Interviews and Surveys
Primary work is used to stress-test consumption splits by end use, confirm how grades and blends are counted in practice, and sanity check price pass-through assumptions by region. We interviewed fuel distributors, refiners and blenders, logistics-linked buyers, and large fleet or industrial fuel procurement teams across APAC, EMEA, and the Americas, then ran follow-up calls when any desk signals looked inconsistent.
Distribution of primary research fieldwork respondents
| Company type | Respondent position | Region |
|---|---|---|
| Top tier: 29% | CXOs: 13% | APAC: 40% |
| Mid tier: 57% | Functional/Unit leaders: 42% | EMEA: 33% |
| Smaller Players: 14% | Managers: 45% | Americas: 27% |
Market-Sizing & Forecasting
The core build uses a top-down approach where energy consumption series and end-use activity indicators reconstruct the diesel demand pool, then that demand is priced using region-relevant average selling price ranges. Results are corroborated with selective bottom-up approximations, including sampled volume by channel, spot checks on blended fuel shares (B5 to B20 where applicable), and supplier and distributor roll-ups, so totals can be adjusted when the implied picture does not match market reality.
Key inputs used in the model include diesel consumption by sector (transportation, marine, industrial and construction, agriculture, and power generation), the mix shift toward ULSD versus other sulfur grades, the penetration of biodiesel blends, regional refining and supply tightness signals, and crude-linked fuel pricing movements that change the value even if volumes are flat. For forecasting, scenario analysis is applied around macro growth, freight and industrial activity, and policy-driven blending and sulfur standards, then a consensus pass from interviews is used so the final growth path remains practical. Where bottom-up visibility is patchy, gaps are handled through proxy splits anchored to official consumption shares and rechecked with expert input.
Data Validation & Update Cycle
Validation is done through stepwise checks that compare model totals against independent signals such as regional fuel consumption direction, trade flow changes, and price movements, then variances are investigated before sign-off. We also run internal review rounds where assumptions, unit conversions, and scope boundaries are rechecked so the final tables remain consistent across regions and end uses.
Reports are refreshed annually, and interim adjustments are triggered when material events occur, such as major demand shocks, regulatory changes affecting sulfur limits or blending, or sustained price regime shifts. Before delivery, a final analyst pass is completed to ensure the newest public data releases and interview learnings are reflected.
Mordor Intelligence's Diesel As Fuel Market Estimate Compared With Other Published Estimates
Published market sizes for diesel as a fuel rarely match exactly because each publisher draws the boundary differently, and then uses different ways to convert volumes into value. Differences also come from the base year picked, the treatment of blends and synthetic diesel, and how quickly assumptions are refreshed when prices move.
Import and export direction checks, regional diesel consumption signals, and grade mix indicators are used to keep Mordor Intelligence's estimate tied to end-use fuel demand rather than retail-only turnover or a broader petroleum bucket. When those validation points are applied consistently, the largest gaps usually trace back to whether a figure includes retail margins and distribution services, whether it counts a wider set of distillates beyond diesel, and whether currency timing and average price logic are updated in line with the stated base year.
Benchmark comparison
| Source | Market Size | Gaps in Research Methodology |
|---|---|---|
| Mordor Intelligence | USD 253.29 B (2025) | |
| Trade Journal B | USD 226.70 B (2024) | Uses a different base year and appears closer to a broader diesel headline value without the same grade and end-use normalization, which can shift the implied average price and the counted demand pool. |
| Regional Consultancy A | USD 274.40 B (2025) | Retail-focused framing can pull in channel markups and service-related turnover, and it may also count a wider set of retail-grade diesel and distribution channels than an end-use consumption model. |
The spread across sources is mainly explained by boundary choices around retail turnover versus consumption value, plus how blends, grades, and pricing averages are handled by year. With clear demand signals and repeatable steps, users can trace the number back to consumption, mix, and price inputs, then adjust assumptions if they need a narrower or wider view.


Key Questions Answered in the Report
How large is the diesel fuel market in 2026?
The diesel fuel market size stands at USD 263.19 billion in 2026, progressing toward USD 310 billion by 2031.
Which segment of diesel demand is growing fastest?
Marine bunker fuel leads growth with a projected 5.2% CAGR on the back of revived container shipping and low-sulfur regulations.
What share of global consumption comes from Asia-Pacific?
Asia-Pacific accounts for about 42% of worldwide diesel use and is expanding at a 3.9% CAGR.
How are refiners addressing carbon regulations?
Integrated majors are co-processing renewable feedstocks to produce ULSD and biodiesel blends that satisfy tightening carbon-intensity rules.
Will electric trucks significantly curb diesel demand by 2031?
Long-haul electrification remains constrained by battery weight and charging times, so diesel is expected to retain dominance in heavy-duty trucking through at least the mid-2030s.
Page last updated on:


 Your data is secure and never sold or shared.


