
Discrete Semiconductor Market Size and Share
Market Overview
| Study Period | 2020 - 2031 |
|---|---|
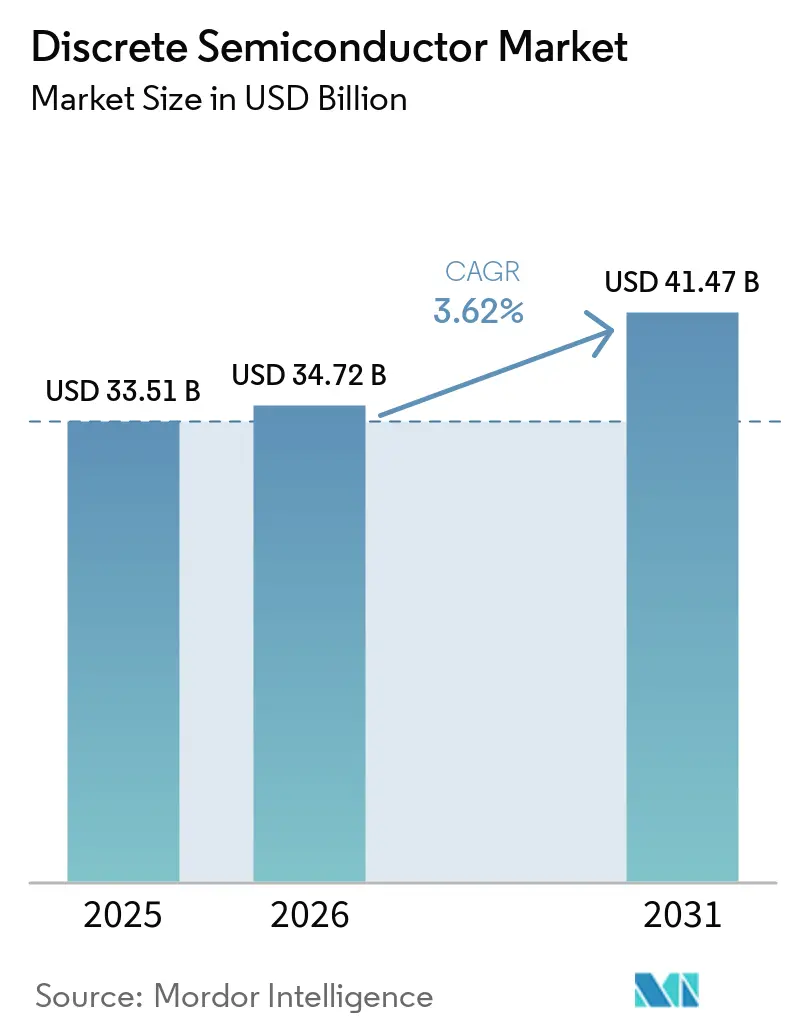
| Market Size (2026) | USD 34.72 Billion |
| Market Size (2031) | USD 41.47 Billion |
| Growth Rate (2026 - 2031) | 3.62 % |
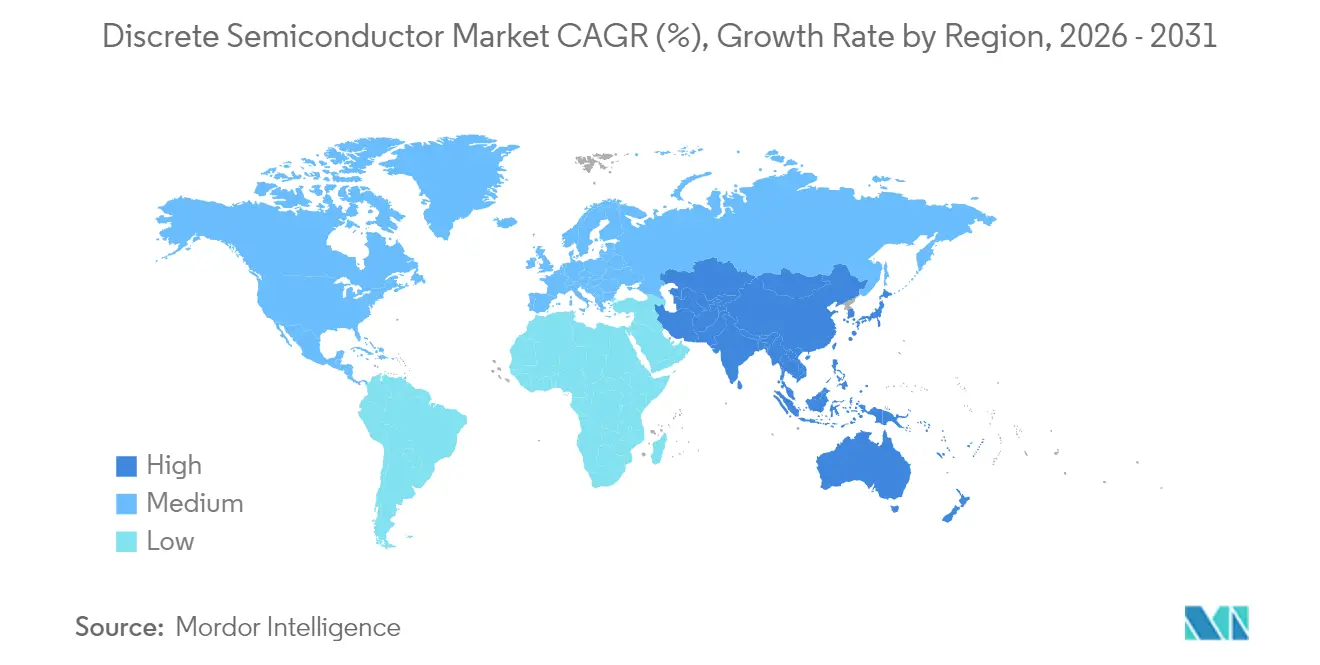
| Fastest Growing Market | Asia Pacific |
| Largest Market | Asia Pacific |
| Market Concentration | Medium |
Major Players *Disclaimer: Major Players sorted in no particular order Image © Mordor Intelligence. Reuse requires attribution under CC BY 4.0. | |
Discrete Semiconductor Market Analysis by Mordor Intelligence
discrete semiconductor market size in 2026 is estimated at USD 34.72 billion, growing from 2025 value of USD 33.51 billion with 2031 projections showing USD 41.47 billion, growing at 3.62% CAGR over 2026-2031. The headline numbers mask a structural pivot toward wide-bandgap materials, packaging breakthroughs, and regionalized supply chains that collectively redefine performance, cost, and resilience. Silicon remains the workhorse, yet silicon-carbide and gallium-nitride devices accelerate wherever high-voltage efficiency or radio-frequency power density matter most. Automotive electrification, renewable-energy inverters, and 5G base-station roll-outs form the triad of demand that shields the discrete semiconductor market from broader semiconductor down-cycles. Meanwhile, advanced copper-clip and top-side-cooling packages deliver up to 70% lower thermal resistance than conventional wire-bonded formats, opening higher power densities without sacrificing reliability.[1]Source: Nexperia, “How Copper Clip Makes Perfect Packages for the Future of Power,” nexperia.com Competitive strategies revolve around securing wide-bandgap substrate capacity, co-developing application-specific modules, and forging long-term supply agreements with electric-vehicle and infrastructure OEMs.
Key Report Takeaways
- By geography, Asia-Pacific held 43.05% of the discrete semiconductor market share in 2025, while the region’s value pool is expanding at a 5.23% CAGR through 2031.
- By end-user vertical, automotive applications commanded 25.55% of the discrete semiconductor market size in 2025 and are forecast to grow at a 4.86% CAGR to 2031.
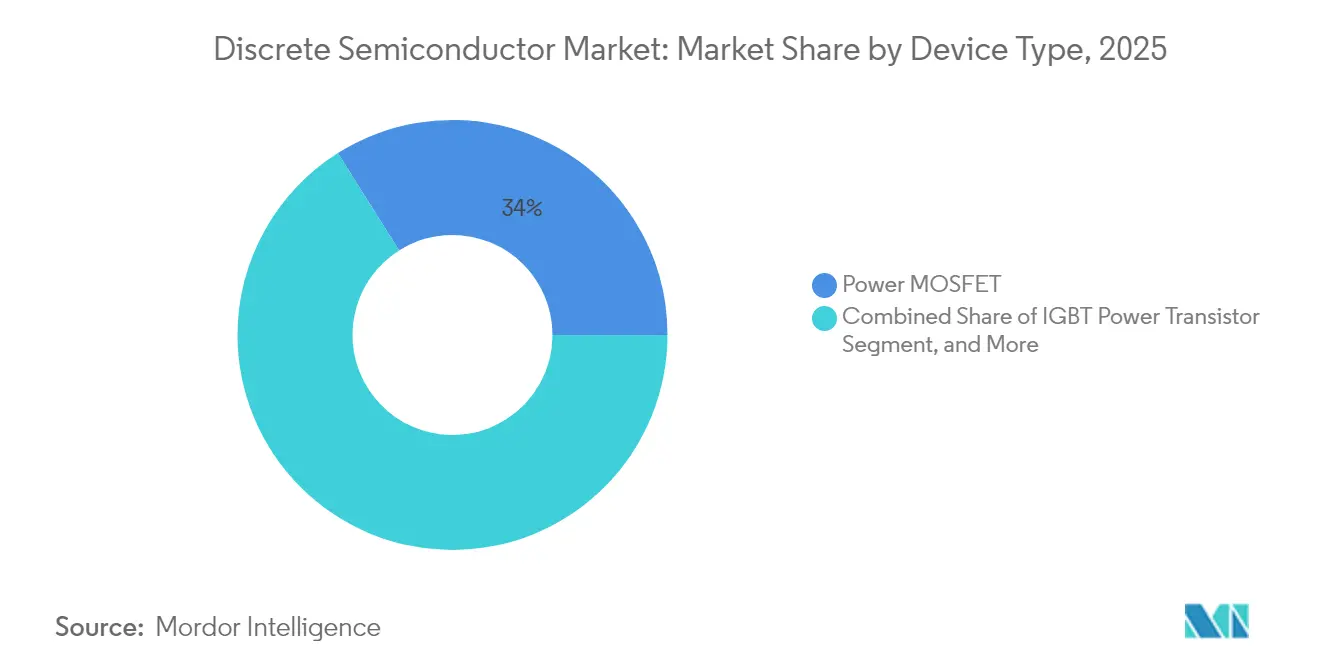
- By device type, power MOSFETs accounted for a 33.95% share of the discrete semiconductor market size in 2025; MOSFET power transistors also represent the fastest-growing device class at 5.36% CAGR.
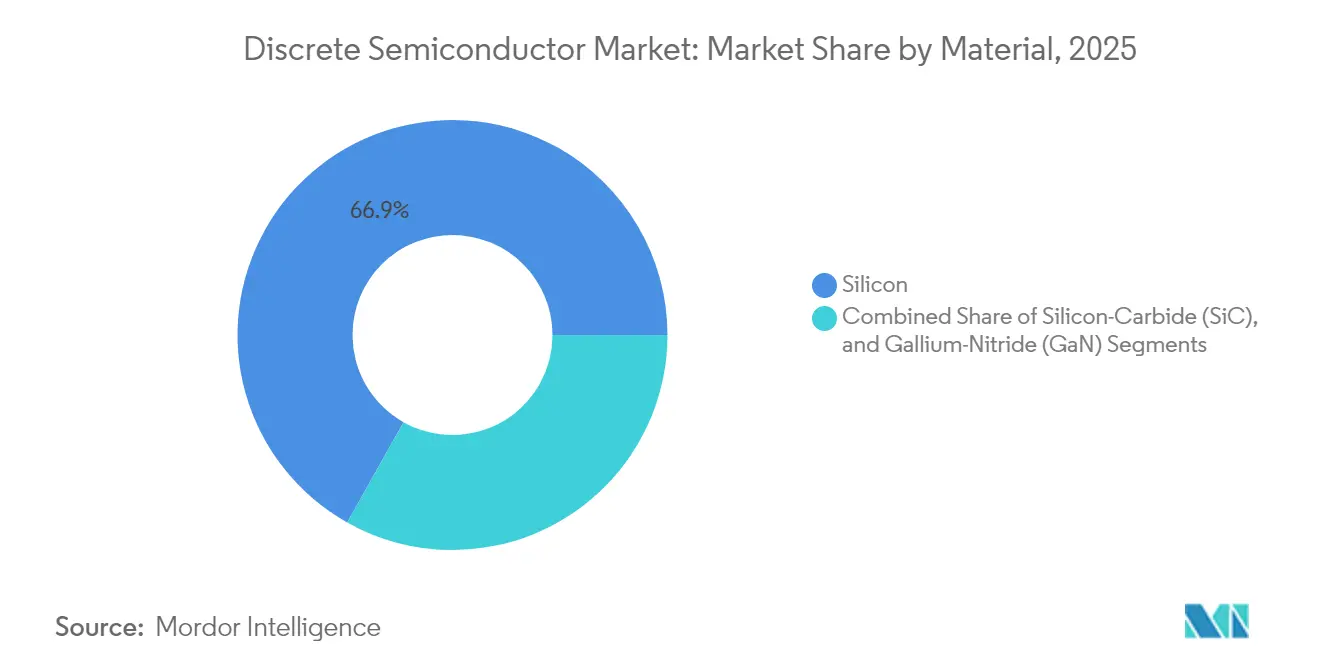
- By material, silicon retained a 66.85% share in 2025, whereas silicon-carbide devices are projected to rise at a 4.63% CAGR, the highest within the segment.
- By power rating, mid-power devices (20–600 V) captured 43.65% share in 2025, while high-power devices (>600 V) registered the strongest growth trajectory at 4.54% CAGR.
Note: Market size and forecast figures in this report are generated using Mordor Intelligence’s proprietary estimation framework, updated with the latest available data and insights as of 2026.
Market Trends and Insights
Drivers Impact Analysis of Discrete Semiconductor Market*
| DRIVER | (~) % IMPACT ON CAGR FORECAST | GEOGRAPHIC RELEVANCE | IMPACT TIMELINE |
|---|---|---|---|
| Automotive electrification wave | +1.2% | Global, with Asia-Pacific and Europe leading | Medium term (2-4 years) |
| Renewable-energy inverters demand | +0.8% | Global, concentrated in China, Europe, and North America | Long term (≥ 4 years) |
| 5G radio PA module proliferation | +0.6% | Asia-Pacific core, spill-over to North America and Europe | Short term (≤ 2 years) |
| SiC device cost curve crossing IGBT | +0.9% | Global, with China driving cost reductions | Medium term (2-4 years) |
| Regionalization of power-module supply chains | +0.5% | North America, Europe, select Asia-Pacific markets | Long term (≥ 4 years) |
| Adoption of advanced copper-clip packages | +0.4% | Global, led by Asian manufacturers | Medium term (2-4 years) |
| Source: Mordor Intelligence | |||


Automotive Electrification Wave
Battery-electric and plug-in hybrid vehicles embed 3–5 times more power discretes than internal-combustion models, lifting content per car and insulating the discrete semiconductor market from consumer-electronics cyclicality. High-voltage 800 V drivetrains rely on fast-switching MOSFETs and SiC diodes that cut inverter losses and enable lighter wiring looms. Long-term sourcing agreements between automakers and foundry partners ensure supply continuity for AEC-Q101-qualified devices. Vertical acquisitions by motor and actuator suppliers underpin tighter control over driver ICs, gate modules, and thermal interfaces. As charging infrastructure migrates to 350 kW rates, vehicle onboard chargers shift toward higher-frequency topologies that favor wide-bandgap discretes for efficiency and board-space savings. Certification cycles and zero-defect expectations raise entry barriers, keeping quality-focused vendors in a favorable position.
SiC Device Cost Curve Crossing IGBT
Cost reductions from 150 mm to 200 mm SiC wafer transition, substrate-thinning, and higher epitaxial yields lower USD/cm² and move SiC MOSFETs toward parity with trench IGBTs in 600–1,200 V classes. Research programs such as Fraunhofer IISB’s ThinSiCPower demonstrate 25% device-level cost cuts through engineered substrates and backside cooling.[2]Source: Fraunhofer IISB, “Thin Chips and Robust Substrates – Key Technologies for Cost-Efficient Silicon Carbide Power Electronics,” fraunhofer.de Chinese substrate houses have pushed 6-inch SiC wafer pricing below USD 400, a 30% drop versus early 2024. The falling cost curve broadens the total addressable market across photovoltaic inverters, industrial drives, and data-center power shelves. Device vendors are integrating gate-driver ASICs and temperature sensors into half-bridge modules, enabling system designers to shorten qualification timelines and accelerate time-to-market.
5G Radio PA Module Proliferation
Sub-6 GHz and millimeter-wave 5G base stations require discrete RF power amplifiers capable of high back-off efficiency and ruggedness under VSWR mismatch. GaN-on-silicon technology, produced on 8-inch lines, slashes cost compared with GaN-on-SiC while maintaining sufficient thermal conductivity for mid-power micro-cell deployments. Telecom OEM reference designs increasingly adopt dual-path architectures that pair discrete GaN HEMTs with integrated digital predistortion controllers to maximize spectral efficiency. The densification of small-cell networks, especially in dense urban corridors across China, Japan, and South Korea, keeps demand elevated even as macro base-station deployments plateau. Equipment harmonization across global 3GPP bands underpins consistent volume for 28 V and 50 V GaN discrete transistors.
Renewable-Energy Inverters Demand
Global additions of solar and wind capacity expand the installed base of string and central inverters that call for high-voltage discretes. Toshiba’s 2,200 V SiC MOSFETs enable simpler two-level topologies, cutting parts count and boosting inverter efficiency by up to 2 percentage points.[3]Source: Toshiba Electronic Devices & Storage Corp., “Toshiba’s Newly Developed 2200 V SiC MOSFETs Deliver Low Power Loss,” toshiba.com Rapid growth of 1,500 VDC utility-scale arrays elevates voltage stress on switching devices; discrete SiC diodes offer half the reverse-recovery charge of silicon rivals, easing electromagnetic-interference filtering. Battery-energy-storage systems add bidirectional power-conditioning paths, doubling the discrete semiconductor attach rate per megawatt. Government feed-in-tariff reforms in Europe and decarbonization mandates in the United States sustain multi-year procurement visibility for high-power modules.
Restraints Impact Analysis of Discrete Semiconductor Market*
| RESTRAINTS | (~) % IMPACT ON CAGR FORECAST | GEOGRAPHIC RELEVANCE | IMPACT TIMELINE |
|---|---|---|---|
| IC-level integration cannibalizing discretes | -0.7% | Global, led by advanced semiconductor regions | Long term (≥ 4 years) |
| Cyclical cap-ex over-supply risk | -0.9% | Global, with Asia-Pacific most exposed | Short term (≤ 2 years) |
| Thermal-runaway reliability concerns in SiC diodes | -0.3% | Global, concentrated in automotive and industrial segments | Medium term (2-4 years) |
| Tight EU eco-design rules on standby losses | -0.2% | Europe, with spill-over to global OEM compliance | Medium term (2-4 years) |
| Source: Mordor Intelligence | |||
IC-Level Integration Cannibalising Discretes
Power-management ICs now embed low-voltage MOSFETs, current-sense shunts, and protection circuitry, shrinking the bill of materials in smartphones and laptops. Chiplet architectures extend this trend to server motherboards, letting designers integrate gallium-nitride driver die alongside logic clusters within a single package. For low-power consumer products, the value line migrates from stand-alone discretes toward monolithic regulators, tempering volume growth. Yet high-power zones maintain discrete relevance. Physical separation of high-voltage switches from control silicon safeguards thermal margins and electromagnetic compliance. Consequently, the cannibalization effect is asymmetric: it constrains sub-60 V low-current discretes but has limited reach into traction inverters or grid-tie converters that operate above 650 V.
Cyclical Cap-Ex Over-Supply Risk
Industry-wide front-end capacity expanded 6% in 2024 and is set to add a further 7% through 2025 as foundries and IDMs pursue geopolitical diversification. Mature-node fabs ideal for discretes represent roughly one-third of the total, raising the possibility of a temporary supply-demand imbalance if macro conditions soften. Asia-Pacific accounts for almost 30% of wafer-fabrication-equipment outlays; any domestic policy shift or export-control tightening could trigger inventory corrections. While buffer stocks help automakers and inverter OEMs avert shortages, a prolonged surplus would compress average selling prices and deter investment in next-generation power platforms. Careful synchronization of tooling purchases, along with selective outsourcing, mitigates downside but cannot fully insulate vendors from cycle swings.
*Our forecasts treat driver/restraint impacts as directional, not additive. The impact forecasts reflect baseline growth, mix effects, and variable interactions.
Discrete Semiconductor Market Segment Analysis
By Device Type:
Power MOSFETs Drive Market EvolutionPower MOSFETs held a 33.95% share of the discrete semiconductor market size in 2025 and are growing at a 5.36% CAGR as electrified transport, data-center power shelves, and renewable inverters demand fast-switching, low-loss topologies. The discrete semiconductor market benefits from trench-gate architectures that combine lower RDS(on) with avalanche ruggedness, enabling compact DC-DC converters in 48 V server backplanes. Copper-clip and top-side-cooling packages lower thermal resistance by as much as 20 K/W versus bond-wire designs, lengthening lifetime under repetitive current spikes. Schottky diodes and ultrafast rectifiers remain workhorse solutions in PFC stages, though their share grows modestly as integration packs multiple checkpoints inside SiC half-bridges.
Demand for small-signal transistors stabilizes around consumer IoT applications where cost and board density trump raw efficiency. Thyristor volumes fall in lighting ballasts yet sustain grid-side roles, particularly static switches and crowbar protection. The discrete semiconductor market continues to bifurcate between commodity low-voltage parts and performance-critical high-current switches that command price premiums. IDMs diversify by pairing MOSFET lead frames with integrated gate drivers and current-sense amplifiers, shortening design cycles for vehicle traction and industrial servo drives.


By End-User Vertical:
Automotive Leads Electrification ChargeAutomotive applications accounted for 25.55% of the discrete semiconductor market share in 2025, outpacing all other verticals with a 4.86% CAGR through 2031. Battery-electric propulsion multiplies the count of power switches in traction inverters, on-board chargers, and auxiliary pumps, supporting persistent unit growth in automotive discrete semiconductors even as global light-vehicle sales fluctuate. ADAS domains, from LiDAR to high-definition radar, integrate discrete GaN amplifiers to extend detection range, feeding incremental content growth. The discrete semiconductor market also benefits from stringent functional-safety regulations that favor discrete component isolation over SOC integration in chassis control.
Consumer electronics retain second-place volume but sit at low-single-digit growth because highly integrated PMICs cannibalize discrete sockets, limiting growth in consumer discrete semiconductors. Communication-infrastructure expenditure reinforces demand for high-voltage rectifiers and GaN RF transistors in 5G remote radio heads, supporting growth across the IT & telecom discrete semiconductor segment. Industrial automation remains a steady adopter of IGBTs and SiC diodes for variable-frequency drives and uninterruptible power supply systems.
By Material:
Silicon Carbide Disrupts Traditional DominanceSilicon maintained a 66.85% share in 2025, yet silicon-carbide devices are advancing at a 4.63% CAGR, the fastest among materials. Cost-down roadmaps, substrate scaling, epitaxial uniformity, and higher wafer utilization enable SiC to penetrate 800 V battery packs, solar string inverters, and next-gen railway traction. Manufacturers leverage 200 mm SiC pilot lines to unlock economies of scale while sustaining crystalline quality. The discrete semiconductor market balances SiC’s superior breakdown voltage and thermal conductivity against silicon’s unbeatable cost in low-voltage consumer products. Gallium-nitride remains a niche RF and fast-charger solution but garners interest for 3 kW server power supplies, where 240 W/in³ density targets demand ultra-fast switching.
Silicon’s dominance persists in logic-level MOSFETs, bipolar transistors, and Zener families, all routinely fabbed on depreciated 150 mm lines. Nevertheless, mixed-material module designs now pair SiC MOSFETs with silicon diodes to optimize cost while approaching all-wide-bandgap efficiency. Wide-bandgap maturity accelerates a shift in supplier power dynamics, rewarding firms with captive substrate capacity and long-term epitaxy partnerships.
By Power Rating:
High-Power Applications Accelerate GrowthMid-power discretes (20–600 V) held a 43.65% share in 2025, servicing DC-DC regulators, motor drivers, and telecom rectifiers. High-power classes above 600 V, though smaller in absolute terms, represent the fastest-growing slice at 4.54% CAGR, propelled by renewable-energy inverters, EV traction, and medium-voltage drives. To manage dissipated heat, vendors deploy double-sided jet-impingement or immersion-cooling modules that cut junction-to-fluid resistance by up to 50%. EU Ecodesign Regulation 2019/1781 mandates higher motor-drive efficiency, fueling replacements of legacy thyristors with SiC-based half bridges.
Low-power devices below 20 V remain commoditized; integration onto PMIC die continues, slowing unit growth. Conversely, >1.2 kV SiC MOSFETs and 3.3 kV modules open new addressable markets in solid-state transformers and grid-interface STATCOM systems. The discrete semiconductor market, therefore, is segments by voltage class in tandem with end-equipment electrification curves.
Geography Analysis
APAC Discrete Semiconductor Market
Asia-Pacific dominated the discrete semiconductor market in 2025 with a 43.05% share and remains the fastest-growing region at a 5.23% CAGR through 2031. State-backed foundry incentives in China and Japan’s stewardship in materials and packaging underpin sustained investment. Asian OSATs scale copper-clip and molded SiC modules that cater to domestic EV and power-supply OEM pipelines. Government carbon-neutrality roadmaps channel public funding toward advanced inverter and charger programs, keeping local demand robust.
North America and Malaysia Discrete Semiconductor Market
North America leverages the USD 52 billion CHIPS and Science Act to reshore mature-node and wide-bandgap lines, yet cost structures remain about 35% higher than Asian fabs. Consequently, discrete semiconductor vendors adopt a “twin-fab” strategy, splitting critical-application output between U.S. and Malaysian sites to balance geopolitics and economics. Automotive Tier-1 and defense electronics suppliers in the United States value domestic sourcing for ITAR and cybersecurity compliance, giving regional fabs a protected niche.
Europe Discrete Semiconductor Market
Europe targets a 20% global semiconductor capacity share by 2030 through the EU Chips Act, emphasizing energy-efficient power devices for green-deal priorities. Local IDMs capitalize on automotive customer proximity and grid modernization initiatives that favor SiC-enabled high-efficiency converters.
MEA and South America Discrete Semiconductor Market
Meanwhile, the Middle East and Africa, plus South America, together represent a single-digit percentage of the discrete semiconductor market, yet infrastructure roll-outs and renewable adoption generate high-growth micro-clusters that global players address through distributor networks and design-in support hubs.
Mordor Intelligence provides coverage of the discrete semiconductor market across other key regional markets, including Europe, each with their regulatory frameworks and demand patterns. Detailed country-level analysis extends to Taiwan, United States, Japan, South Korea, and China incorporating local coverage and market participation, as required.

Regulatory Landscape
The discrete semiconductor market is increasingly shaped by industrial-policy and procurement rules that link device sourcing to national-security and resiliency goals. In the United States, a January 2026 Presidential Proclamation under Section 232 of the Trade Expansion Act imposed a 25% ad valorem duty on specific imported semiconductors and derivative products, which increases landed costs for a portion of globally traded discrete devices and modules and pushes both suppliers and customers toward tariff engineering and alternative sourcing.
On the demand side, government purchasing requirements are tightening supply-chain scrutiny. In February 2026, the FAR Council proposed a rule to implement Section 5949 of the James M. Inhofe NDAA for FY 2023 that would prohibit executive agencies from procuring certain covered semiconductor products or services, which raises the need for federal contractors to map bills of materials and validate upstream provenance. In Europe, the proposed Chips for Europe Initiative 2.0 (Chips Act 2.0) keeps focus on strengthening regional design and production capacity, reinforcing localization programs that can affect where mature-node and power-device capacity is added and qualified.
Value Chain Analysis
The discrete semiconductor value chain begins with raw and engineered materials (silicon wafers, SiC substrates and epitaxy, GaN epi platforms), specialty gases and chemicals, and package inputs such as leadframes, bonding or sintering consumables, and thermal interface materials. Device fabrication is carried out by IDMs and foundries on mature-node lines for silicon discretes and on more specialized platforms for wide-bandgap devices, followed by backend assembly and test through captive operations and OSATs that supply copper-clip, top-side-cooling, molded modules, and other thermally optimized packages. Distribution then runs through global and regional authorized distributors and direct OEM supply agreements, while automotive qualification (for example, AEC-Q101 use cases referenced in the report context) increases documentation, traceability, and change-control across multiple tiers.
Resilience and regionalization are becoming explicit value-chain design parameters, with government programs and large-scale capacity projects influencing node and geography choices. A notable anchor is Infineon Technologies opening its Smart Power Fab in Dresden in July 2026 as a EUR 5 billion investment to scale power semiconductors and analog or mixed-signal output. In parallel, the U.S. government has highlighted reliance on the PRC for portions of analog and discrete manufacturing, which intensifies dual-sourcing and localization efforts. Together, these shifts increase pressure on substrate and packaging bottlenecks (SiC wafer availability and advanced power packaging throughput) and raise the role of long-term supply agreements and co-development programs between device vendors, module houses, and automotive, industrial, and infrastructure OEMs.
Competitive Landscape
The discrete semiconductor market exhibits moderate fragmentation. Broad-base players such as Infineon, ON Semiconductor, and STMicroelectronics anchor silicon portfolios while ramping SiC capacity through internal crystal growth or external substrate partnerships. Wolfspeed and ROHM differentiate on vertically integrated SiC value chains, selling bare die, discrete packages, and full-bridge modules aligned with traction-inverter timelines. Qorvo and MACOM lead GaN RF domains focused on 5G and aerospace, whereas newcomers leverage 8-inch GaN-on-Si pilot lines to chase cost-sensitive infrastructure contracts.
Strategic activity centers on securing advanced packaging intellectual property. Applied Materials’ minority investment in BE Semiconductor targets hybrid bonding pipelines that merge logic, memory, and power die within thermally optimized stacks. MinebeaMitsumi’s acquisition of Hitachi Power Semiconductor Device deepens vertical integration from ball bearings to power electronics, aiming for USD 2 billion sales by 2030. Supply-chain regionalization leads to co-investment JVs between automakers and device vendors, locking in substrate allocations and mitigating shipping-route risk.
Technology roadmaps emphasize thermal-management innovation: top-side-cooling MOSFET packages slash PCB copper beneath hot spots, while sintered-silver die attach extends life under mission-profile power cycling. Vendors also pair discrete MOSFETs with digital twin simulation platforms, letting customers optimize thermal stacks before the first engineering samples ship.
Discrete Semiconductor Industry Leaders
Infineon Technologies AG
ON Semiconductor Corporation
Vishay Intertechnology Inc.
STMicroelectronics N.V.
Nexperia B.V.
- *Disclaimer: Major Players sorted in no particular order

Discrete Semiconductor Market Companies Covered in this Report
- Infineon Technologies AG
- ON Semiconductor Corporation
- Vishay Intertechnology Inc.
- STMicroelectronics N.V.
- Nexperia B.V.
- Rohm Co., Ltd.
- Diodes Incorporated
- Mitsubishi Electric Corporation
- Fuji Electric Co., Ltd.
- Littelfuse Inc.
- Texas Instruments Incorporated
- Toshiba Electronic Devices & Storage Corporation
- ABB Ltd.
- Hitachi Energy Ltd.
- Eaton Corporation plc
- NXP Semiconductors N.V.
- Semikron Danfoss GmbH & Co. KG
- Renesas Electronics Corporation
- Microchip Technology Inc.
- Wolfspeed Inc.
- Qorvo Inc.
- WeEn Semiconductors Co., Ltd.
- Analog Devices Inc.
- Power Integrations Inc.
- Skyworks Solutions Inc.
- Alpha & Omega Semiconductor Ltd.

Market Opportunities and Future Outlook
A key opportunity area is emerging where wide-bandgap adoption intersects with packaging-driven power density. System makers are redesigning traction inverters, fast chargers, renewable-energy inverters, and data-center power shelves around thermal performance and switching efficiency, and the report context points to copper-clip and top-side-cooling formats that reduce thermal resistance. Vendors are translating those packaging advantages into differentiated, application-specific discrete and module roadmaps that bundle power switches with sensing and protection elements at the package level.
Capacity investments also create room for localized sourcing and faster qualification loops in regulated or mission-critical supply chains. The report context cites Infineon Technologies Smart Power Fab in Dresden (opened July 2026) and Tower Semiconductor’s July 2026 plan for a Japan expansion supported by the government, including advanced packaging alongside 300 mm specialty platforms. Procurement rules and trade actions further support multi-region sourcing strategies and compliant product lines aimed at government and defense-adjacent demand, including the January 2026 U.S. Section 232 tariff action and the February 2026 proposed FAR restrictions on covered semiconductor products. On the technology side, momentum during 2026 around 700 V class GaN power devices (for AI servers and robotics use cases) and continued SiC-focused programs for high-voltage efficiency supports a mixed-portfolio direction, where silicon remains cost-effective for high-volume segments while SiC and GaN capture sockets defined by high voltage, high frequency, and thermal constraints.
Recent Industry Developments in Discrete Semiconductor Market
- July 2026: Infineon Technologies opened its Smart Power Fab in Dresden, Germany, a EUR 5 billion investment aimed at scaling production of power semiconductors and analog/mixed-signal devices. The added European capacity supports regionalized supply strategies for automotive and industrial customers while expanding output for high-current discrete devices and related packaging flows.
- June 2026: Vishay Intertechnology released new Gen 7 1200 V FRED Pt hyperfast rectifiers in the SMPC HV package, extending its high-voltage discrete portfolio for power-conversion applications. The introduction reinforces competitive pressure in rectifiers used across industrial drives and energy infrastructure where switching losses and thermal management drive design choices.
- December 2024: SCHOTT completed the acquisition of quartz specialist QSIL GmbH to strengthen access to high-purity materials used in semiconductor manufacturing supply chains. Greater control over critical input materials supports substrate and process stability for power-device production ecosystems that depend on consistent purity and yield.


Discrete Semiconductor Market Report Scope and Research Methodology
Market Definition and Coverage
For this study, the market is defined as revenue earned from selling discrete semiconductor devices that perform a single switching or rectifying function in electronic circuits, across major end-use industries and regions.
Scope exclusions: We do not count integrated circuits or optoelectronic devices unless they are explicitly sold and classified as discrete components in reported revenues.
Segments Covered in This Report
- By Device Type
- Diode
- Small-Signal Transistor
- Power Transistor
- MOSFET Power Transistor
- IGBT Power Transistor
- Other Power Transistor
- Rectifier
- Thyristor
- By End-user Vertical
- Automotive
- Consumer Electronics
- Communication Infrastructure
- Industrial
- Other End-user Verticals
- By Material
- Silicon
- Silicon-Carbide (SiC)
- Gallium-Nitride (GaN)
- By Power Rating
- Low-power (< 20 V)
- Mid-power (20 – 600 V)
- High-power (> 600 V)
- By Geography
- North America
- United States
- Canada
- Mexico
- South America
- Brazil
- Argentina
- Rest of South America
- Europe
- Germany
- United Kingdom
- France
- Russia
- Rest of Europe
- Asia-Pacific
- China
- Japan
- India
- South Korea
- South-East Asia
- Rest of Asia-Pacific
- Middle East and Africa
- Middle East
- Saudi Arabia
- United Arab Emirates
- Rest of Middle East
- Africa
- South Africa
- Egypt
- Rest of Africa
- Middle East
- North America
Data Sources, Market Sizing, and Validation
Desk Research
Desk research starts with building a clean view of the discrete device value chain and the main demand pools that repeatedly consume these parts. We reviewed public sources such as the World Semiconductor Trade Statistics (WSTS) releases, USITC trade statistics, UN Comtrade, IEEE and other peer-reviewed journals, and patent databases to understand technology shifts such as the move from silicon toward SiC and GaN.
On the supply and pricing side, we also used company annual reports and investor presentations, industry association websites, and reputable press coverage to track capacity additions, lead-time patterns, and major end-market cycles. Where needed, paid database subscriptions were used for company financial intelligence, news and financials screening, and semiconductor value chain mapping, so that revenue splits and exposure assumptions could be cross-checked. The desk sources listed above are illustrative, and we also used other public references to collect, validate, and clarify data points.
Primary Interviews and Surveys
Primary work focused on validating what drives revenue in discrete devices, which usually comes down to unit volumes, device mix, and average selling price movement by voltage class and material. We spoke with a balanced set of respondents across manufacturing, distribution, and demand-side functions so that assumptions on mid-power versus high-power usage, EV and industrial inverter demand, and wide-bandgap adoption could be checked across regions, then reconciled back to the model.
Distribution of primary research fieldwork respondents
| Company type | Respondent position | Region |
|---|---|---|
| Top tier: 26% | CXOs: 13% | APAC: 48% |
| Mid tier: 57% | Functional/Unit leaders: 36% | EMEA: 34% |
| Smaller Players: 17% | Managers: 51% | Americas: 18% |
Market-Sizing & Forecasting
Sizing was built with a top-down structure where semiconductor revenue pools are reconstructed by mapping discrete device shipments and consumption signals to end markets, and then translated into value using mix-weighted pricing. To keep the totals realistic, we used selective bottom-up approximations as checks, such as sampling device-level ASPs across key voltage bands and multiplying by volume proxies in automotive, industrial power, and consumer electronics.
Inputs were chosen to reflect how this market behaves in practice. These included the share shift between silicon and wide-bandgap (SiC and GaN), the split of demand across low-power, mid-power (20-600 V), and high-power (greater than 600 V) devices, and the product mix across diodes, small-signal transistors, rectifiers, and power transistors. We also tracked end-market indicators such as EV and charging build-out, renewable inverter installations, and communication infrastructure capex, and then translated those indicators into discrete device intensity using interview-led assumptions.
Forecasting was done using scenario analysis, since discrete demand can swing when automotive and industrial cycles change quickly, and pricing can normalize after supply tightness. The base case uses consensus ranges gathered in primary discussions for adoption of SiC and GaN, voltage-class mix, and expected ASP progression. Where a bottom-up check lacked visibility for smaller channels, gaps were handled by applying conservative shares derived from public trade flows and distributor commentary, followed by a final reconciliation back to the main model.
Data Validation & Update Cycle
Validation is handled in steps so that unusual outputs get caught early. We compare model results against independent signals such as regional semiconductor shipment trends, import and export movements for key device categories, and end-market production indicators, and then investigate any large variance before final sign-off.
A second analyst review is used to pressure-test key assumptions like material shifts, voltage-class mix, and pricing movement, so the story matches the numbers. Reports are refreshed annually, with interim updates triggered when material events occur, such as major capacity changes, sharp pricing resets, or policy-led demand swings. Before delivery, a last pass is completed to ensure the current view reflects the latest public releases and validated interview inputs.
Mordor Intelligence's Discrete Semiconductor Market Size Versus Other Published Estimates
Published market sizes for discrete semiconductors often do not match because the scope around device types, the pricing logic behind ASPs, and the timing of currency conversion are not kept consistent across sources. Differences also come from how much of the channel is assumed to be captured, and whether the estimate is tied to end-use consumption signals or mainly to broad electronics growth.
The main gap comes from whether modules and adjacent component buckets are rolled into the discrete total, and how wide-bandgap ramp assumptions are applied to revenue in the current year. For Mordor Intelligence, the value is built from device-type and power-rating mix, with wide-bandgap counted within discrete only when it is sold as a discrete device revenue line, and the result is then checked against APAC share signals and end-market demand drivers.
Benchmark comparison
| Source | Market Size | Gaps in Research Methodology |
|---|---|---|
| Mordor Intelligence | USD 33.51 B (2025) | |
| Industry Publisher A | USD 31.30 B (2025) | Uses a narrower revenue basket that can undercount portions of the discrete power mix when device revenues are grouped under broader transistor and diode families, and it may apply different timing for ASP updates during material shifts like SiC and GaN. |
| Business Data Publisher B | USD 43.84 B (2025) | Uses a wider market definition that can pull in adjacent component buckets and related discrete categories, which can lift totals when boundaries between discrete devices and broader semiconductor components are not separated consistently across end markets. |
The comparison shows that most of the spread is explained by scope choices first, and then by how pricing and mix are refreshed for fast-changing power device demand. By keeping device categories, voltage bands, and material adoption tied to repeatable public signals and interview-checked assumptions, we end up with a practical number that can be re-created and stress-tested when conditions change.


Key Questions Answered in the Report
What is the current value of the discrete semiconductor market?
The discrete semiconductor market size stands at USD 34.72 billion in 2026.
How fast is the discrete semiconductor market expected to grow?
Market value is projected to reach USD 41.47 billion by 2031, reflecting a 3.62% CAGR.
Which region leads in discrete semiconductor demand?
Asia-Pacific holds 43.05% of global revenue and is expanding at a 5.23% CAGR.
Why are silicon-carbide devices gaining traction?
Cost reductions, superior high-voltage efficiency, and thermal performance make SiC the fastest-growing material at a 4.63% CAGR.
Page last updated on:


 Your data is secure and never sold or shared.


