Net-Zero Strategy Software Market Size and Share
Market Overview
| Study Period | 2020 - 2031 |
|---|---|
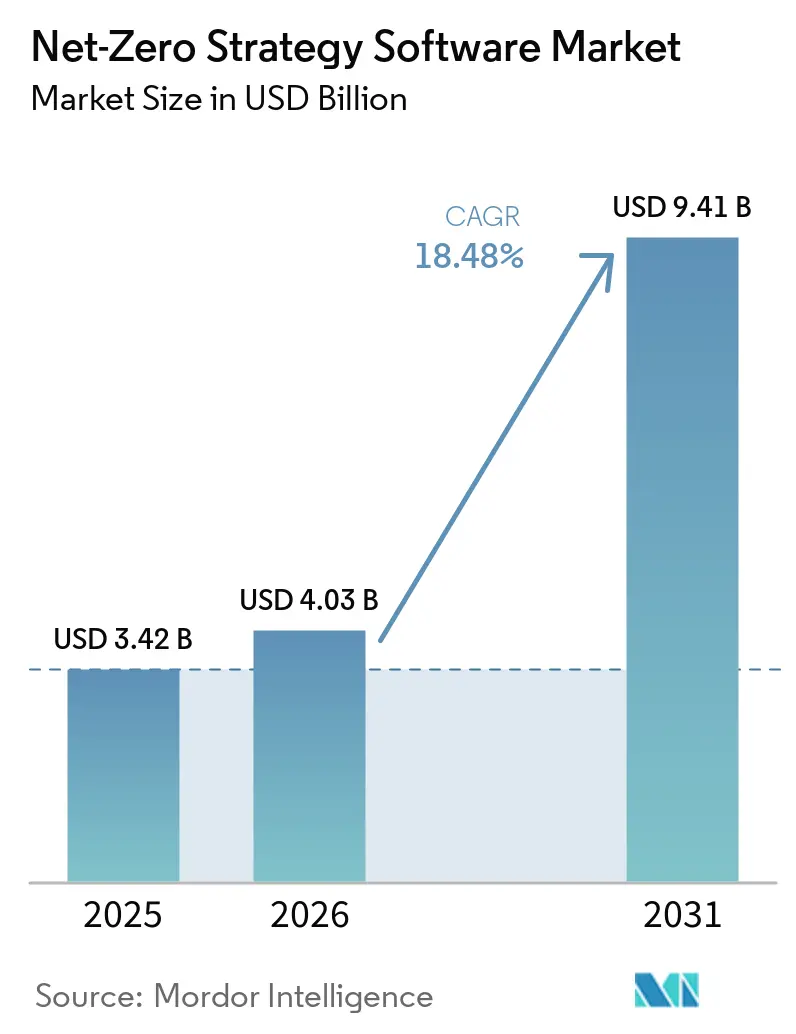
| Market Size (2026) | USD 4.03 Billion |
| Market Size (2031) | USD 9.41 Billion |
| Growth Rate (2026 - 2031) | 18.48% CAGR |
| Fastest Growing Market | Asia-Pacific |
| Largest Market | North America |
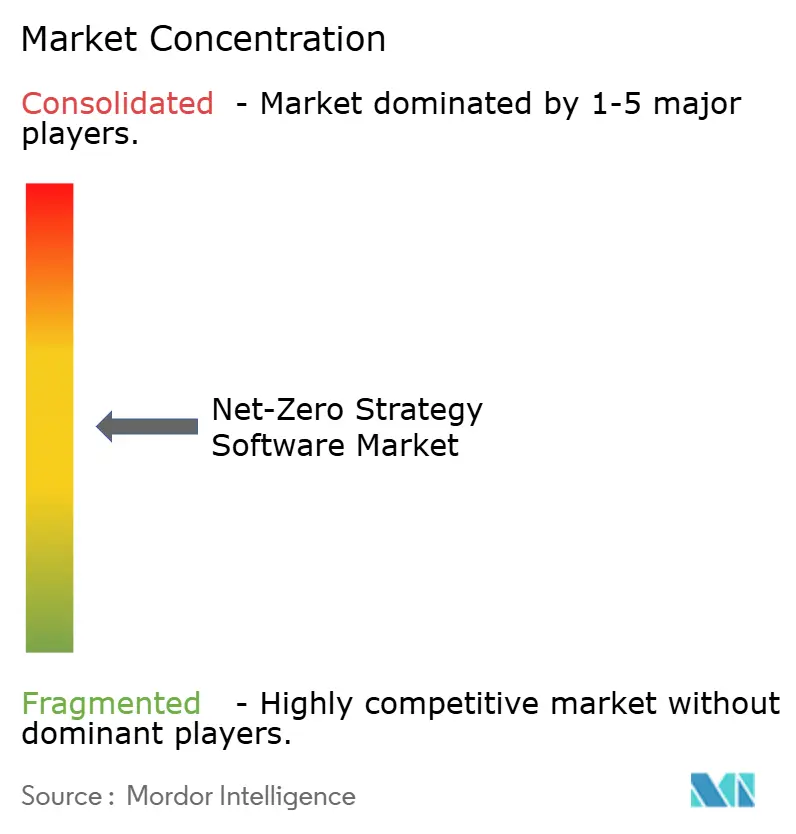
| Market Concentration | Medium |
Major Players *Disclaimer: Major Players sorted in no particular order Image © Mordor Intelligence. Reuse requires attribution under CC BY 4.0. | |
Net-Zero Strategy Software Market Analysis by Mordor Intelligence
The net-zero strategy software market size is projected to expand from USD 3.42 billion in 2025 and USD 4.03 billion in 2026 to USD 9.41 billion by 2031, registering a CAGR of 18.48% between 2026 and 2031. Mandatory disclosure rules across major economies are sustaining growth, signaling a clear move away from voluntary ESG narratives toward assurance-ready emissions records, and driving stronger buyer pressure on suppliers to provide value-chain carbon data. In Europe, climate disclosure requirements remain in place even after the Omnibus I changes, meaning the enterprise buying pipeline for software platforms has narrowed but not weakened. In North America, the proposed rollback of federal climate disclosure rules has not eliminated spending needs, as many companies still face state mandates and investor reporting requirements. Product-level regulation is also expanding the demand base, especially for manufacturers that need carbon data for batteries and materials, as well as for future digital product passport requirements. These shifts are making net-zero software a more embedded operating tool, supporting recurring demand and strengthening the position of platforms that combine reporting, analytics, and implementation support.
Key Report Takeaways
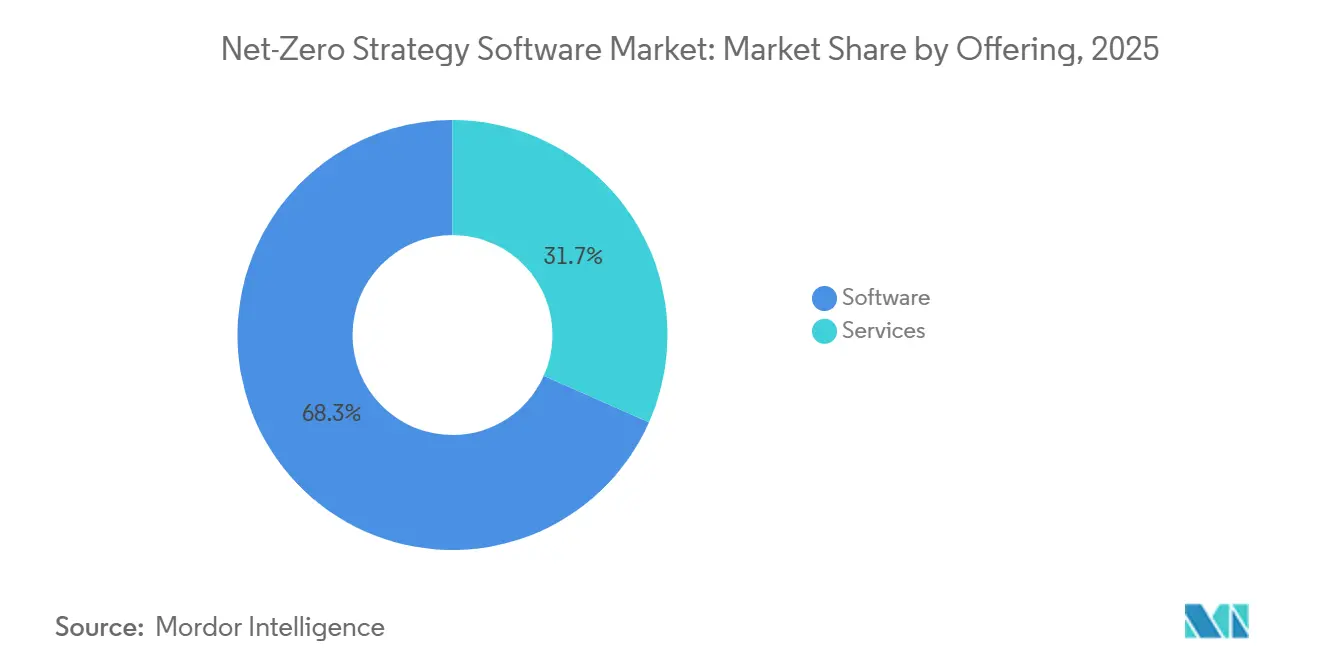
- Software remained the leading revenue contributor with share of 68.34% in net-zero strategy software market in 2025, while services are projected to expand at a 19.84% CAGR through 2031 as buyers seek implementation and data support alongside licenses.
- By deployment, cloud-based platforms held 65.47% share in 2025, while hybrid deployment is projected to expand at a 20.12% CAGR through 2031.
- By enterprise size, large enterprises held 64.90% share in 2025, while small and medium enterprises are projected to expand at a 21.56% CAGR through 2031.
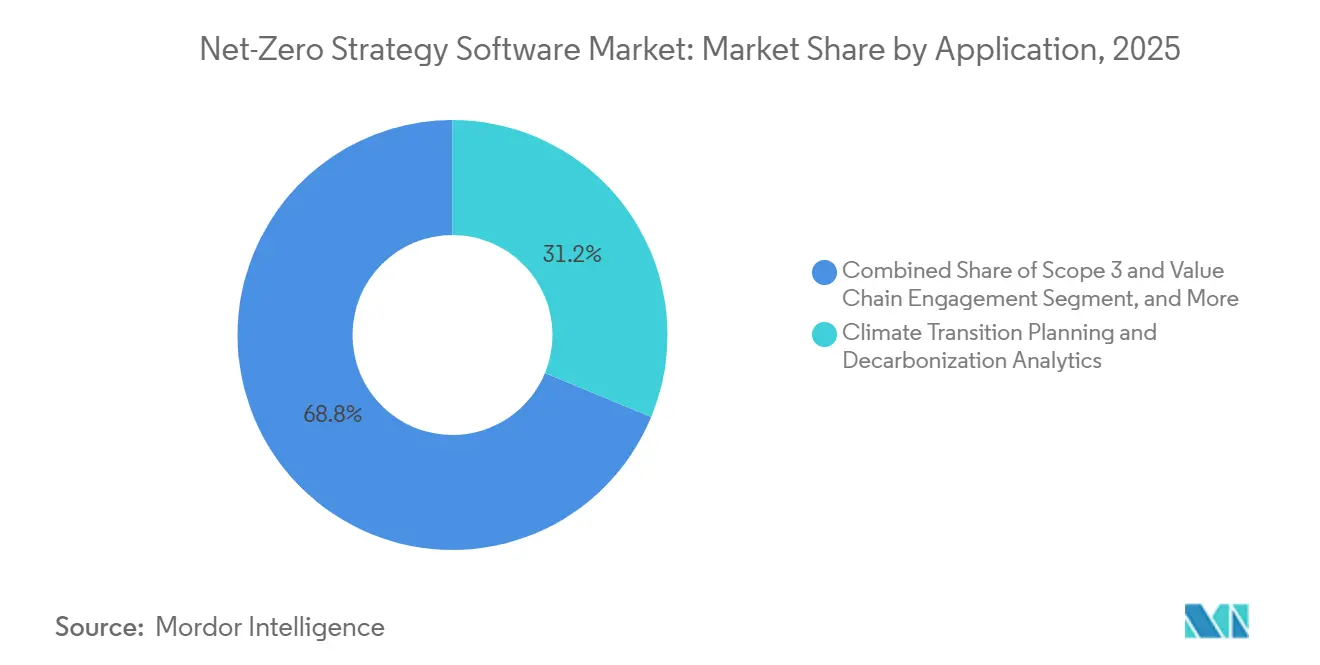
- By application, Climate Transition Planning and Decarbonization Analytics held the leading share in 2025, while Scope 3 and Value Chain Engagement are projected to expand at a 22.78% CAGR through 2031.
- By end-user industry, manufacturing and industrial held 27.45% share in 2025, while transportation and logistics are projected to expand at a 19.95% CAGR through 2031.
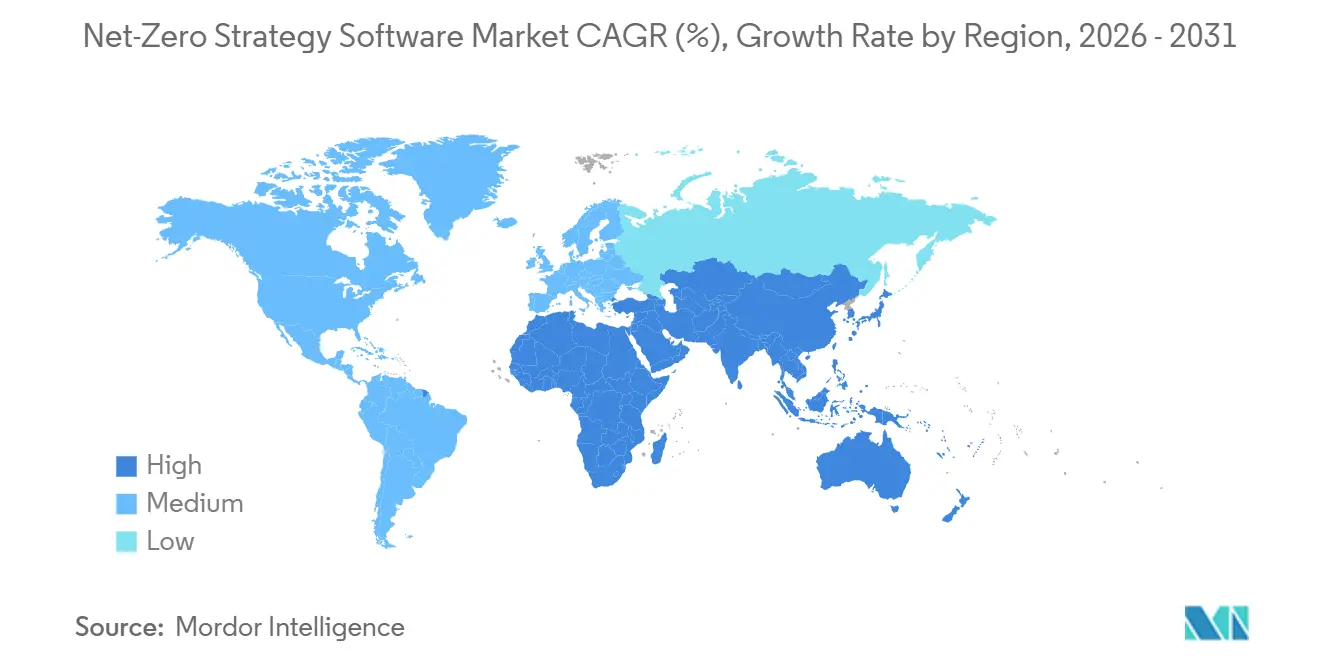
- By geography, North America held 35.10% of the net-zero strategy software market share in 2025, while Asia-Pacific is projected to expand at a 24.63% CAGR through 2031.
Note: Market size and forecast figures in this report are generated using Mordor Intelligence’s proprietary estimation framework, updated with the latest available data and insights as of January 2026.
Global Net-Zero Strategy Software Market Trends and Insights
Drivers Impact Analysis*
| Driver | (~) % Impact on CAGR Forecast | Geographic Relevance | Impact Timeline |
|---|---|---|---|
| Stricter Climate Disclosure Mandates | +4.5% | Global, concentrated pressure in EU and US state-level mandates | Short term (≤ 2 years) |
| Rising Scope 3 Supplier Data Pressure | +3.8% | Global, primary chains in EU, North America, and APAC | Short term (≤ 2 years) |
| Expansion Of AI-Enabled Emissions Modeling | +2.9% | Global, early AI adoption in North America and APAC | Medium term (2-4 years) |
| Integration With ERP, EHS, And Finance Systems | +2.5% | Global, concentrated in large-enterprise markets of North America and Europe | Medium term (2-4 years) |
| Demand For Audit-Ready Traceability And Assurance | +2.0% | EU core, expanding to North America and APAC | Short term (≤ 2 years) |
| Product Carbon Footprint And Digital Product Passport Readiness | +1.6% | EU core, spillover to export-focused APAC and Middle East and Africa manufacturing | Medium term (2-4 years) |
| Source: Mordor Intelligence | |||
Stricter Climate Disclosure Mandates
The net-zero strategy software market is seeing immediate demand from the first active cycle of CSRD reporting, as many large companies have moved beyond consultant-led spreadsheets and now need systems to manage recurring disclosures at scale. The Omnibus I changes reduced the total reporting universe, but they kept ESRS E1 climate disclosure obligations in place and preserved the need for documented scenario analysis, traceable data sources, and more structured reporting workflows.[1]European Commission, “Corporate Sustainability Reporting Directive Frequently Asked Questions,” European Commission, finance.ec.europa.eu In the United States, the SEC’s May 2026 proposal to rescind its climate disclosure rules shifted spending patterns, but it did not eliminate compliance investment, because companies still face state rules and investor pressure. California’s SB 253 has become especially important because companies with more than USD 1 billion in annual California revenue must disclose Scope 1 and Scope 2 emissions by August 2026 and face material penalties for non-compliance. This patchwork of rules favors multi-framework systems that can handle European reporting, investor-aligned standards, and state mandates within a single workflow, rather than single-purpose tools. That is one reason the net-zero strategy software market is moving toward broader enterprise platforms instead of narrow reporting products.
Rising Scope 3 Supplier Data Pressure
Scope 3 emissions often account for the largest share of corporate footprints, which is pushing the net-zero strategy software market toward tools that can gather primary supplier data rather than rely on generic estimates. In early 2026, 45% of business leaders reported only limited confidence in the accuracy of their Scope 3 data, which shows how far many companies still are from assurance-ready value chain reporting. ESRS E1 requires traceable Scope 3 disclosure methods, source data, and calculation logic, so spend-based estimates alone are no longer enough for many in-scope companies. The result is a clear downstream effect, because large enterprises are asking smaller suppliers for direct activity data and making carbon reporting part of routine supplier qualification. Verra’s planned Scope 3 Standard launch in Q3 2026 adds another layer, because shipment-level and supply chain records will need stronger digital infrastructure to support verified decarbonization claims.[2]Verra, “Verra Scope 3 Standard Programme,” Verra, verra.org The ICC-Sage stocktake also found that SMEs using digital carbon-tracking tools were 2.4 times more likely to have formal reporting systems, which supports the expanding role of net-zero strategy software in smaller supply chain participants.[3]International Chamber of Commerce and Sage, “2025 ICC-Sage SME Climate Finance Stocktake 2021-2025,” International Chamber of Commerce, iccwbo.org
Expansion Of AI-Enabled Emissions Modeling
The net-zero strategy software market is also gaining speed from AI tools that shorten the time needed to clean, analyze, and explain emissions data. Watershed stated in April 2026 that its AI-assisted workflows cut the time to actionable sustainability data by 80%, and one test customer reduced a 5-hour cleaning task to 20 minutes. In China, the Shanghai Academy of Sciences released the ScienceOne-Yuheng Carbon Accounting Large Model in April 2026, indicating that carbon accounting is beginning to attract foundation-model-level infrastructure and research attention. The more important commercial shift is that platforms are moving beyond dashboards and becoming active decision-support systems that can detect anomalies, run decarbonization scenarios, and help prepare disclosure content. That changes buyer expectations, because customers increasingly want software that can work across large data sets with less manual intervention and less internal specialist labor. It also raises the consolidation pressure in the net-zero strategy software market, because vendors without access to strong AI capabilities may struggle to keep pace on product depth and operating efficiency.
Integration With ERP, EHS, And Finance Systems
The net-zero strategy software market is increasingly shaped by vendors that sit close to core enterprise systems, because carbon reporting depends on financial, operational, and supplier data that already live inside ERP, EHS, and finance platforms. SAP’s Green Ledger, introduced in late 2024, lets companies align carbon and financial accounting at the profit-center level within S/4HANA, which gives ERP-native offerings a clear advantage in large accounts. IFS added to that trend in May 2026 with IFS Zero, an emissions operating system built into IFS Cloud 26R1 for asset-intensive sectors. This matters because many pure-play tools still depend on pulling data from multiple disconnected systems, which raises deployment costs and delays reporting cycles. Buyers are therefore placing more weight on pre-built connectors, shared data models, and closer links between sustainability teams and finance teams. That dynamic is pushing the net-zero strategy software market toward vendors that can combine carbon logic with day-to-day enterprise workflows rather than treating carbon reporting as a stand-alone add-on.
Restraints Impact Analysis*
| Restraint | (~) % Impact on CAGR Forecast | Geographic Relevance | Impact Timeline |
|---|---|---|---|
| Fragmented Emission Factors and Data Standards | -1.9% | Global, most acute in multi-region deployments and emerging markets | Medium term (2-4 years) |
| High Integration Burden Across Legacy Enterprise Stacks | -1.6% | Global, concentrated in manufacturing-heavy industrial markets in Asia and EU | Medium term (2-4 years) |
| Supplier Data Access and Confidentiality Constraints | -1.1% | Global, particularly acute in Scope 3-heavy sectors such as transportation and logistics, BFSI, and retail | Long term (≥ 4 years) |
| Specialized Talent Shortage in Climate Data Operations | -0.9% | Global, most pronounced in South America, Africa, and Southeast Asia | Long term (≥ 4 years) |
| Source: Mordor Intelligence | |||
Fragmented Emission Factors And Data Standards
The net-zero strategy software market still faces a fundamental data problem: there is no single global emission factor library that companies can use across all reporting contexts. Multinational firms often need to reconcile ESRS E1 rules, GHG Protocol methods, ISO standards, and country-specific factors within a single auditable reporting system. That creates a direct assurance risk, because the same activity can produce different emissions results depending on the methodology or factor source applied. Product-level data exchange frameworks such as PACT help reduce some of that variation, but adoption remains uneven, especially where suppliers are reluctant to share commercially sensitive process data. Vendors with proprietary, frequently updated factor databases have an advantage because they can reduce client friction and make methodology choices more transparent. Even so, uneven factor standards remain a drag on the software market for net-zero strategies, especially for companies operating across multiple jurisdictions and product categories.[4]SAP, “SAP Sustainability Data Exchange,” SAP, sap.com
High Integration Burden Across Legacy Enterprise Stacks
A second restraint comes from the work required to connect carbon software with complex enterprise systems, which continues to slow buying decisions in the net-zero strategy software market. Many industrial companies still operate with mixed IT environments that include newer ERP suites, older local systems, plant-level tools, and separate finance records. That means emissions calculations often depend on custom data mapping before any reporting output can be trusted. The problem is even harder in Scope 3 programs because supplier data rarely arrives through a single, clean channel and instead comes from numerous external partners with different formats and levels of maturity. Finance teams are also taking on a larger role in sustainability reporting, but many general ledger structures still do not align well with activity-based emissions data, which increases reconciliation work. Vendors that provide pre-built integrations and deployment support are, therefore, better placed, while others face longer implementation cycles, higher project costs, and greater resistance from buyers concerned about deployment complexity and ongoing maintenance requirements.
*Our forecasts treat driver/restraint impacts as directional, not additive. The impact forecasts reflect baseline growth, mix effects, and variable interactions.
Segment Analysis
By Offering: Services Growth Reflects Execution Needs
Software remained the largest offering by revenue, contributing 68.34% of revenue in 2025, while services are expected to record the fastest growth at a 19.84% CAGR from 2026 to 2031. That pattern shows that the net-zero strategy software market still earns most of its revenue from recurring platform subscriptions, but it also shows that customers increasingly need help getting reliable data into those systems. Many companies that bought platforms in 2024 and 2025 found that the reporting logic worked, but the source data from suppliers, business units, and operational systems was incomplete or inconsistent. As a result, buyers are now spending more on implementation, managed data collection, assurance preparation, and workflow support. The net-zero strategy software industry is therefore shifting toward mixed commercial models in which services are not an add-on, but a core part of client retention and delivery.
This shift also reflects the labor gap in climate data operations. Companies often need teams that understand the GHG Protocol, supplier engagement, system integration, and disclosure controls simultaneously, and that combination is still hard to hire for at scale. In practice, this makes managed services valuable even when customers prefer software-led operating models. Vendors that add advisory and data operations support can improve customer adoption, reduce reporting delays, and expand contract value over time. The result is that services are growing faster because they solve execution problems that software licenses by themselves cannot solve. That makes this part of the net-zero strategy software market important not just for growth, but also for long-term account stability.


By Deployment Mode: Cloud Leads While Hybrid Gains Ground
Cloud-based deployment accounted for 65.47% of the net-zero strategy software market in 2025, while hybrid deployment is projected to grow at a 20.12% CAGR through 2031. Cloud platforms maintained their lead because buyers want automated regulatory content updates and faster product releases in a market where reporting frameworks are constantly evolving. This has been especially important for enterprises that need to align climate disclosure, supplier engagement, and board reporting without running frequent manual updates. The net-zero strategy software market, therefore, continues to favor cloud models where compliance content and calculation logic can be refreshed centrally. At the same time, hybrid deployment is gaining share because some organizations still need to keep sensitive operational or financial data within controlled environments.
That makes hybrid architecture a deliberate design choice rather than a temporary compromise. Large organizations in BFSI, energy, and government often need a structure where confidential records remain on-premise while emissions engines and reporting workflows operate in the cloud. This setup supports both compliance and internal governance, especially in regions with strict data sovereignty and cybersecurity rules. On-premise systems still matter in settings where local control over production data is a high priority, but their structural limits are clearer now than they were a few years ago. Within the net-zero strategy software market, deployment choices are increasingly reflecting governance needs rather than just IT preferences. The net-zero strategy software industry is therefore rewarding vendors that can support flexible deployment models without weakening security or reporting speed.
By Enterprise Size: SMEs Become A Core Growth Pool
Large enterprises held 64.90% share in 2025, but SMEs are expected to grow faster at a 21.56% CAGR from 2026 to 2031. This split reflects the history of early adoption, because the first large wave of demand came from major listed companies with direct disclosure exposure and stronger internal budgets. The net-zero strategy software market is expanding, as large companies are requesting primary emissions data from their smaller suppliers as part of Scope 3 reporting and procurement qualification. Europe is adding to that pressure through the VSME framework, scheduled for adoption in July 2026, which provides non-listed SMEs with a structured framework for sustainability disclosure. Singapore’s Green 100 initiative also showed how large enterprises can accelerate supplier onboarding by bringing SME partners onto reporting systems.
Digital reporting also improves access to finance and formal governance for smaller firms. The World Economic Forum stated in 2025 that SMEs using digital carbon-tracking tools were more likely to access green finance and build formal reporting structures. That means adoption is no longer driven only by regulation, because commercial opportunity and supplier retention are also becoming important. Entry-level tiers and lower-cost deployment models are helping vendors reach this wider customer base. For the net-zero strategy software market, SMEs are no longer a long-tail opportunity. They are becoming one of the clearest sources of incremental volume growth across supply chains.
By Application: Scope 3 Tools Drive The Fastest Expansion
Climate Transition Planning and Decarbonization Analytics held the leading application share in 2025, while Scope 3 and Value Chain Engagement are expected to grow at a 22.78% CAGR from 2026 to 2031. Boards are placing more weight on tools that connect carbon accounting with planning, investment choices, and operating targets, which explains the size of the transition planning category. Even so, the fastest pull is now coming from Scope 3 programs, because companies need supplier data that can withstand audit review and customer scrutiny. The net-zero strategy software market has therefore moved well beyond basic emissions inventories and now depends more on data exchange, supplier collaboration, and workflow traceability. California reporting deadlines, CSRD obligations, and buyer-led product carbon requirements are all advancing this application area simultaneously.
The category is also broadening in a second direction through product and lifecycle carbon management. The EU’s Ecodesign for Sustainable Products Regulation and the first battery carbon footprint declaration requirements, which became effective on February 18, 2026, are turning product carbon data into a compliance requirement for many manufacturers selling into Europe. That supports above-average demand for tools that can capture cradle-to-gate data and move it into product registries and supplier contracts. Assurance and governance tools are also gaining relevance as third-party verification becomes more important under European reporting rules. Together, these changes are making the net-zero strategy software market less centered on annual disclosure alone and more centered on operational decision-making. That wider role should support higher-value use cases across the full application mix.

By End-User Industry: Manufacturing Leads While Logistics Speeds Up
Manufacturing and industrial held 27.45% share in 2025, while transportation and logistics are projected to grow at a 19.95% CAGR through 2031. Manufacturing led because it sits at the center of multiple compliance and commercial pressures, including CSRD reporting, CBAM exposure, product-level carbon rules, and customer demands for supplier data. In practical terms, this means manufacturers often need one platform to manage plant emissions, supplier information, product carbon footprints, and board-level transition planning. That combination has made manufacturing the largest demand pool in the net-zero strategy software market. Climate software is also becoming more relevant to logistics operators, because buyers increasingly need shipment-level visibility rather than broad annual estimates.
This is why transportation and logistics are emerging as the fastest-growing end-user group. Freight emissions are spread across carriers, routes, modes, and subcontractors, so companies need stronger data capture and more specialized workflow support than many general carbon tools were originally built to provide. BFSI is also expanding quickly as financed emissions, climate stress testing, and investor disclosure move closer to core risk management. Energy, utilities, retail, healthcare, IT and telecom, and the public sector add breadth to the revenue base, even if they do not lead growth rates. Across these sectors, the net-zero strategy software market is increasingly valued for its ability to connect compliance data with business operations rather than for disclosure output alone. That sector mix supports a broadening demand base even as the largest share remains concentrated in heavy industrial use cases.
Geography Analysis
North America held 35.10% of the net-zero strategy software market share in 2025, while Asia-Pacific is expected to expand at a 24.63% CAGR through 2031. North America remained the largest regional revenue pool because large enterprises there had already built voluntary reporting habits, investor-facing disclosure processes, and early Scope 3 programs before several other regions. The SEC’s May 2026 proposal to rescind federal climate disclosure rules shifted the policy direction at the federal level, but it did not eliminate software demand, as state mandates, especially in California, continue to require emissions reporting from large companies. Canada and Mexico remain smaller contributors, but both benefit from buyer pressure coming from export chains and large corporate groups. For the net-zero strategy software market, North America still offers scale, even with a less certain federal rule path.
Europe remained the second-largest region because it has the most structured disclosure architecture and the clearest alignment between corporate reporting and assurance expectations. CSRD and ESRS E1 continue to set the tone for enterprise buying, and the 2026 Omnibus changes narrowed the universe without removing climate disclosure as a core requirement. Germany stands out because manufacturers there face pressure from product carbon rules and value-chain reporting simultaneously. The United Kingdom continues to follow a parallel domestic route with reporting expectations that remain close to international standards. As a result, Europe keeps its role as the region where the net-zero strategy software market is most deeply tied to assurance-ready corporate processes.
Asia-Pacific is the fastest-growing region because regulatory reforms, industrial decarbonization, and export-driven demand from suppliers are all rising together. China’s industrial policy and digital energy-carbon management push are supporting software demand beyond companies directly exposed to overseas reporting rules, while Japan’s transition finance direction is expanding corporate use cases. Domestic platforms are also becoming more visible, with Asuene serving more than 15,000 companies as of August 2025 and Zeroboard integrating the AIST-IDEA factor database as a standard feature. The Shanghai Academy of Sciences’ 2026 release of a panoramic carbon accounting large model also points to strong regional interest in AI-led carbon infrastructure. South America, the Middle East, and Africa remain smaller in revenue terms, but demand is expanding in export sectors and state-backed net-zero programs, even as talent shortages push many buyers toward managed services and simpler platform tiers.

Competitive Landscape
The net-zero strategy software market remains moderately fragmented, with no single vendor dominating the field and strong competition among pure-play specialists, governance platforms, and larger enterprise software providers. Sphera, Watershed, Persefoni, and EcoVadis sit in the visible top tier, while Greenly, Normative, Sweep, CarbonChain, Carbmee, and others compete through application depth, regional fit, or customer segment focus. This structure means buyers still have a broad choice, but it also means vendors need a clearer point of difference than basic carbon accounting or standard disclosure templates. In the net-zero strategy software market, measurement engines, supplier networks, product carbon tools, and assurance-ready workflows are becoming more important sources of differentiation than standard dashboard features. That change is making the market more competitive at the product level even before broader consolidation fully takes hold.
Acquisition and partnership activity shows how vendors are responding. Persefoni’s October 2025 agreement with Diligent transferred Diligent’s carbon accounting client base to Persefoni and expanded Persefoni’s reach into governance, risk, and compliance workflows. Watershed’s May 2025 acquisition of VitalMetrics strengthened its emissions factor data assets, which matters because proprietary data depth raises switching costs and supports stronger reporting quality. EcoVadis also widened its ecosystem reach in May 2026 through its partnership with Workiva, which linked supplier-primary carbon data with regulatory filing workflows. These moves show that the net-zero strategy software market is consolidating around data depth, workflow breadth, and stronger ties to existing enterprise processes.
A second competitive force is coming from ERP-native and enterprise-stack providers. SAP Green Ledger and IFS Zero show that carbon management is being embedded inside broader operating systems, which can lower buyer resistance because the spending sits closer to existing enterprise contracts. That creates pressure on stand-alone vendors whose main value has been data aggregation and simple scope calculations. Vendors that can produce auditor-readable outputs with clear methodologies and durable calculation trails are likely to hold an advantage as assurance needs deepen. The net-zero strategy software market, therefore, has room for specialists, but the bar for staying independent is rising. White space still exists in financed emissions, logistics measurement, and SME-focused Scope 3 services, but scale and integration are becoming harder to ignore.
Net-Zero Strategy Software Industry Leaders
Watershed Technologies, Inc.
Persefoni AI, Inc.
Greenly SAS
Sweep SAS
Plan A ESG GmbH
- *Disclaimer: Major Players sorted in no particular order

Recent Industry Developments
- May 2026: Persefoni launched the Persefoni Analytics Agent, an agentic AI tool enabling sustainability teams to analyze emissions data through plain-language prompts and generate in-depth visualisations, supporting more than 500 enterprise customers globally.
- May 2026: IFS launched IFS Zero, an agentic Emissions Operating System for asset-intensive industries, providing a unified Scope 1, 2, and 3 calculation platform integrated with IFS Cloud 26R1. The product represents the first ERP-native agentic emissions platform for heavy industry, released simultaneously across ERP, EAM, and field service modules.
- May 2026: EcoVadis announced a strategic partnership with Workiva, enabling mutual customers to connect supplier-primary carbon emissions data directly with Workiva's regulatory disclosure infrastructure for CSRD, CDP, and ISSB filings. The integration is live for existing EcoVadis and Workiva customers immediately upon launch.
- April 2026: Watershed launched AI data cleaning and analysis agents at San Francisco Climate Week, reducing time to actionable sustainability data by 80% in test deployments. One customer completed a 5-hour data cleaning project in 20 minutes, a 15x speed improvement.


Global Net-Zero Strategy Software Market Report Scope
The Net-Zero Strategy Software market comprises digital platforms and services that enable organizations to plan, manage, and operationalize their transition to net-zero carbon emissions. These solutions provide capabilities such as carbon management and reporting, climate transition planning, decarbonization analytics, Scope 3 and value chain engagement, product and lifecycle carbon management, and assurance and governance.
The Net-Zero Strategy Software market report is segmented by Offering (Software and Services), Deployment Mode (Cloud-Based, On-Premise, and Hybrid), Enterprise Size (Large Enterprises, and Small and Medium Enterprises), Application (Carbon Management and Reporting, Climate Transition Planning and Decarbonization Analytics, Scope 3 and Value Chain Engagement, Product and Lifecycle Carbon Management, Assurance and Governance), End-user Industry (Manufacturing and Industrial, Energy, Utilities and Natural Resources, BFSI, Retail and Consumer Goods, IT and Telecom, Healthcare and Life Sciences, Government and Public Sector, Transportation and Logistics, and Other End-user Industries), and Geography (North America, South America, Europe, Asia-Pacific, Middle East, and Africa). The Market Forecasts are Provided in Terms of Value (USD).
| Software |
| Services |
| Cloud-Based |
| On-Premise |
| Hybrid |
| Large Enterprises |
| Small and Medium Enterprises |
| Carbon Management and Reporting |
| Climate Transition Planning and Decarbonization Analytics |
| Scope 3 and Value Chain Engagement |
| Product and Lifecycle Carbon Management |
| Assurance and Governance |
| Manufacturing and Industrial |
| Energy, Utilities and Natural Resources |
| BFSI |
| Retail and Consumer Goods |
| IT and Telecom |
| Healthcare and Life Sciences |
| Government and Public Sector |
| Transportation and Logistics |
| Other End-user Industries |
| North America | United States |
| Canada | |
| Mexico | |
| South America | Brazil |
| Argentina | |
| Rest of South America | |
| Europe | Germany |
| United Kingdom | |
| France | |
| Italy | |
| Spain | |
| Russia | |
| Netherlands | |
| Rest of Europe | |
| Asia-Pacific | China |
| Japan | |
| India | |
| South Korea | |
| Australia and New Zealand | |
| Rest of Asia-Pacific | |
| Middle East | Saudi Arabia |
| United Arab Emirates | |
| Rest of Middle East | |
| Africa | South Africa |
| Nigeria | |
| Rest of Africa |
| By Offering | Software | |
| Services | ||
| By Deployment Mode | Cloud-Based | |
| On-Premise | ||
| Hybrid | ||
| By Enterprise Size | Large Enterprises | |
| Small and Medium Enterprises | ||
| By Application | Carbon Management and Reporting | |
| Climate Transition Planning and Decarbonization Analytics | ||
| Scope 3 and Value Chain Engagement | ||
| Product and Lifecycle Carbon Management | ||
| Assurance and Governance | ||
| By End-user Industry | Manufacturing and Industrial | |
| Energy, Utilities and Natural Resources | ||
| BFSI | ||
| Retail and Consumer Goods | ||
| IT and Telecom | ||
| Healthcare and Life Sciences | ||
| Government and Public Sector | ||
| Transportation and Logistics | ||
| Other End-user Industries | ||
| By Geography | North America | United States |
| Canada | ||
| Mexico | ||
| South America | Brazil | |
| Argentina | ||
| Rest of South America | ||
| Europe | Germany | |
| United Kingdom | ||
| France | ||
| Italy | ||
| Spain | ||
| Russia | ||
| Netherlands | ||
| Rest of Europe | ||
| Asia-Pacific | China | |
| Japan | ||
| India | ||
| South Korea | ||
| Australia and New Zealand | ||
| Rest of Asia-Pacific | ||
| Middle East | Saudi Arabia | |
| United Arab Emirates | ||
| Rest of Middle East | ||
| Africa | South Africa | |
| Nigeria | ||
| Rest of Africa | ||


Key Questions Answered in the Report
What is the current and forecast value of net-zero strategy software?
The market was valued at USD 3.42 billion in 2025, stands at USD 4.03 billion in 2026, and is forecast to reach USD 9.41 billion by 2031 at a CAGR of 18.48%.
Which deployment model leads adoption today?
Cloud-based deployment led with 65.47% share in 2025 because buyers value continuous regulatory updates and easier platform maintenance.
Why is Scope 3 software growing faster than other application areas?
Scope 3 and Value Chain Engagement is projected to expand at a 22.78% CAGR through 2031 as supplier data requests, CSRD obligations, and buyer-facing product carbon requirements intensify.
Which customer group is expanding fastest?
SMEs are the fastest-growing enterprise size segment at a 21.56% CAGR through 2031, mainly because large buyers are pushing emissions reporting down their supply chains.
Which sectors are driving demand the most?
Manufacturing and industrial held the largest share at 27.45% in 2025, while transportation and logistics is growing fastest at a 19.95% CAGR because shipment-level emissions data is becoming more important.
Which region offers the strongest growth outlook?
Asia-Pacific is projected to grow at a 24.63% CAGR through 2031, while North America remained the largest regional market with a 35.10% share in 2025.
Page last updated on:


