Storage Area Network (SAN) Solutions Market Size and Share
Market Overview
| Study Period | 2019 - 2030 |
|---|---|
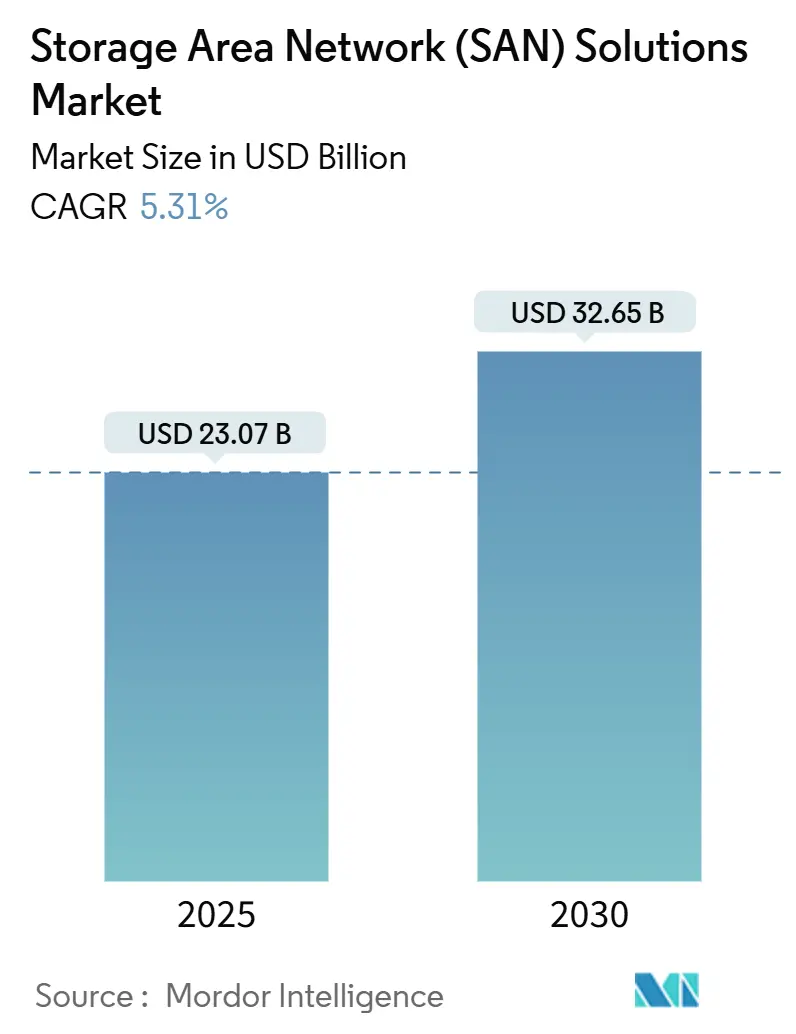
| Market Size (2025) | USD 23.07 Billion |
| Market Size (2030) | USD 32.65 Billion |
| Growth Rate (2025 - 2030) | 5.31% CAGR |
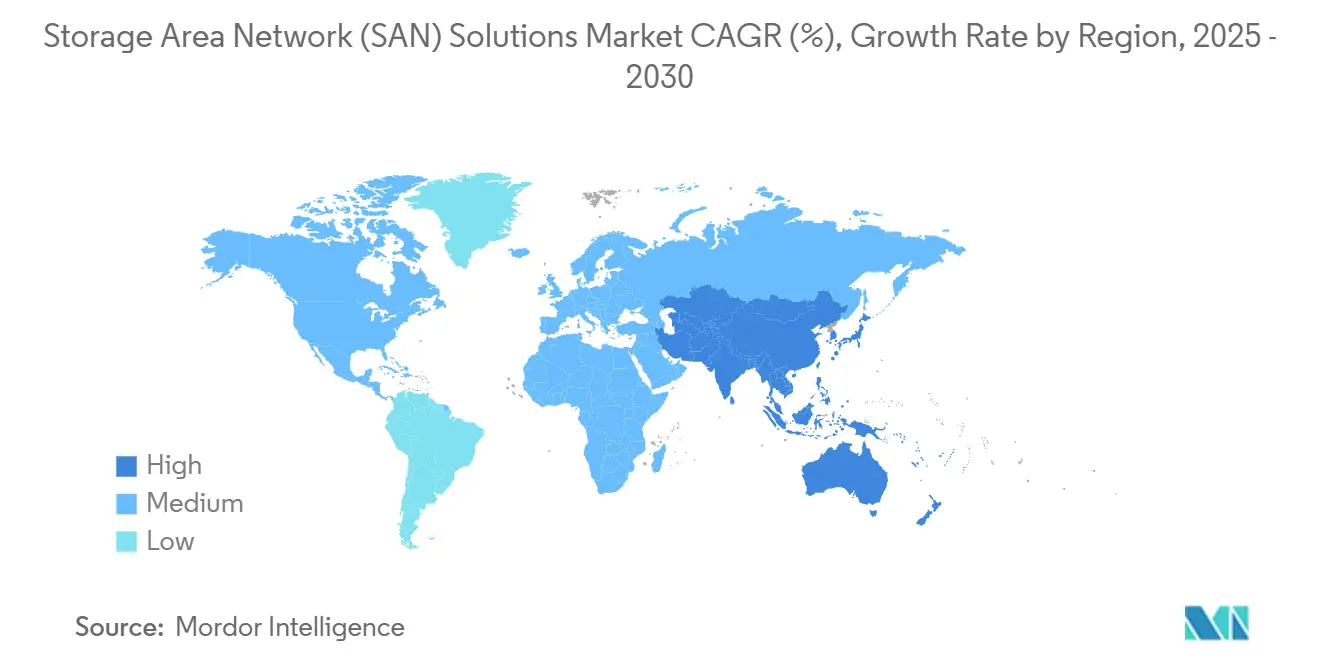
| Fastest Growing Market | Asia Pacific |
| Largest Market | North America |
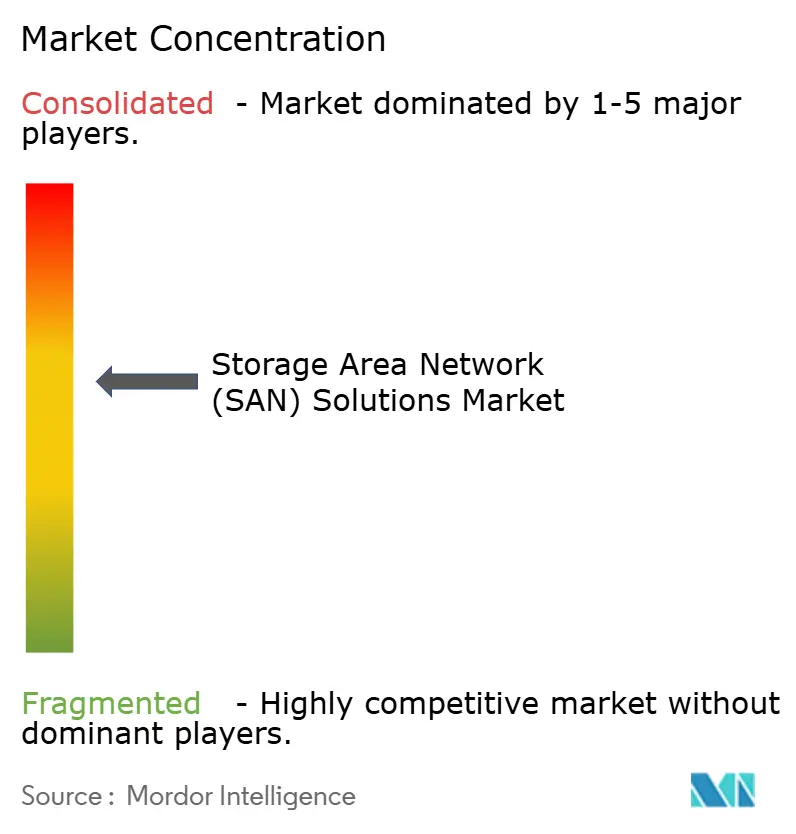
| Market Concentration | Medium |
Major Players *Disclaimer: Major Players sorted in no particular order Image © Mordor Intelligence. Reuse requires attribution under CC BY 4.0. | |
Storage Area Network (SAN) Solutions Market Analysis by Mordor Intelligence
The Storage Area Network (SAN) market size stands at USD 23.07 billion in 2025 and is forecast to reach USD 32.65 billion by 2030, expanding at a 5.31% CAGR during the period. Market momentum accelerates as enterprises overhaul legacy storage to meet AI and real-time analytics requirements, adopt lower-latency fabrics, and align with cloud-centric procurement models.[1]Jeff Boudreau, “AI Workloads Driving Storage Infrastructure Evolution,” Dell Technologies, dell.com Demand is reinforced by hyperscale data-center expansion, software-defined infrastructure upgrades, and regulatory mandates that prioritize sovereign-cloud capabilities. Vendors benefit from rising edge-data volumes linked to 5G and Industry 4.0 deployments and from sustainability goals that favor energy-efficient flash arrays. Competition centers on software innovation and subscription-based delivery, enabling faster feature rollouts and predictable spending.
Key Report Takeaways
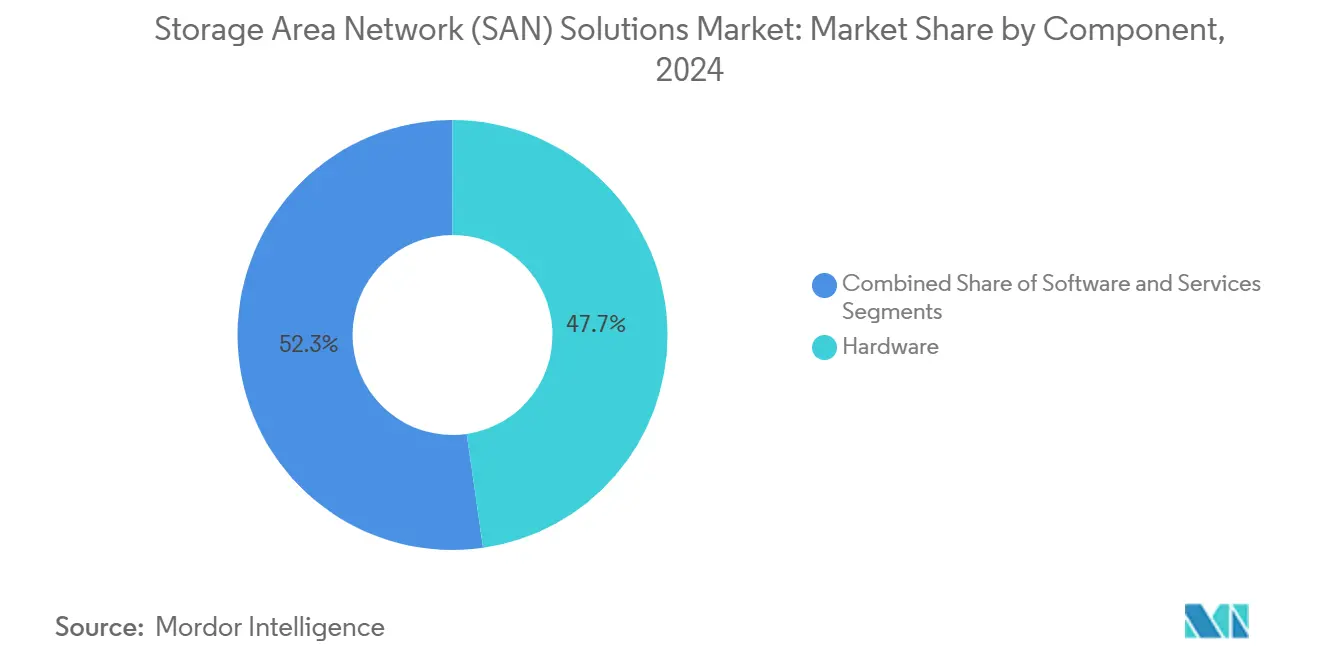
- By component, hardware held 47.73% of the Storage Area Network market share in 2024; software solutions are projected to post the fastest 6.33% CAGR through 2030.
- By SAN type, hyperscale server SANs commanded 38.94% revenue share in 2024 in the Storage Area Network market, while virtual/software-defined SANs are set to expand at 5.98% CAGR to 2030.
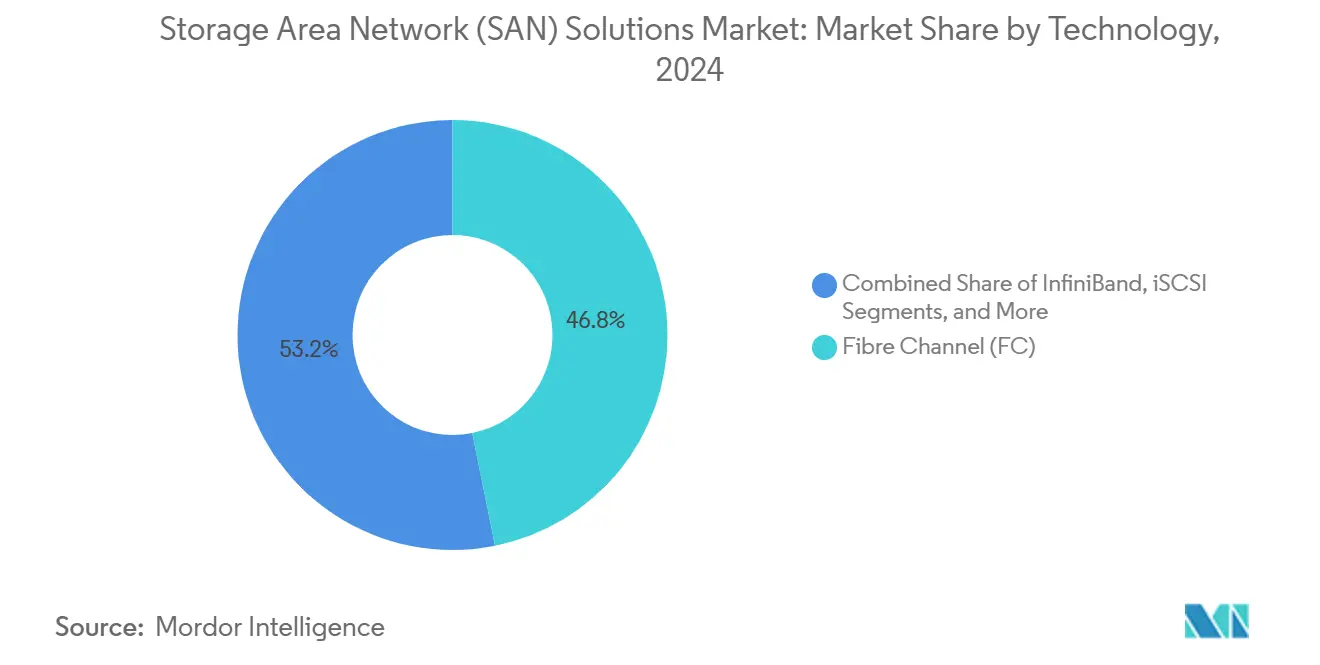
- By technology, fiber channel led with 46.83% share of the Storage Area Network market size in 2024; NVMe-over-Fabrics is advancing at a 6.31% CAGR through 2030.
- By end-user industry, the BFSI sector captured 28.93% share in 2024 in the Storage Area Network market as healthcare and life sciences climbs at a 5.88% CAGR toward 2030.
- By geography, North America accounted for 39.84% of the Storage Area Network market size in 2024, whereas Asia-Pacific is moving at a 6.12% CAGR to 2030.
Note: Market size and forecast figures in this report are generated using Mordor Intelligence’s proprietary estimation framework, updated with the latest available data and insights as of January 2026.
Global Storage Area Network (SAN) Solutions Market Trends and Insights
Drivers Impact Analysis*
| Driver | (~) % Impact on CAGR Forecast | Geographic Relevance | Impact Timeline |
|---|---|---|---|
| Explosion of AI/ML and real-time analytics workloads | +1.2% | Global, concentrated in North America and APAC | Short term (≤ 2 years) |
| Rapid NVMe-over-Fabrics adoption in Tier-1 data-centres | +0.8% | North America and Europe, expanding to APAC | Medium term (2-4 years) |
| Migration from DAS/NAS to pooled SANs in hybrid clouds | +0.7% | Global, led by North America and Europe | Medium term (2-4 years) |
| Government incentives for sovereign-cloud infrastructure | +0.5% | APAC core, expanding to MEA and Latin America | Long term (≥ 4 years) |
| Edge-data proliferation from 5G and Industry 4.0 nodes | +0.4% | Global, early adoption in developed markets | Long term (≥ 4 years) |
| ESG-led demand for energy-efficient flash-based SANs | +0.3% | Europe and North America, expanding globally | Medium term (2-4 years) |
| Source: Mordor Intelligence | |||
Explosion of AI/ML and real-time analytics workloads
Modern AI training and inference pipelines rely on massive parallel I/O streams that saturate traditional disk-based arrays, making ultra-low-latency flash SANs indispensable. GPU clusters reach optimal efficiency only when storage can sustain multimillion-IOPS throughput at sub-millisecond latency. Enterprises migrating model development to high-density compute report 40% faster training cycles after replacing spinning disks with NVMe flash arrays. Financial-services providers, telecom operators, and automotive OEMs expand flash capacity to accommodate large-language models and real-time vision workloads that would otherwise stall on legacy storage. As AI deployments broaden, demand for scalable, high-bandwidth fabrics cements the Storage Area Network market as a cornerstone of enterprise AI infrastructure.
Rapid NVMe-over-Fabrics adoption in Tier-1 data-centers
NVMe-oF extends the parallelism of NVMe drives across shared fabrics, giving servers remote storage access at local-disk speed. Early adopters in high-frequency trading and fraud-detection scenarios document sub-100 µs response and 30% better application latency after NVMe-oF rollout.[2]Broadcom Inc., “NVMe over Fibre Channel HBAs,” broadcom.com Support for Fibre Channel, Ethernet, and InfiniBand transports eases migration from existing topologies, allowing operators to mix legacy and next-gen gear. Fabric upgrades coincide with PCIe Gen5 servers and 400 Gb/s networks, creating a synchronized refresh cycle that accelerates protocol penetration. As standards mature and multi-vendor certifications expand, NVMe-oF becomes the de-facto path to harness the full performance of next-generation flash media.
Migration from DAS/NAS to pooled SANs in hybrid clouds
Hybrid strategies demand a unified pool that spans on-premises racks and public-cloud buckets. Software-defined SANs abstract hardware, automate tiering, and present a single namespace, reducing management time by 25% and boosting utilization by 40%.[3]Garth Snyder, “What Is Hybrid Cloud Storage?,” NetApp, netapp.com Policy-based placement allows active datasets to sit on local flash while colder copies shift to cloud object storage, trimming both latency and cost. Consistent data-protection policies simplify audit compliance across jurisdictions. Consequently, CIOs identify pooled SANs as the foundation of cloud-ready architectures that keep critical data close to compute while enabling elastic burst into public clouds.
Government incentives for sovereign-cloud infrastructure
Countries that finance domestic clouds insist on in-region data storage, managed by vetted vendors. China’s 14th Five-Year Plan alone earmarks USD 1.4 trillion for digital infrastructure, a sizable portion of which is directed toward storage systems compliant with national security guidelines.[4]Asian Development Bank, “Digital Transformation in Asia-Pacific,” adb.org Europe’s Digital Single Market program underpins similar drives, pushing suppliers to offer geo-fenced control planes and certified encryption. Vendors that embed policy engines, key management integration, and post-quantum cryptography gain first-mover status in bids tied to public-sector modernization and critical infrastructure upgrades.
Restraints Impact Analysis*
| Restraint | (~) % Impact on CAGR Forecast | Geographic Relevance | Impact Timeline |
|---|---|---|---|
| High upfront CAPEX and skills gap for Fibre-Channel SANs | -0.6% | Global, particularly affecting SME adoption | Short term (≤ 2 years) |
| Persistent interoperability issues across multi-vendor gear | -0.4% | Global, concentrated in complex enterprise environments | Medium term (2-4 years) |
| Rising ransomware premiums driving shift to object storage | -0.3% | North America and Europe, expanding to APAC | Short term (≤ 2 years) |
| AI-optimised CXL memory fabrics threatening SAN relevance | -0.2% | North America and APAC, early enterprise adopters | Long term (≥ 4 years) |
| Source: Mordor Intelligence | |||
High upfront CAPEX and skills gap for Fibre-Channel SANs
Mid-sized enterprises can spend upwards of USD 500,000 on switch, HBA, and array bundles before accounting for specialist staff. Certified FC administrators command premium salaries, yet CompTIA notes a 35% shortfall in qualified storage pros worldwide. Many IT leaders bypass the expense by selecting Ethernet-based iSCSI or software-defined SAN alternatives that rely on existing network talent. Vendors mitigate the hurdle with pay-as-you-grow subscription offers, but the initial sticker shock and training demands still dampen Fiber Channel expansion among budget-constrained organizations.
Persistent interoperability issues across multi-vendor gear
Despite T11 and SNIA standards, firmware skews, zoning quirks, and proprietary management APIs generate 15-20% more operational overhead in heterogeneous fabrics. Integration complexities extend rollout times and spike support tickets when orchestration tools meet mismatched HBAs or array microcodes. Containerized workloads exacerbate the pain because CSI plug-ins and Kubernetes operators differ by vendor. Enterprises increasingly favor single-vendor stacks or abstract storage through virtualization layers to sidestep cross-platform tuning, but doing so limits negotiation leverage and may raise lock-in risk.
*Our forecasts treat driver/restraint impacts as directional, not additive. The impact forecasts reflect baseline growth, mix effects, and variable interactions.
Segment Analysis
By Component: Software Solutions Accelerate Infrastructure Modernization
The Storage Area Network market size for hardware stood at 47.73% of revenue in 2024, yet the software component is accelerating at a 6.33% CAGR. Enterprises prioritize abstraction layers that shield applications from hardware change, automate provisioning, and enforce policies consistently across sites. Software-defined storage repurposes commodity servers into resilient blocks, cutting total cost of ownership by up to 35%. Vendors embed AI operations that forecast capacity hot spots and adjust QoS levels without human intervention. Cloud-subscription pricing aligns budgets with consumption, steering capital-heavy refreshes into predictable operating expenses. In response, established hardware players pre-install advanced licenses on controller shelves, bundling analytics and virtualization add-ons that blur the line between boxes and code.
Services form the third pillar, covering assessment, deployment, support, and managed offerings. As architectures grow in complexity, organizations contract specialist teams to migrate data with zero downtime and maintain multi-platform compliance. The rise of edge clusters and sovereign-cloud deployments further lifts professional-services demand, reinforcing the component’s importance in long-term vendor relationships. Across all categories, the shift toward software orientation redefines competitive advantage, making speed of feature delivery and breadth of API integration decisive buying criteria.


By SAN Type: Hyperscale Architectures Lead While vSAN Disrupts Traditional Models
Hyperscale server SANs controlled 38.94% of the Storage Area Network market share in 2024, reflecting the capacity hunger of cloud providers and web-scale enterprises. These designs anchor petabyte-level clusters on standard x86 nodes with distributed erasure coding that offers linear scalability. Providers stack 3-inch servers ten high, wiring them with 400 Gb/s links to keep GPU farms saturated. Meanwhile, virtual and software-defined SANs grow at 5.98% CAGR as mid-market firms retrofit existing virtualization estates rather than forklift-upgrade proprietary arrays. Such vSANs integrate natively with hypervisors, collapsing compute and storage management into a single console that trims operational drag.
Traditional Fibre Channel SANs remain entrenched for tier-1 transactional systems that demand deterministic performance, yet growth is limited to controller refreshes and incremental capacity. iSCSI SANs find a niche in cost-sensitive deployments where gigabit Ethernet suffices. Over the forecast horizon, the pendulum swings toward converged and hyper-converged topologies that bundle storage, compute, and sometimes networking in modular blocks, enabling rapid scale-out without specialized staff. This realignment channels capital into white-box servers and code rather than monolithic chassis, reinforcing the trend toward commoditized hardware wrapped in orchestrated software layers.
By Technology: Fiber Channel Dominance Faces NVMe-oF Disruption
Fiber Channel technology retained 46.83% of revenue in 2024, a testament to its rock-solid reliability and well-understood zoning protocols. FC’s 64-Gb/s roadmap and deterministic latency lock mission-critical databases and mainframe off-loads into multi-fabric meshes. However, the Storage Area Network market size is tilting toward NVMe-oF, which is growing at 6.31% CAGR as users chase microsecond response times. NVMe-oF enables direct flash access over Ethernet, InfiniBand, or FC transports, ensuring seamless adoption paths. Early deployments reveal 50% latency cuts and 2× throughput for analytics workloads once bottlenecked by SCSI queues.
iSCSI continues to serve smaller environments where 10 or 25 Gb/s Ethernet meets performance targets, while InfiniBand caters to HPC clusters and GPU supernodes that demand maximal bandwidth. Fibre Channel over Ethernet (FCoE) fades as customers either retain pure FC fabrics or leapfrog to Ethernet-based NVMe. Critical to NVMe-oF ascendance is maturing end-to-end compatibility among HBAs, switches, and controller firmware, areas many suppliers address through joint interoperability labs and reference architectures.
By End-User Industry: BFSI Leadership Meets Healthcare Innovation
BFSI retained 28.93% revenue share in 2024, fueled by algorithmic trading, real-time risk analytics, and strict retention mandates. Banks refresh arrays every three years to maintain sub-microsecond latency while compressing footprints to fit dense colocation centers. Healthcare and Life Sciences, progressing at 5.88% CAGR, ingest petabytes of imaging and genomic data that demand high-capacity, secure storage. Genomics pipelines run parallel compute jobs that stream terabyte-scale files, making throughput and encryption must-have features.
IT and Telecom sectors consume large slices of capacity for hosting, IaaS, and 5G core workloads, relying on software-defined SANs that plug into agile DevOps pipelines. Manufacturing leverages ruggedized arrays on shop-floor edge gateways to enable in-line AI inspection and digital twins. Government projects range from smart-city surveillance archiving to defense telemetry, with sovereign-cloud clauses shaping vendor selection. Retail and e-commerce deploy SAN clusters behind personalized recommendation engines, where millisecond delays translate directly to revenue loss during peak shopping events.
Geography Analysis
North America held 39.84% of 2024 revenue, underpinned by mature hyperscale campuses and aggressive AI research funding. U.S. financial institutions pursue ultra-low-latency fabrics for equities trading, while cloud giants pour capital into GPU superclusters that mandate petabyte-class NVMe tiers. Canada’s public-sector modernization and resource-industry digitization further expand regional demand, whereas Mexican manufacturers integrate edge SANs into Industry 4.0 assembly lines that synchronize across USMCA corridors.
Asia-Pacific posts the quickest climb at 6.12% CAGR through 2030, propelled by China’s USD 1.4 trillion digital build-out and India’s booming IT-services export engine. Sovereign-cloud requirements push local vendors to bundle controller firmware audited by state agencies, while foreign suppliers align with joint-venture mandates. Japan advances factory automation integrations that couple NVMe flash with real-time analytics, and South Korea’s telcos adopt compact SAN appliances at 5G edge nodes. ASEAN nations deploy SAN backbones for e-government and fintech accelerators, relying on regional data centers to address low-latency mandates.
Europe maintains steady momentum, leveraging GDPR and NIS2 compliance to justify flash-upgrade cycles that curb power draw by up to 70%. Germany’s automotive and machinery giants mount industrial SAN clusters that feed digital-twin simulations, while France expands sovereign-cloud capacity for health-care and defense programs. The U.K. financial sector keeps investing despite post-Brexit regulatory shifts, demanding cross-border replication to European trading venues. Southern EU economies, including Italy and Spain, modernize public-administration IT, favoring pay-as-you-use subscription models that match fiscal-year budgets

Competitive Landscape
The Storage Area Network market shows moderate concentration. Dell, HPE, and IBM top revenue tables through end-to-end portfolios and global channels, but software-first challengers erode incumbents’ share by decoupling value from proprietary hardware. Pure Storage and Nutanix convert flash innovation and hyper-convergence into rapid bookings. Hyperscale clouds internalize controller design, placing price pressure on OEMs and fast-tracking features like transparent data compression and rack-level analytics.
M&A reshapes the field. Broadcom’s USD 61 billion VMware buy aligns networking silicon with storage virtualization, promising unified stacks that extend from NIC to hypervisor. HPE folded Juniper Networks into a USD 14 billion transaction to fuse AI-driven networking with composable storage. Start-ups specializing in Kubernetes data services secure venture funding, offering cloud-native snapshots that shrug off legacy LUN constructs. Across stages, recurring-revenue subscriptions and fleet-wide telemetry dominate go-to-market discussions, signaling a permanent pivot away from one-time hardware margins.
Vendor differentiation hinges on four levers: software feature velocity, energy-efficiency benchmarks, integrated AI-ops frameworks, and compliance toolkits. Those that excel at ecosystem partnerships, particularly with GPU and CPU accelerator vendors, gain preference among buyers building AI factories. Edge-focused variants with zero-touch provisioning and rugged thermals tackle emerging micro-data-center use cases. In aggregate, the market’s direction favors players that can adapt architectures quickly as media types, network speeds, and regulatory landscapes evolve.
Storage Area Network (SAN) Solutions Industry Leaders
Dell Inc.
Hewlett Packard Enterprise Development LP
IBM Corporation
Cisco Systems, Inc.
NetApp, Inc.
- *Disclaimer: Major Players sorted in no particular order

Recent Industry Developments
- October 2024: Dell Technologies committed USD 2.5 billion to AI-optimized PowerScale storage featuring integrated NVMe-oF, targeting sub-millisecond workloads.
- September 2024: Hewlett Packard Enterprise closed a USD 14 billion Juniper Networks acquisition, creating an end-to-end networking-storage stack for hybrid clouds.
- August 2024: Pure Storage unveiled FlashBlade//S500 delivering 75 PB per rack with 85% lower power draw versus HDD arrays.
- July 2024: NetApp partnered with NVIDIA to integrate ONTAP with DGX systems for generative-AI acceleration.


Global Storage Area Network (SAN) Solutions Market Report Scope
| Hardware |
| Software |
| Services |
| Traditional / Fibre-Channel SAN |
| iSCSI SAN |
| Virtual / Software-Defined SAN (vSAN) |
| Hyperscale Server SAN |
| Enterprise Server SAN |
| Fibre Channel (FC) |
| Fibre Channel over Ethernet (FCoE) |
| InfiniBand |
| iSCSI |
| NVMe over Fabrics (NVMe-oF) |
| Other Technologies |
| Banking, Financial Services and Insurance (BFSI) |
| IT and Telecommunications |
| Government and Public Sector |
| Healthcare and Life Sciences |
| Manufacturing |
| Retail and E-commerce |
| Media and Entertainment |
| Energy and Utilities |
| Other End-User Industries |
| North America | United States | |
| Canada | ||
| Mexico | ||
| South America | Brazil | |
| Argentina | ||
| Rest of South America | ||
| Europe | United Kingdom | |
| Germany | ||
| France | ||
| Italy | ||
| Spain | ||
| Rest of Europe | ||
| Asia-Pacific | China | |
| Japan | ||
| India | ||
| South Korea | ||
| ASEAN | ||
| Rest of Asia-Pacific | ||
| Middle East and Africa | Middle East | Saudi Arabia |
| United Arab Emirates | ||
| Rest of Middle East | ||
| Africa | South Africa | |
| Nigeria | ||
| Rest of Africa | ||
| By Component | Hardware | ||
| Software | |||
| Services | |||
| By SAN Type | Traditional / Fibre-Channel SAN | ||
| iSCSI SAN | |||
| Virtual / Software-Defined SAN (vSAN) | |||
| Hyperscale Server SAN | |||
| Enterprise Server SAN | |||
| By Technology | Fibre Channel (FC) | ||
| Fibre Channel over Ethernet (FCoE) | |||
| InfiniBand | |||
| iSCSI | |||
| NVMe over Fabrics (NVMe-oF) | |||
| Other Technologies | |||
| By End-User Industry | Banking, Financial Services and Insurance (BFSI) | ||
| IT and Telecommunications | |||
| Government and Public Sector | |||
| Healthcare and Life Sciences | |||
| Manufacturing | |||
| Retail and E-commerce | |||
| Media and Entertainment | |||
| Energy and Utilities | |||
| Other End-User Industries | |||
| By Geography | North America | United States | |
| Canada | |||
| Mexico | |||
| South America | Brazil | ||
| Argentina | |||
| Rest of South America | |||
| Europe | United Kingdom | ||
| Germany | |||
| France | |||
| Italy | |||
| Spain | |||
| Rest of Europe | |||
| Asia-Pacific | China | ||
| Japan | |||
| India | |||
| South Korea | |||
| ASEAN | |||
| Rest of Asia-Pacific | |||
| Middle East and Africa | Middle East | Saudi Arabia | |
| United Arab Emirates | |||
| Rest of Middle East | |||
| Africa | South Africa | ||
| Nigeria | |||
| Rest of Africa | |||


Key Questions Answered in the Report
How large is the global Storage Area Network solutions segment today and what growth rate is expected through 2030?
Revenue stands at USD 23.07 billion in 2025 and is projected to reach USD 32.65 billion by 2030 on a 5.31% CAGR trajectory.
Which region shows the fastest expansion for Storage Area Network solutions over the forecast period?
Asia-Pacific leads with a 6.12% CAGR to 2030, supported by China’s digital-infrastructure spending and India’s cloud-services boom.
Why are enterprises moving to NVMe-over-Fabrics for new SAN deployments?
NVMe-oF delivers sub-100 µs latency and doubles throughput versus SCSI-based protocols, enabling faster AI training and real-time analytics workloads.
What portion of global deployments did BFSI organizations command in 2024?
Banking, Financial Services and Insurance entities accounted for 28.93% of total SAN revenue that year.
How do software-defined SANs lower total cost compared with traditional arrays?
Virtualized storage can repurpose commodity servers and trim total cost of ownership by up to 35% while automating policy-driven management.
Page last updated on:


