Scope 3 Emissions Management Software Market Size and Share
Market Overview
| Study Period | 2020 - 2031 |
|---|---|
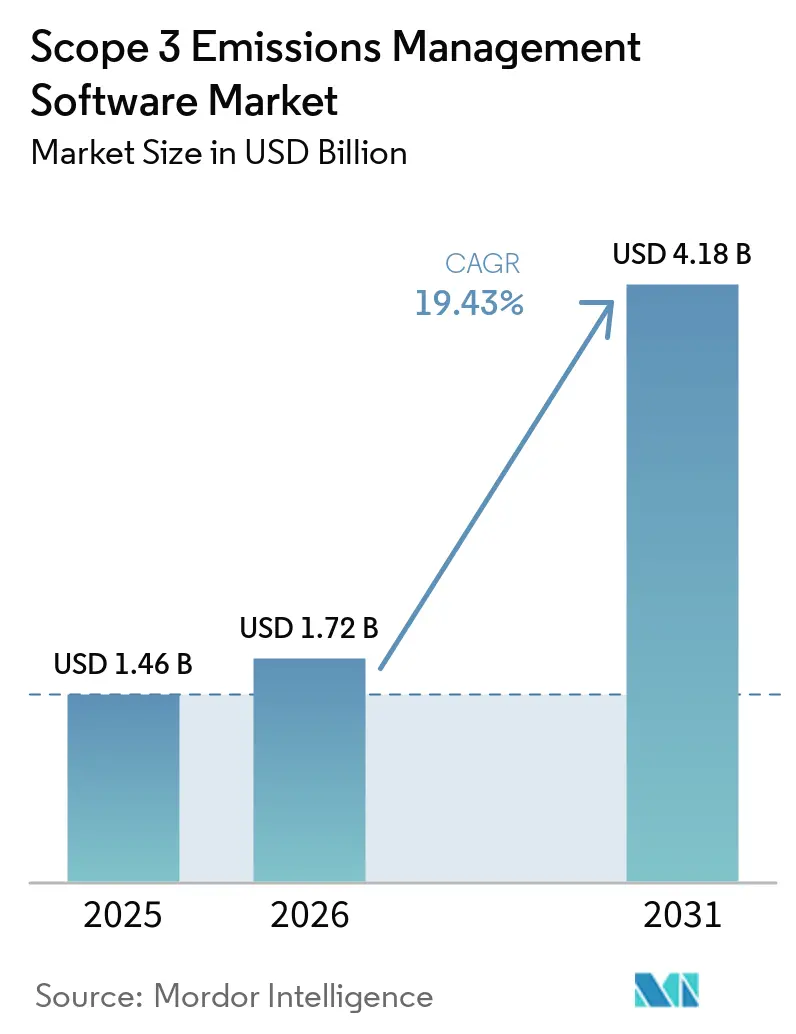
| Market Size (2026) | USD 1.72 Billion |
| Market Size (2031) | USD 4.18 Billion |
| Growth Rate (2026 - 2031) | 19.43% CAGR |
| Fastest Growing Market | Asia-Pacific |
| Largest Market | North America |
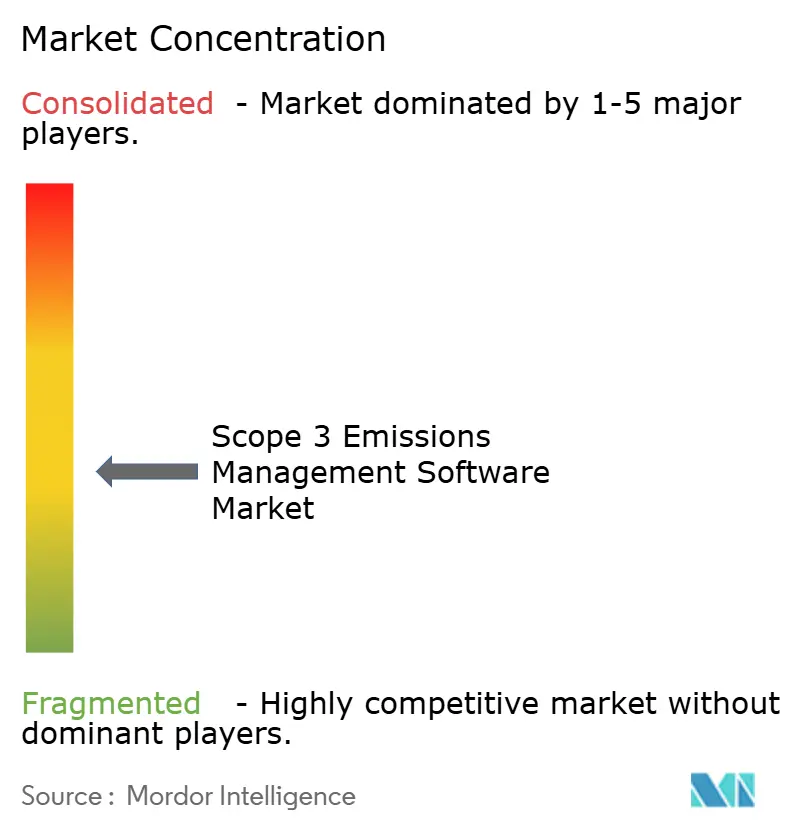
| Market Concentration | Medium |
Major Players *Disclaimer: Major Players sorted in no particular order Image © Mordor Intelligence. Reuse requires attribution under CC BY 4.0. | |
Scope 3 Emissions Management Software Market Analysis by Mordor Intelligence
The Scope 3 Emissions Management Software Market was valued at USD 1.46 billion in 2025 and is estimated to grow from USD 1.72 billion in 2026 to reach USD 4.18 billion by 2031, at a CAGR of 19.43% during 2026-2031. This expansion reflects a structural shift in enterprise sustainability systems, as Scope 3 reporting moved from voluntary disclosure to a regulated, audit-enforceable practice across several major economies simultaneously. The EU kept mandatory Scope 3 disclosure under ESRS E1 for companies with net annual turnover above EUR 450 million (USD 510 million) and more than 1,000 employees, even after the revised framework reduced the number of mandatory data points. California SB 253 extended disclosure pressure to companies with more than USD 1 billion in revenue from California operations, pushing recurring software buying cycles rather than one-time advisory engagements. Demand is also moving toward platforms that combine data lineage, multi-framework reporting, supplier engagement, and decarbonization planning into a single operating layer. Competition is narrowing around deeper platforms, while data quality, supplier participation, and methodology gaps remain the main commercial constraints for providers in the Scope 3 Emissions Management Software Market.
Key Report Takeaways
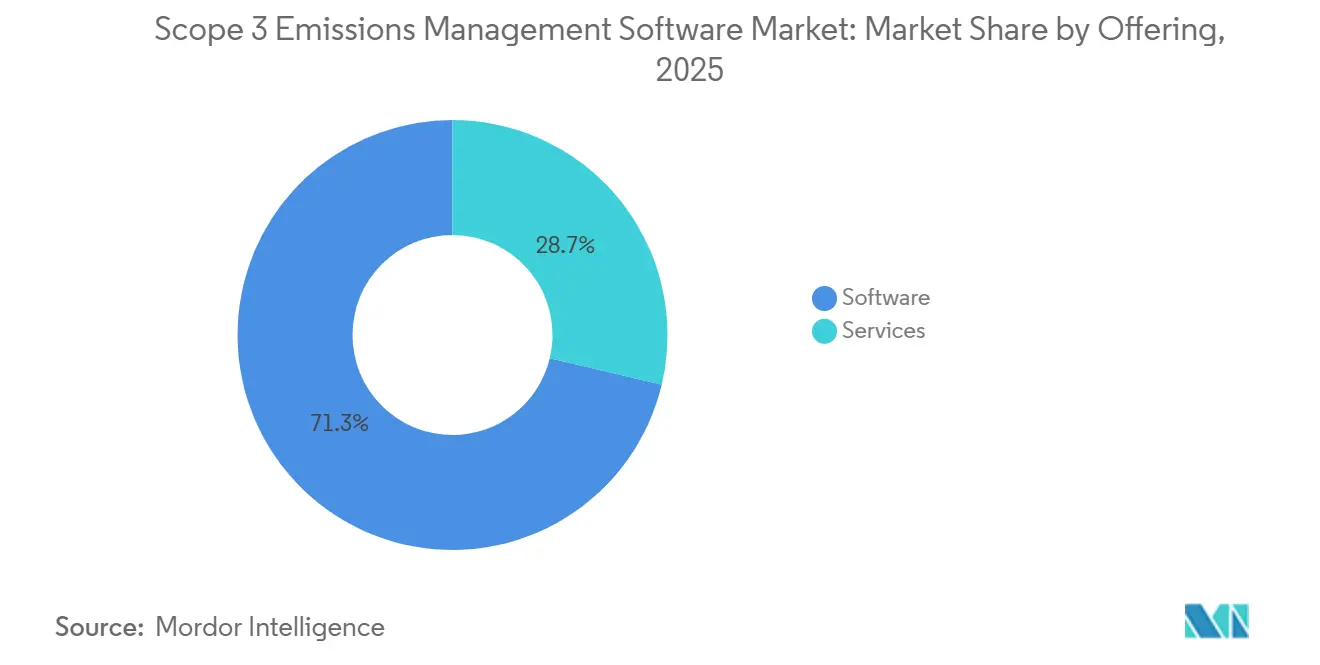
- By offering, software held 71.28% of the Scope 3 Emissions Management Software Market share in 2025, while services are projected to expand at a 21.34% CAGR through 2031.
- By deployment mode, cloud held 66.45% share in 2025, while hybrid is projected to expand at a 22.12% CAGR through 2031.
- By enterprise size, large enterprises accounted for 63.90% of the market share in 2025, while SMEs are projected to grow at a 23.47% CAGR through 2031.
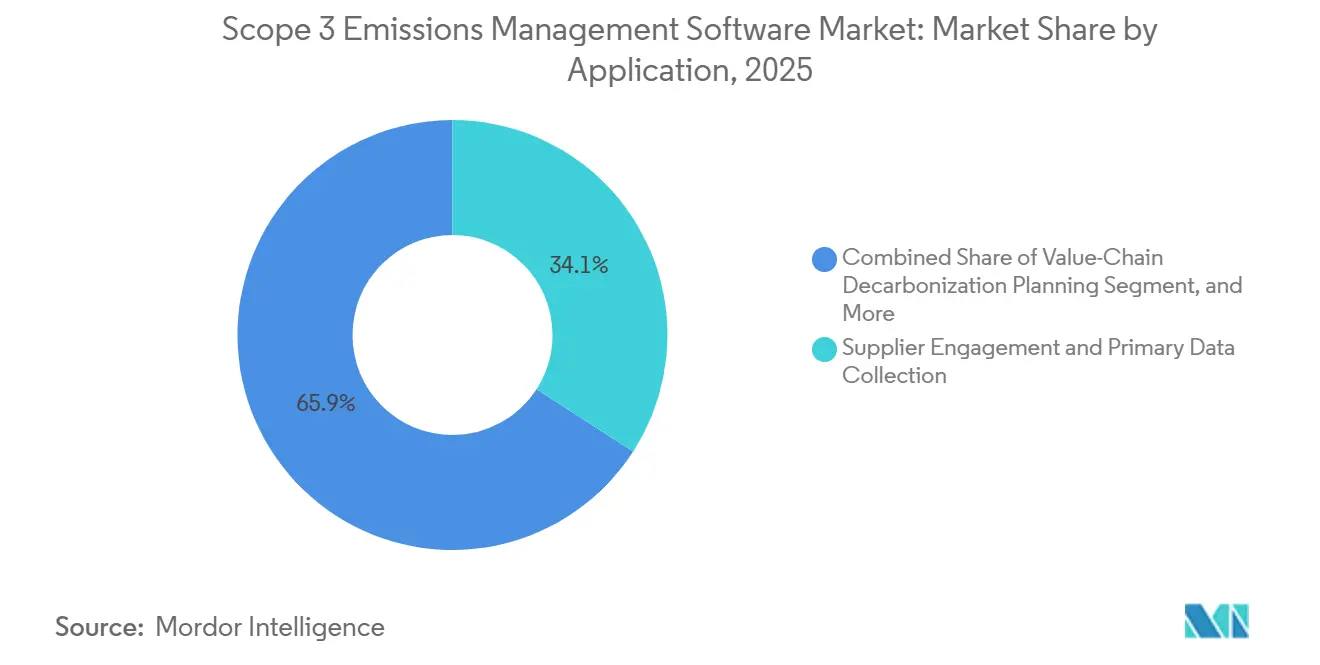
- By application, supplier engagement and primary data collection accounted for 34.12% share in 2025, while value-chain decarbonization planning is projected to expand at a 24.56% CAGR through 2031.
- By end-user industry, manufacturing and industrial held 27.85% share in 2025, while retail and consumer goods are projected to grow at a 20.78% CAGR through 2031.
- By geography, North America held 35.40% share of the Scope 3 Emissions Management Software Market in 2025, while Asia-Pacific is projected to advance at a 25.67% CAGR through 2031.
Note: Market size and forecast figures in this report are generated using Mordor Intelligence’s proprietary estimation framework, updated with the latest available data and insights as of January 2026.
Global Scope 3 Emissions Management Software Market Trends and Insights
Drivers Impact Analysis*
| Driver | (~) % Impact on CAGR Forecast | Geographic Relevance | Impact Timeline |
|---|---|---|---|
| Rising Scope 3 Disclosure Mandates Across Major Economies | +5.2% | Global | Short term (≤ 2 years) |
| Supplier Data Collection Automation Reduces Reporting Friction | +3.8% | Global, APAC core, spill-over to MEA | Medium term (2-4 years) |
| Investor and Customer Pressure on Value-Chain Transparency | +3.2% | North America and EU | Short term (≤ 2 years) |
| AI-Assisted Spend-Based Emissions Estimation Lowers Entry Barriers | +2.5% | Global | Short term (≤ 2 years) |
| Shift Toward Audit-Ready Sustainability Controls and Data Lineage | +1.9% | EU, North America | Medium term (2-4 years) |
| Procurement-Led Decarbonization Programs Expand Software Budgets | +1.4% | North America and EU, spill-over to APAC | Medium term (2-4 years) |
| Source: Mordor Intelligence | |||
Rising Scope 3 Disclosure Mandates Across Major Economies
Mandatory climate reporting rules in Europe and Australia are moving Scope 3 work onto software platforms that can support repeatable controls, audit trails, and assurance-readiness workflows.[1]Normative, “Scope 3 Reporting, CSRD and SBTi Requirements,” Normative, normative.io. In Europe, ESRS E1 continues to keep Scope 3 within the reporting perimeter for in-scope companies, meaning data gathering and calculation logic now carry direct compliance consequences. Wave 1 reporters are preparing disclosures on 2026 data for 2027 publication, which pushes companies to replace ad hoc spreadsheets with systems that can sustain year-after-year reporting cycles. Australia already brought Group 1 entities into mandatory climate disclosure in January 2025 andV. California's SB 253 added a second major compliance channel, because fuller emissions disclosure is expected to alter peer comparisons and investor evaluation inputs. This combination is supporting the Scope 3 Emissions Management Software Market, because buyers increasingly prefer platforms that can absorb rule changes across sectors.[2]Nature Portfolio, “Full Emissions Disclosure Under California Senate Bill 253 Could Change Carbon Evaluations and Redirect Investment,” Communications Sustainability, nature.com.
Supplier Data Collection Automation Reduces Reporting Friction
Supplier data collection has become the operational core of the Scope 3 Emissions Management Software Market, as upstream reporting quality depends on consistent supplier outreach, response tracking, and validation. CDP's supply chain program showed in 2025 that 330 leading corporate buyers requested environmental disclosures from nearly 70,000 suppliers, making manual collection methods hard to sustain at an enterprise scale. The pressure is not limited to sending questionnaires, because response completeness and methodological accuracy now influence whether the data can be used in assurance and target-setting work. CDP also found that 38% of supplier-reported emissions contained methodological errors large enough to change reported values by more than 25%, which raised the value of built-in validation tools. Platforms that combine guided data entry, anomaly flags, reminders, and emission-factor assignment are therefore competing on data usability rather than on collection volume alone. That dynamic continues to drive the Scope 3 Emissions Management Software Market, as buyers pay for lower reporting friction and fewer manual correction loops across supplier networks.
Investor And Customer Pressure On Value-Chain Transparency
Investor and customer expectations now focus on verifiable value-chain data rather than broad sustainability narratives, widening the commercial case for dedicated reporting systems. Research published in Communications Sustainability found that full Scope 3 disclosure under California SB 253 is likely to reshape sector benchmarking inputs and redirect capital toward companies with verifiable company-reported emissions data. This pressure also moves through buyer-supplier relationships, because large corporations request environmental data at scale through structured supply chain disclosure programs. Once supplier disclosure becomes part of commercial qualification, software stops being a narrow compliance tool and becomes part of account retention and customer access. Boards are therefore more willing to fund systems that support repeatable reporting, audit support, and supplier engagement within a single workflow. This broadening of the buyer case is supporting the Scope 3 Emissions Management Software Market, especially where disclosure quality can influence both capital perception and customer continuity.
AI-Assisted Spend-Based Emissions Estimation Lowers Entry Barriers
AI-supported spend classification is reducing the cost and effort required to launch a first Scope 3 inventory, expanding access for companies without mature sustainability teams.[3]Climatiq, “The Science Behind Spend-Based Emission Factors,” Climatiq, climatiq.io. These tools use procurement descriptions, classification logic, and emission-factor mapping to convert raw ledger data into an initial estimate for purchased goods and services far faster than manual workflows. That shorter setup time matters most for SMEs and first-time buyers, because it reduces the internal staffing burden at the point of adoption. Watershed said in April 2026 that its AI data-cleaning agents cut the time to actionable sustainability data by 80% in test deployments, pointing to a clear direction of travel for software design. The same release noted that one enterprise customer reduced a 5-hour data-cleaning task to 20 minutes, demonstrating how workflow automation can improve usability before deeper primary data programs are in place. As a result, the Scope 3 Emissions Management Software Market is gaining from vendors that offer an AI-led entry path and then move customers toward more robust hybrid and primary-data measurement models.
Restraints Impact Analysis*
| Restraint | (~) % Impact on CAGR Forecast | Geographic Relevance | Impact Timeline |
|---|---|---|---|
| Fragmented Supplier Data and Low Primary Data Coverage | -2.8% | Global | Medium term (2-4 years) |
| Methodology Differences Across Frameworks Limit Comparability | -1.9% | Global | Short term (≤ 2 years) |
| Integration Complexity With ERP, Procurement, and ESG Stacks | -1.5% | Large enterprises globally | Medium term (2-4 years) |
| Budget Pressure for Mid-Market Buyers and Long Sales Cycles | -1.2% | North America, EU | Medium term (2-4 years) |
| Source: Mordor Intelligence | |||
Fragmented Supplier Data And Low Primary Data Coverage
Primary data coverage remains thin across many enterprise programs, limiting how far software can improve reporting quality without stronger supplier participation. Sphera found in 2025 that 79% of organizations cited supplier data availability as a top challenge, and 62% cited internal data quality as a major barrier to accurate disclosure.[4]Sphera, “Sphera's 2025 Scope 3 Report Reveals Sustainability Progress Despite Persistent Data Challenges,” Sphera, sphera.com. The same structural weakness persisted in 2026, when Sphera reported that 45% of business leaders had only limited confidence in the accuracy of Scope 3 data, even though 89% planned to expand reporting coverage. This gap matters because greater regulation requires traceable, explainable disclosures, while many datasets still rely on partial supplier responses and estimates. Buyers now expect platforms to show a path from spend-based estimation toward more auditable primary data, and that expectation lengthens implementation work where supplier readiness is weak. Until supplier participation deepens and becomes more consistent, this will continue to slow the Scope 3 Emissions Management Software Market by stretching deployment timelines and limiting assurance confidence.
Methodology Differences Across Frameworks Limit Comparability
The Scope 3 Emissions Management Software Market also faces a comparability problem because different reporting frameworks use different boundaries, assumptions, and materiality rules. Companies often need to address overlapping requirements under the GHG Protocol, CSRD, ISSB-aligned standards, and voluntary disclosure systems, and the calculation logic does not always align across them. When a company builds workflows around one framework, moving to a second reporting format can trigger rework across category definitions, materiality judgments, and documentation practices. That rework increases total ownership costs and makes the buying decision harder for mid-market firms seeking a clear, stable setup path. Vendors are responding by building more modular engines and clearer data lineage features, yet full comparability remains difficult while the frameworks continue to evolve. This friction holds back the Scope 3 Emissions Management Software Market, because software buyers still need people, process, and interpretation work around the platform before disclosures can be relied upon across frameworks.
*Our forecasts treat driver/restraint impacts as directional, not additive. The impact forecasts reflect baseline growth, mix effects, and variable interactions.
Segment Analysis
By Offering: Services Growth Signals A Measurement Maturity Gap
Software accounted for 71.28% of revenue in 2025, while services are projected to grow at a 21.34% CAGR through 2031 in the Scope 3 Emissions Management Software Market. This mix reflects the central role of purpose-built platforms that bring together calculation logic, disclosure templates, workflow controls, and supplier engagement tools into a single system. Cloud-delivered software remains the core delivery model in this segment, as buyers want regulatory updates and method changes reflected without long internal IT cycles. At the same time, implementation work often becomes more difficult after the license is signed, because emissions boundaries, supplier data quality, and framework alignment still require manual configuration and review.
That service demand is tied to operational readiness rather than to weak software demand, because many companies can buy the tool faster than they can organize the data needed to use it well. Sphera reported in 2026 that 89% of companies planned to expand Scope 3 reporting, while 45% still had only limited confidence in data accuracy, which leaves clear room for managed support and advisory work. Vendors that package implementation, data consulting, and assurance-readiness support with the platform are therefore extending customer value beyond the initial subscription. Pure SaaS providers face pressure to add service capacity directly or work with specialist partners if they want to stay relevant in larger and more regulated buying cycles.


By Deployment Mode: Hybrid Architecture Fits Enterprise Data Reality
Cloud held 66.45% share in 2025, while hybrid is projected to expand at a 22.12% CAGR through 2031 in the Scope 3 Emissions Management Software Market. Cloud remains the leading model because it lowers maintenance burdens, speeds feature updates, and fits well with modern finance and procurement systems. Even so, the most detailed activity data often resides in ERP transaction records, transport systems, and procurement databases that many enterprises still run in on-premises or private cloud environments. That is why hybrid architecture is gaining momentum, because it lets companies keep sensitive operational records in established systems while using cloud analytics and reporting layers on top.
SAP's 2026 product updates showed how vendors are adapting to this need, with extended ERP-centric transport footprint calculations and additional country-specific supply chain emissions datasets inside the workflow. These features matter because hybrid deployment supports a clearer chain of custody from the source transaction to the reported footprint, which is increasingly valuable for controls and audit trails. Standalone on-premises models are losing share, yet the underlying infrastructure remains critical in many large-company architectures. Vendors that cannot connect to that environment risk losing enterprise deals where data lineage, sovereignty, and integration depth matter as much as reporting speed.
By Enterprise Size: SME Adoption Rises Through Supply-Chain Pull
Large enterprises held 63.90% share in 2025, while SMEs are projected to grow at a 23.47% CAGR through 2031 in the Scope 3 Emissions Management Software Market. Large companies entered first because they faced complex supply chains, board-level climate targets, and early regulatory exposure across Europe and North America. SMEs are now moving into the buying funnel because large customers are requesting structured emissions data as part of ongoing commercial relationships. This shifts the demand pattern from top-down compliance to value-chain participation, broadening the addressable base beyond the initial wave of regulated multinationals.
Research published in the Journal of Industrial Ecology in 2026 found that financial transaction data can yield SME-level Scope 3 estimates with statistical confidence, supporting lighter onboarding models for firms without dedicated sustainability teams. That research supports the rise of low-friction tools that let smaller suppliers produce a credible first inventory before building deeper primary-data capabilities. Vendors that offer supplier-facing entry products at low or no cost are building an acquisition funnel that can convert into paid platform users as reporting demands intensify. This shift is important for the Scope 3 Emissions Management Software Market because long-term volume growth is likely to come from the supplier base rather than from the first tier of large corporate reporters alone.
By Application: Supplier Data Work Leads While Planning Gains Speed
Supplier engagement and primary data collection held 34.12% of the Scope 3 Emissions Management Software Market size in 2025, while value-chain decarbonization planning is projected to expand at a 24.56% CAGR through 2031. Upstream data collection remains the largest application because no credible Scope 3 program can progress far without supplier inputs, follow-up cycles, and validation checks. The challenge is that raw supplier responses do not automatically produce decision-grade reporting, which is why validation logic has become as important as collection capacity. Procurement and sustainability teams increasingly want software that spans data intake, scenario planning, supplier prioritization, and reduction pathways within a single workflow.
CDP found in 2025 that 38% of supplier-reported emissions contained methodological errors large enough to shift reported values by more than 25%, underscoring the importance of anomaly detection and guided review tools. That is why value-chain decarbonization planning is growing faster, because companies now want to convert measurement into action rather than stopping at disclosure. At the same time, accounting, disclosure, governance, and assurance functions are benefiting from the move toward more formal reporting expectations under regulated frameworks. Together, these patterns show a Scope 3 Emissions Management Software Market that is shifting from footprint visibility alone toward coordinated planning, controls, and supplier improvement work.
By End-User Industry: Manufacturing Leads While Retail Builds Pace
Manufacturing and industrial held 27.85% share in 2025, while retail and consumer goods are projected to grow at a 20.78% CAGR through 2031 in the Scope 3 Emissions Management Software Market. Manufacturing leads because its supply chains span large volumes of purchased goods, complex transport, and downstream product-use impacts that are hard to capture with generic estimates. Research in the International Journal of Advanced Manufacturing Technology showed in 2025 that transportation-related Scope 3 emissions in manufacturing supply chains are highly sensitive to vehicle type, load capacity, and distance. That finding underscores the need for granular, activity-based data, especially when buyers want to move beyond broad, spend-based proxies.
Retail and consumer goods are growing faster because product-level carbon communication, supplier requests, and brand commitments are pulling emissions data deeper into sourcing and merchandising processes. BFSI remains a distinct demand pocket because financed emissions introduce a more complex category structure than standard corporate procurement footprints. Energy, utilities, IT, telecom, and transportation buyers also need vertical customization because the data sources and calculation logic differ by operating model. Healthcare and the public sector are still earlier in the adoption cycle, yet they are entering more structured procurement as supply-chain due diligence and disclosure expectations become more formal.
Geography Analysis
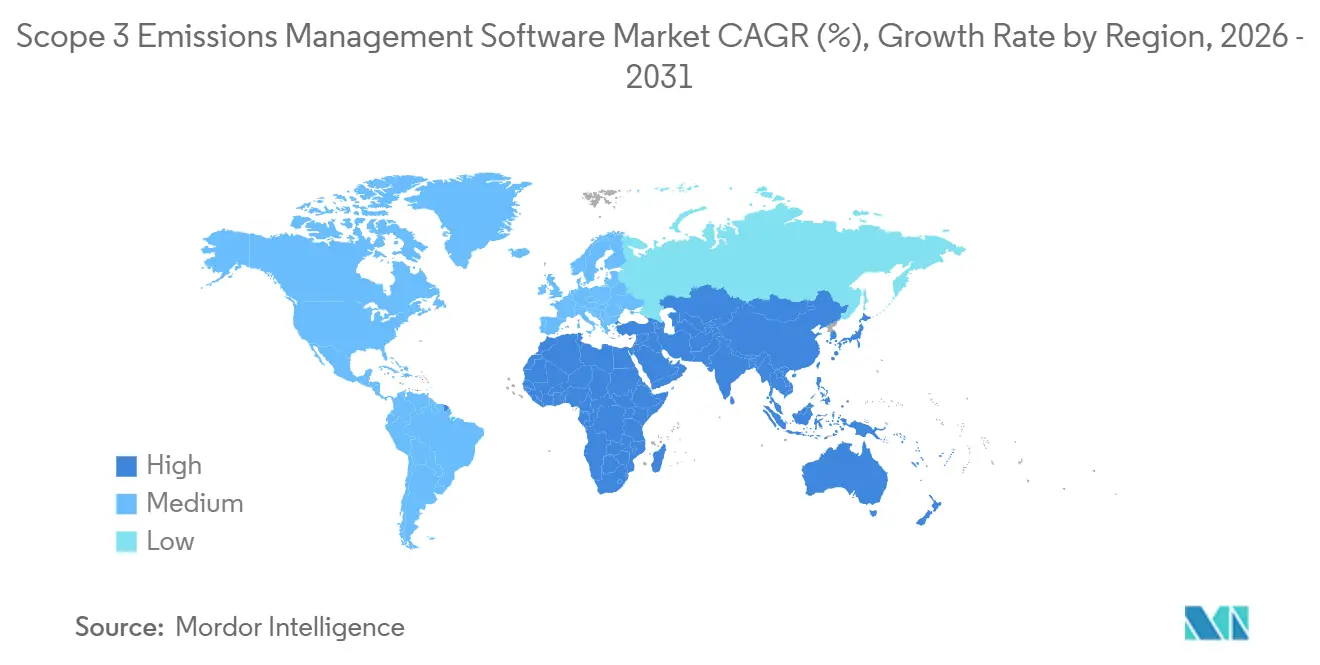
North America accounted for 35.40% of the Scope 3 Emissions Management Software Market size in 2025. The United States drove most regional demand because California's SB 253 and related climate disclosure rules pushed large companies toward more formal Scope 3 reporting systems. This changed procurement priorities from one-off measurement exercises to platforms that can support recurring data collection, documentation, and external review. The regional buying pattern also reflects strong demand for AI-supported workflows, because enterprises want faster cleanup, scenario modeling, and integration with finance and procurement data. That environment favors vendors that already connect to enterprise operating systems and can reduce switching friction inside large accounts.
Europe remained the second-largest geography in the Scope 3 Emissions Management Software Market. CSRD kept Scope 3 disclosure within ESRS E1 for in-scope reporters, which continues to anchor demand for auditable reporting workflows across the region. Wave 1 companies are preparing to report on 2026 data in 2027, while the Omnibus changes delayed later reporting waves, shifting the timing but not removing the need for software investment. The European Commission's value chain cap also limits how much information large reporters can require from smaller suppliers, which affects how deeply supplier-engagement tools can push for primary upstream data. Germany remains a strong demand center because of its industrial base, while France contributes a dense vendor ecosystem that supports regional innovation.
Asia-Pacific is projected to grow at a 25.67% CAGR through 2031, making it the fastest-growing region in the Scope 3 Emissions Management Software Market. Australia required Group 1 entities to begin mandatory climate disclosures in January 2025 and extended the framework to Group 2 entities from July 2026, with Scope 3 included in scope. Export-oriented supply chains are also reinforcing demand across the region, as suppliers increasingly need carbon data to meet buyer requests and cross-border reporting requirements. South America, the Middle East, and Africa remain earlier-stage markets, with adoption led mainly by multinational reporting requirements, large domestic enterprises, and cross-border supply-chain participation.

Competitive Landscape
The Scope 3 Emissions Management Software Market remained moderately fragmented in 2026, with purpose-built specialists and enterprise software providers serving different buyer needs across the same demand pool. Watershed, Persefoni, Sweep, Altruistiq, Normative, and Plan A competed on measurement depth, supplier engagement, and workflow speed, while larger platform players competed on integration reach and installed account access. SAP, Salesforce, IBM, Microsoft, and Wolters Kluwer used broader ERP, CRM, and ESG software positions to extend into Scope 3 functionality. SAP strengthened its position through Sustainability Data Exchange and PACT-based interoperability, which standardize carbon data exchange across business relationships and give enterprise buyers a clearer path to structured data sharing. This standards-led approach matters because large buyers increasingly want a single operating layer that connects procurement, supplier data exchange, and reporting controls within the Scope 3 Emissions Management Software Market.
Product development in 2026 centered on AI agents that shorten data preparation, analysis, and scenario modeling cycles. SAP said its Footprint Optimization Agent would reduce carbon scenario simulation time from 1 full workday to 20 minutes and that the new sustainability agents would be generally available by end-2026. Watershed said its AI agents cut the time to actionable sustainability data by 80% in test deployments and reduced the time for one enterprise data-cleaning project from 5 hours to 20 minutes. Persefoni launched its Analytics Agent in May 2026 to enable teams to interact with emissions data through plain-language prompts within the carbon accounting platform. These moves show that competition is shifting from basic footprint calculation toward faster workflow execution, clearer analysis, and more embedded decision support in the Scope 3 Emissions Management Software Market.
Consolidation also accelerated as vendors sought stronger platform stickiness and broader ecosystem reach. Diligent transitioned its carbon accounting clients to Persefoni and took an equity stake in October 2025, which narrowed the pool of independent carbon accounting competitors. EcoVadis and Workiva announced a partnership in May 2026 to connect supplier-level carbon data with disclosure workflows, which highlights the move toward interoperable ecosystem models rather than isolated point tools. The Scope 3 Emissions Management Software Market is therefore moving toward a hub-and-spoke structure, where a smaller group of calculation-and-disclosure platforms act as system-of-record layers while specialized data, validation, and advisory tools connect around them.
Scope 3 Emissions Management Software Industry Leaders
Watershed
Persefoni, LLC
Sweep SAS
Emitwise Limited
Sphera Solutions, Inc.
- *Disclaimer: Major Players sorted in no particular order

Recent Industry Developments
- May 2026: EcoVadis and Workiva announced a strategic partnership to connect EcoVadis's Carbon Data Network directly with Workiva Carbon, enabling mutual customers to move from industry-average emission factors to granular, audit-ready supplier-level Scope 3 data. The partnership positions EcoVadis as the primary data engine for supplier emissions and Workiva as the calculation and disclosure hub, addressing a critical gap between supplier engagement and board-ready reporting.
- May 2026: SAP announced that new sustainability AI agents, including a Footprint Optimization Agent that reduces Scope 3 scenario simulation time from approximately 1 full workday to around 20 minutes, a Sustainability Regulatory Readiness Agent, and a Packaging Compliance Agent, will be generally available by end-2026. These agents are part of SAP's Autonomous Enterprise strategy, embedding sustainability policy execution directly within enterprise workflows.
- May 2026: Persefoni unveiled the Persefoni Analytics Agent, an agentic AI feature embedded in its platform that enables sustainability teams to interact with emissions data using plain-language prompts, generate tailored analyses, and respond to stakeholder queries without leaving the carbon accounting system of record. Persefoni has served more than 500 enterprise customers globally and supported more than 9,000 organizations, and has raised USD 179 million from institutional investors, including TPG Rise.
- April 2026: Watershed launched AI agents for data cleaning and analysis at San Francisco Climate Week, reporting that test deployments cut time to actionable sustainability data by 80% and reduced a 5-hour data-cleaning project for 1 enterprise client to 20 minutes. Watershed also launched an 8-week AI Fellowship for sustainability leaders and announced the beta launch of AI-powered utility bill ingestion.


Global Scope 3 Emissions Management Software Market Report Scope
The Scope 3 Emissions Management Software market comprises digital platforms and services that measure, manage, and report indirect greenhouse gas emissions across the value chain, in alignment with global sustainability and ESG standards. These solutions provide capabilities such as Scope 3 accounting and disclosure, supplier engagement with primary data collection, value-chain decarbonization planning, and assurance, governance, and compliance management.
The Scope 3 Emissions Management Software market report is segmented by Offering (Software, and Services), Deployment Mode (Cloud-Based, On-Premises, and Hybrid), Enterprise Size (Large Enterprises, and Small and Medium Enterprises), Application (Scope 3 Accounting and Disclosure, Supplier Engagement and Primary Data Collection, Value-Chain Decarbonization Planning, Assurance, Governance and Compliance), End-user Industry (Manufacturing and Industrial, Retail and Consumer Goods, Energy, Utilities and Natural Resources, Transportation and Logistics, BFSI, IT and Telecom, Healthcare and Life Sciences, Government and Public Sector, and Other End-user Industries), and Geography (North America, South America, Europe, Asia-Pacific, Middle East, and Africa). The Market Forecasts are Provided in Terms of Value (USD).
| Software |
| Services |
| Cloud-Based |
| On-Premises |
| Hybrid |
| Large Enterprises |
| Small and Medium Enterprises |
| Scope 3 Accounting and Disclosure |
| Supplier Engagement and Primary Data Collection |
| Value-Chain Decarbonization Planning |
| Assurance, Governance and Compliance |
| Manufacturing and Industrial |
| Retail and Consumer Goods |
| Energy, Utilities and Natural Resources |
| Transportation and Logistics |
| BFSI |
| IT and Telecom |
| Healthcare and Life Sciences |
| Government and Public Sector |
| Other End-user Industries |
| North America | United States |
| Canada | |
| Mexico | |
| South America | Brazil |
| Argentina | |
| Rest of South America | |
| Europe | Germany |
| United Kingdom | |
| France | |
| Italy | |
| Spain | |
| Russia | |
| Netherlands | |
| Rest of Europe | |
| Asia-Pacific | China |
| Japan | |
| India | |
| South Korea | |
| Australia and New Zealand | |
| Rest of Asia-Pacific | |
| Middle East | Saudi Arabia |
| United Arab Emirates | |
| Rest of Middle East | |
| Africa | South Africa |
| Nigeria | |
| Rest of Africa |
| By Offering | Software | |
| Services | ||
| By Deployment Mode | Cloud-Based | |
| On-Premises | ||
| Hybrid | ||
| By Enterprise Size | Large Enterprises | |
| Small and Medium Enterprises | ||
| By Application | Scope 3 Accounting and Disclosure | |
| Supplier Engagement and Primary Data Collection | ||
| Value-Chain Decarbonization Planning | ||
| Assurance, Governance and Compliance | ||
| By End-user Industry | Manufacturing and Industrial | |
| Retail and Consumer Goods | ||
| Energy, Utilities and Natural Resources | ||
| Transportation and Logistics | ||
| BFSI | ||
| IT and Telecom | ||
| Healthcare and Life Sciences | ||
| Government and Public Sector | ||
| Other End-user Industries | ||
| By Geography | North America | United States |
| Canada | ||
| Mexico | ||
| South America | Brazil | |
| Argentina | ||
| Rest of South America | ||
| Europe | Germany | |
| United Kingdom | ||
| France | ||
| Italy | ||
| Spain | ||
| Russia | ||
| Netherlands | ||
| Rest of Europe | ||
| Asia-Pacific | China | |
| Japan | ||
| India | ||
| South Korea | ||
| Australia and New Zealand | ||
| Rest of Asia-Pacific | ||
| Middle East | Saudi Arabia | |
| United Arab Emirates | ||
| Rest of Middle East | ||
| Africa | South Africa | |
| Nigeria | ||
| Rest of Africa | ||


Key Questions Answered in the Report
What is the current size of the scope 3 emissions management software space?
The Scope 3 Emissions Management Software Market was valued at USD 1.46 billion in 2025, is estimated at USD 1.72 billion in 2026, and is projected to reach USD 4.18 billion by 2031 at a 19.43% CAGR.
Why is demand rising so quickly for these platforms?
Growth is being driven by mandatory disclosure rules, stronger assurance needs, and customer and investor pressure for verifiable value-chain emissions data.
Which offering category leads revenue today?
Software led with a 71.28% share in 2025, while services are growing faster at a 21.34% CAGR as buyers need implementation and data-quality support.
Why are hybrid deployments expanding faster than on-premises setups?
Hybrid deployment is projected to grow at a 22.12% CAGR because many companies still keep core ERP and procurement data in existing systems while using cloud analytics and reporting layers.
Which application area is attracting the fastest expansion?
Value-chain decarbonization planning is the fastest-growing application at a 24.56% CAGR, while supplier engagement and primary data collection remained the largest application with 34.12% share in 2025.
Which region is growing the fastest through 2031?
Asia-Pacific is the fastest-growing region with a 25.67% CAGR, supported by expanding mandatory climate disclosure requirements and export-driven supplier reporting pressure.
Page last updated on:


