
Scope 3 Supply Chain Emissions Transparency Platform Market Size and Share
Market Overview
| Study Period | 2020 - 2031 |
|---|---|
| Market Size (2026) | USD 2.12 Billion |
| Market Size (2031) | USD 5.01 Billion |
| Growth Rate (2026 - 2031) | 18.77 % |
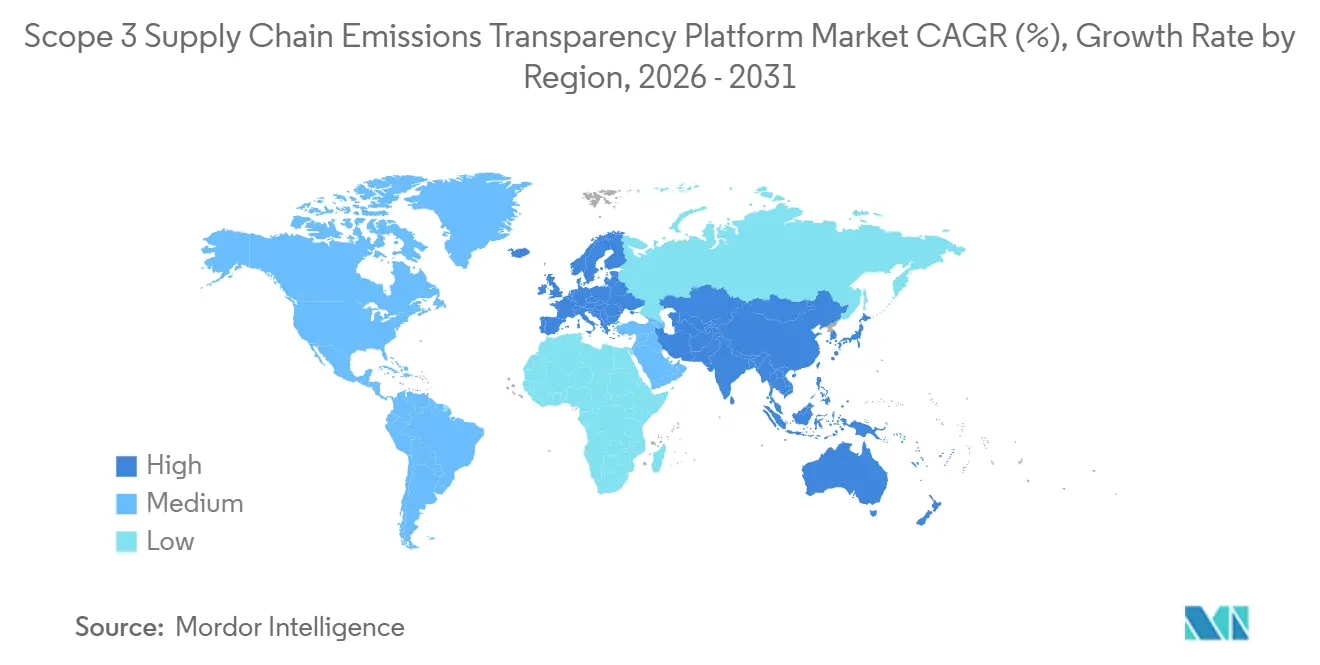
| Fastest Growing Market | Asia-Pacific |
| Largest Market | Europe |
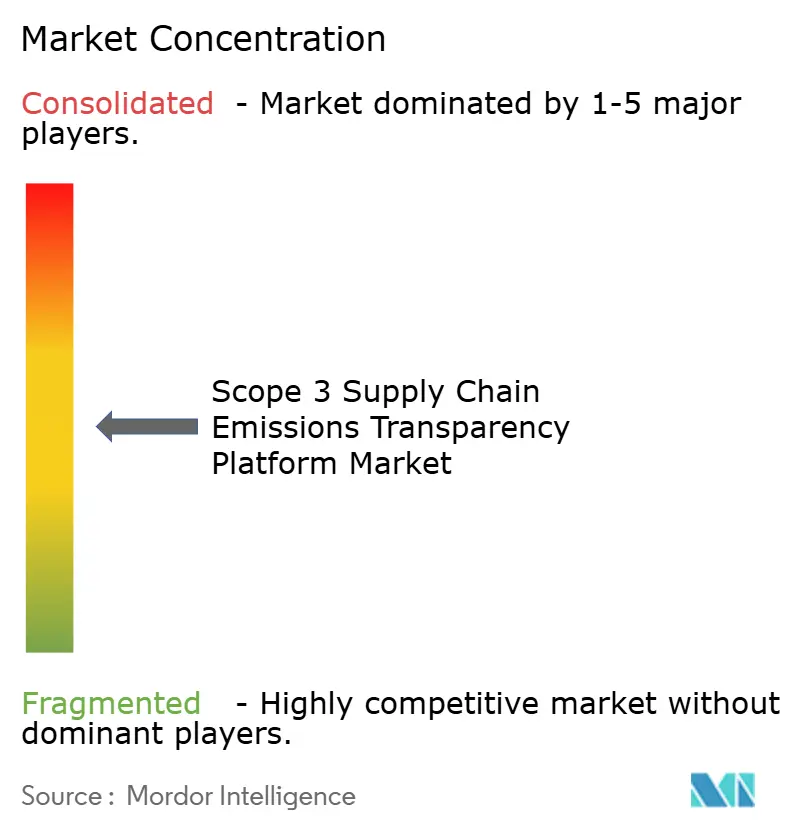
| Market Concentration | Medium |
Major Players *Disclaimer: Major Players sorted in no particular order Image © Mordor Intelligence. Reuse requires attribution under CC BY 4.0. | |
Scope 3 Supply Chain Emissions Transparency Platform Market Analysis by Mordor Intelligence
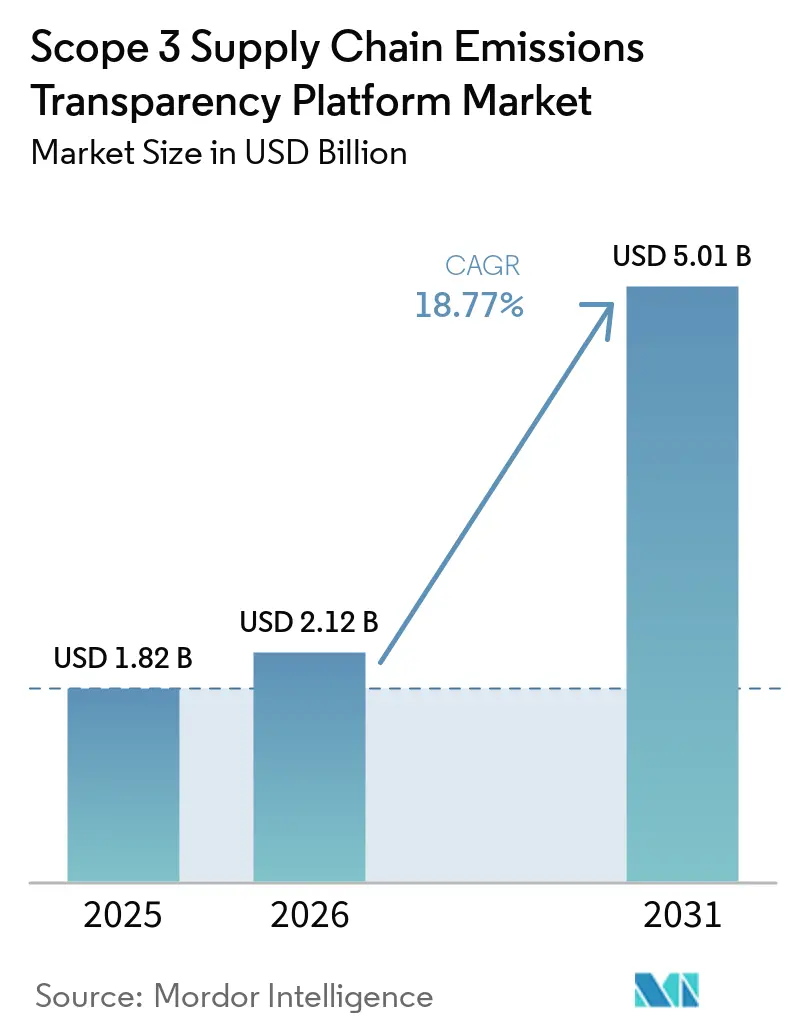
The scope 3 supply chain emissions transparency platform market size was valued at USD 1.82 billion in 2025 and estimated to grow from USD 2.12 billion in 2026 to reach USD 5.01 billion by 2031, at a CAGR of 18.77% during the forecast period (2026-2031). Growth in the scope 3 supply chain emissions transparency platform market reflects a clear move away from consultancy-heavy estimation models toward software that can collect supplier activity data, apply verified factors, and produce reporting outputs in a single workflow. Demand is being reinforced by rising pressure to make climate disclosures more consistent, more reviewable, and easier to defend during assurance processes. The market is also being shaped by a stronger preference for platforms that can connect with procurement and finance systems, because buyers want carbon data to sit closer to purchasing decisions. Vendor competition is shifting toward data accuracy, supplier participation, and system interoperability rather than solely on basic emissions calculation. This keeps the scope 3 supply chain emissions transparency platform market on a path where compliance demand, product depth, and supplier network quality all matter simultaneously.
Key Report Takeaways
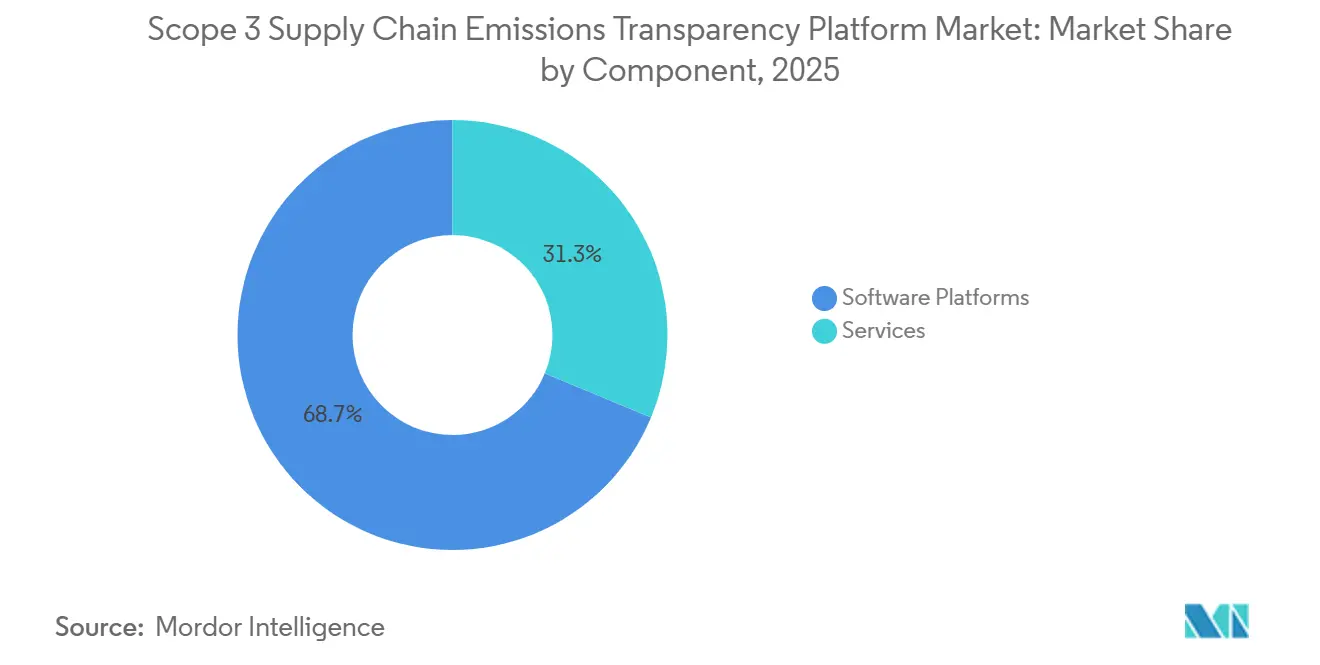
- By component, software platforms accounted for 68.74% of revenue in 2025 in the scope 3 supply chain emissions transparency platform market, while services remained the fastest-growing support layer over the forecast period.
- By deployment mode, cloud accounted for 65.12% of revenue in 2025, while hybrid is projected to expand at a 18.92% CAGR through 2031.
- By enterprise size, large enterprises held 63.45% of revenue in 2025, while SMEs are projected to expand at a 18.85% CAGR through 2031.
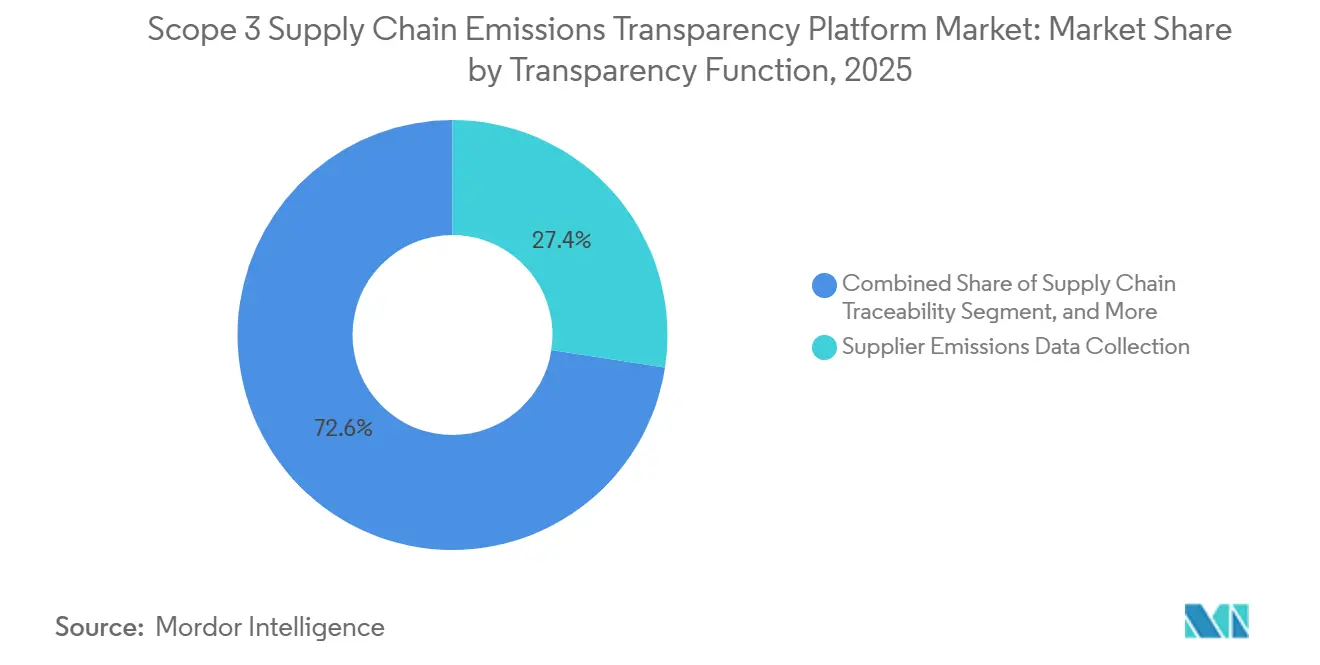
- By transparency function, supplier emissions data collection accounted for 27.41% of revenue in 2025, while supply chain traceability is projected to expand at a 19.12% CAGR through 2031.
- By end-use industry, manufacturing held 28.63% of revenue in 2025, while retail and e-commerce remained the fastest-growing end-use segment over the forecast period.
- By geography, Europe led the market in 2025, while Asia-Pacific is projected to expand at a 19.25% CAGR through 2031.
Note: Market size and forecast figures in this report are generated using Mordor Intelligence’s proprietary estimation framework, updated with the latest available data and insights as of January 2026.
Market Trends and Insights
Drivers Impact Analysis of Scope 3 Supply Chain Emissions Transparency Platform Market*
| Driver | (~) % Impact on CAGR Forecast | Geographic Relevance | Impact Timeline |
|---|---|---|---|
| Expanding Regulatory Disclosure Mandates | +5.2% | Global, with strongest effect in Europe and large multinational reporting networks | Short term (≤ 2 years) |
| Shift From Spend-Based Estimates to Supplier-Specific Data | +3.8% | Global, with strong pull from cross-border manufacturing and retail supply chains | Medium term (2-4 years) |
| AI-Enabled Factor Matching and Anomaly Detection | +3.2% | Global, with faster uptake in large enterprise deployments | Short term (≤ 2 years) |
| Procurement Integration into ERP and P2P Workflows | +2.9% | Global, led by companies with mature procurement and finance systems | Medium term (2-4 years) |
| Supplier Engagement and Capacity Building Workflows | +2.5% | Global, especially relevant where supplier bases are broad and fragmented | Medium term (2-4 years) |
| Product and SKU-Level Carbon Traceability Demand | +2.1% | Europe first, with spillover into export-oriented manufacturing hubs | Medium term (2-4 years) |
| Source: Mordor Intelligence | |||
Expanding Regulatory Disclosure Mandates
Mandatory disclosure rules are now a direct buying trigger for the scope 3 supply chain emissions transparency platform market because large companies need systems that can gather, structure, and document value chain data in a repeatable way. The Corporate Sustainability Reporting Directive keeps Scope 3 reporting at the center of climate disclosure for large companies, and the Omnibus I changes still preserve the need to collect value chain information within a defined reporting framework.[1] This matters because the reporting challenge is no longer limited to calculating emissions once a year; it now involves maintaining evidence trails that can withstand assurance requirements and internal review. The European Commission also clarified how the value chain cap should be applied, underscoring the need for platforms that can collect the right supplier data without crossing the new legal boundaries imposed on reporting companies. As a result, the scope 3 supply chain emissions transparency platform market is benefiting from a compliance cycle that favors systems with strong supplier workflows, traceable calculations, and documentation controls.
Shift From Spend-Based Estimates to Supplier-Specific Data
The scope 3 supply chain emissions transparency platform market is also advancing, as companies are under pressure to replace broad, spend-based proxies with supplier-specific information wherever possible. MIT Sloan and CSCMP found that supplier data availability was the single largest obstacle to accurate Scope 3 measurement for many organizations, which explains why buyers are looking for platforms that make supplier outreach and data exchange easier.[2] This shift changes the product requirement because enterprises now need supplier portals, product carbon footprint workflows, and structured templates rather than standalone calculation files. WBCSD PACT Methodology v3.0 supports this move by providing trading partners with a common basis for exchanging product carbon footprint data across systems, thereby making automated data transfer at scale more practical. Once buyers start requesting primary data within normal sourcing and reporting cycles, suppliers that can respond in a standard format are easier to retain and compare across product categories. That is why the scope 3 supply chain emissions transparency platform market is expanding beyond carbon accounting alone to include supplier participation and product-level data readiness.
AI-Enabled Factor Matching and Anomaly Detection
AI is becoming an important growth lever for transparency platforms focused on scope 3 supply chain emissions, as it reduces the manual work required to match procurement records with emissions factors. SINAI Technologies said its AI Emissions Match capability can classify columns, interpret units, and map line items to more than 100,000 built-in factors and millions of supplier-specific factors, demonstrating how vendors are using automation to handle complex data loads.[3] This matters in large organizations because supplier files, purchasing records, and product data often arrive in inconsistent formats that are difficult to process manually. Sphera reported in 2026 that 45% of surveyed leaders worried data quality was limiting the usefulness of AI-driven analysis, so the winning platforms are those that pair automation with controls that improve trust in the outputs. Anomaly detection is therefore becoming as important as factor matching because buyers want systems that can flag outliers before the data enters an audit trail. This is pushing the scope 3 supply chain emissions transparency platform market toward tools that support continuous checking rather than periodic reporting.
Procurement Integration Into ERP And P2P Workflows
The scope 3 supply chain emissions transparency platform market is deepening as emissions workflows move closer to ERP and procure-to-pay systems. SAP added ERP-centered transport footprint calculation in late 2025, and then expanded Sustainability Footprint Management in early 2026 with country-specific factors from Unibloom, demonstrating how major vendors are embedding carbon logic into core transaction environments. IBM Envizi also positions supply chain intelligence around direct financial data integration and allows different calculation methods to be applied at the transaction level, reflecting the same market trend toward process integration. This matters because procurement teams increasingly want to compare suppliers on carbon intensity inside the same workflow used for cost and sourcing decisions. As a result, vendors that sit outside normal enterprise systems face a harder sales case unless they can connect deeply and reliably to procurement data. In practical terms, the scope 3 supply chain emissions transparency platform market rewards software that reduces duplicate work across sustainability, finance, and procurement teams.
Restraints Impact Analysis of Scope 3 Supply Chain Emissions Transparency Platform Market*
| Restraint | (~) % Impact on CAGR Forecast | Geographic Relevance | Impact Timeline |
|---|---|---|---|
| Poor Multi-Tier Data Quality And Traceability | -2.3% | Global, with stronger pressure in long and fragmented supply chains | Medium term (2-4 years) |
| High Change Management And Implementation Cost | -1.8% | Global, with heavier burden on mid-sized firms and suppliers | Medium term (2-4 years) |
| Methodology Fragmentation Across Frameworks | -1.3% | Global, especially where firms report across multiple standards | Long term (≥ 4 years) |
| Supplier Privacy, NDAs, And Antitrust Friction | -0.9% | Global, most relevant in sensitive manufacturing and cross-border data exchange | Long term (≥ 4 years) |
| Source: Mordor Intelligence | |||
Poor Multi-Tier Data Quality and Traceability
Poor data quality across multi-tier supply chains remains the largest operational restraint on the scope 3 supply chain emissions transparency platform market because companies still struggle to move beyond direct supplier relationships. SBTi noted that supplier response rates in supply chain disclosure programs often remain limited without active engagement, leading to a decline in the availability of primary data as reporting companies move deeper into the supply chain.[4] A 2026 academic paper on multi-tier Scope 3 accounting also noted that the GHG Protocol provides conceptual guidance but does not prescribe algorithms for tracing complex upstream relationships, leaving vendors to develop their own methods. That weakens comparability because two platforms may handle supplier gaps, shared inputs, and circular dependencies differently. The commercial effect is that buyers want systems that can mix primary data, partial estimates, and fallback methods without breaking reporting consistency. Even when demand stays strong, the scope 3 supply chain emissions transparency platform market cannot fully convert that demand into usable deployments unless supplier participation and traceability improve.
High Change Management and Implementation Cost
Implementation costs are restraining the scope 3 supply chain emissions transparency platform market, as the work extends well beyond software purchase. MIT Sloan and CSCMP found that high software and tool costs were a barrier for many organizations, while limited internal expertise was also a major constraint, which means capability gaps often rise alongside budget pressure rather than separately from it. Companies often need to align methodology choices, connect ERP data, prepare suppliers, and build documentation that can support assurance, all of which stretches project timelines. European reporting rules are also increasing the need for controlled data trails, which makes rushed or lightly governed deployments less acceptable for in-scope firms. SAP and IBM examples show why this cost can grow quickly: once carbon workflows are tied into core procurement and finance systems, the implementation effort becomes broader than a typical sustainability software rollout. This keeps the scope 3 supply chain emissions transparency platform market growing, but it also favors vendors that can shorten deployment time and reduce the amount of custom work required.
*Our forecasts treat driver/restraint impacts as directional, not additive. The impact forecasts reflect baseline growth, mix effects, and variable interactions.
Scope 3 Supply Chain Emissions Transparency Platform Market Segment Analysis
By Component:
Software Leads While Services Deepen AdoptionSoftware platforms accounted for 68.74% of the scope 3 supply chain emissions transparency platform market in 2025, confirming that buyers still prioritize core systems over adjacent support services. The reason is straightforward: enterprises need a single platform to handle emissions calculation, supplier communication, reporting logic, and audit evidence in a connected way. European reporting requirements have made that integrated model even more important, as companies need repeatable workflows rather than one-time manual exercises. SAP and IBM product direction also support this pattern because both companies are expanding features that tie carbon workflows directly to operational and financial systems. That makes software the anchor layer of the scope 3 supply chain emissions transparency platform market, even when service demand remains healthy.
Services still matter because most deployments need configuration, supplier onboarding, data checks, and reporting support before a platform can work well in live disclosure cycles. This part of the market grows as projects become more embedded in procurement and finance processes rather than staying inside stand-alone sustainability teams. The need for services also rises when companies try to align supplier-specific data exchange with WBCSD PACT methods and product carbon footprint requirements. In practice, service demand tends to follow software depth, as more capable platforms often require more setup across internal systems and supplier networks. This means the scope 3 supply chain emissions transparency platform industry is not splitting into separate software and service lanes; it is moving toward bundled delivery models where the service layer helps software become usable at scale.
By Deployment Mode:
Cloud Stays Largest While Hybrid Gains Practical AppealCloud accounted for 65.12% of revenue in 2025, reflecting that supplier data collection often spans multiple facilities, partners, and geographies simultaneously. The cloud model fits the scope 3 supply chain emissions transparency platform market because supplier portals, workflow approvals, and cross-company data exchange work better when they are accessible through shared interfaces. WBCSD PACT technical development reinforces this point because standardized product carbon footprint exchange is designed to support system-to-system transfers rather than isolated local files. That interoperability matters more as enterprises request product-level emissions data across categories and geographies. The cloud model also supports faster template changes when disclosure rules or customer requests evolve.
Hybrid is projected to grow at a 18.92% CAGR through 2031 because many large companies still keep core ERP environments and sensitive data controls inside internal systems while using external interfaces for supplier engagement. SAP’s updates show why this design is attractive, since carbon calculations can sit close to transaction records while still drawing on wider factor libraries and connected workflows. Hybrid, therefore, addresses a common enterprise concern in the scope 3 supply chain emissions transparency platform market: how to enable supplier collaboration without weakening data governance. On-premises systems still hold a place in sensitive environments, but they are less aligned with large-scale supplier participation and frequent data exchange. For that reason, the market is not moving away from cloud; it is expanding toward more flexible deployment combinations.
By Enterprise Size:
Large Buyers Lead Revenue While SMEs Move Into ScopeLarge enterprises held 63.45% of the scope 3 supply chain emissions transparency platform market share in 2025 because disclosure obligations and assurance expectations first hit the biggest organizations with the broadest supply chains. The largest buyers also have the internal teams and procurement scale needed to launch multi-country supplier data programs. European Commission guidance matters here because large reporters must manage value chain information within formal disclosure rules, which keeps system demand concentrated among enterprises with major reporting exposure. SAP and IBM examples also fit the needs of this buyer group because integration with finance and procurement systems is more relevant when transaction volumes are high. This keeps large enterprises at the center of contract value across the scope 3 supply chain emissions transparency platform market.
SMEs are projected to grow at a 18.85% CAGR through 2031 because they are increasingly pulled into the reporting processes of their larger customers, even when they are not the first regulated entities. The value chain cap does not remove the need for suppliers to provide carbon data; it mainly defines how far large reporters can go when requesting information from smaller partners. This creates indirect demand for lighter tools, simpler questionnaires, and easier onboarding paths. Supplier network models, such as EcoVadis’s Carbon Data Network, show why SME participation matters: primary data becomes more useful when more suppliers can respond in consistent formats. Over time, the scope 3 supply chain emissions transparency platform market should see more SME activity, not because small firms suddenly become large software buyers, but because larger customers make data readiness a normal condition of doing business.
By Transparency Function:
Data Collection Leads While Traceability Expands FastestSupplier emissions data collection accounted for 27.41% of revenue in 2025, making it the base layer of the scope 3 supply chain emissions transparency platform market. Companies usually start by gathering supplier information in a more structured way before expanding into advanced analytics or product-level tracking. That pattern aligns with MIT Sloan and CSCMP findings on supplier data availability, since the first barrier is often getting usable information into the system in the first place. It also aligns with SBTi guidance, which emphasizes the need for active supplier engagement to achieve better response rates and stronger data quality. In simple terms, the market cannot move into deeper transparency functions until collection workflows are reliable enough to support them.
Supply chain traceability is projected to grow at a 19.12% CAGR through 2031 as buyers increasingly need emissions information tied to products, inputs, and upstream sourcing paths. A 2026 review in Circular Economy and Sustainability linked the development of digital product passports to the broader need for product-level emissions information in sustainable manufacturing, thereby supporting the business case for traceability tools. Worldly’s February 2026 expansion of its Product Impact Calculator to more than 260 consumer goods categories shows how vendors are already scaling this capability for multi-category brands and retailers. WBCSD PACT also strengthens the traceability theme by providing a common path for product carbon footprint exchange across trading partners. For the scope 3 supply chain emissions transparency platform market, this means traceability is moving from a specialist feature into a growth layer that supports both disclosure and product data readiness.
By End-Use Industry:
Manufacturing Anchors Demand While Retail Broadens Use CasesManufacturing accounted for 28.63% of end-use revenue in 2025, making it the largest demand center in the scope 3 supply chain emissions transparency platform market. Manufacturers are closely involved in purchased goods, upstream transport, product design, and supplier coordination, so they face strong pressure to improve emissions visibility across many input categories. The development of product carbon footprint exchange supports this demand because it is especially relevant in industrial supply chains where buyers and suppliers need common data structures. The April 2026 Product Carbon Footprint launch also shows how manufacturers are being served with tools built around bill-of-materials data and cradle-to-gate calculations. That combination keeps manufacturing at the core of spending and product development in the market.
Retail and e-commerce remain the fastest-growing end-use segment because large product assortments, complex sourcing networks, and rising product-level disclosure needs all create pressure for better supplier and category data. Broader category coverage in 2026 is a useful signal here, as retailers and consumer brands need scale across many product groups rather than a narrow, single-category solution. Partnerships focused on closing the primary data gap also fit retail and consumer supply chains, where supplier-specific data is hard to gather at scale. Transportation and logistics is another important user group because emissions data from freight providers feeds directly into shipper reporting, and Freight v2 updates show continued alignment around standardized freight calculation needs. Taken together, these patterns show the scope 3 supply chain emissions transparency platform market moving from a manufacturing-led base into a wider set of product and service chains.
Geography Analysis
Europe Scope 3 Supply Chain Emissions Transparency Platform Market
Europe held the leading position in the scope 3 supply chain emissions transparency platform market in 2025 because the region combines formal disclosure requirements with dense cross-border supplier relationships. The Corporate Sustainability Reporting Directive has kept Scope 3 disclosures in the reporting framework for large companies, which supports sustained software demand rather than a one-off compliance rush. Clarification on the value chain cap also matters because it shapes how companies request data from suppliers, thereby affecting platform workflow design. Europe is also important because product carbon footprint exchange and digital product data are advancing in parallel with corporate reporting needs. That combination keeps the region at the center of both compliance demand and product feature development for the market.
APAC Scope 3 Supply Chain Emissions Transparency Platform Market
Asia-Pacific is projected to be the fastest-growing region in the scope 3 supply chain emissions transparency platform market through 2031, supported by export-led supply chains that increasingly need product and supplier emissions data to work with global buyers. Even where local rules vary, manufacturers in the region are still affected by the reporting expectations and product data requests coming from multinational customers. Cross-border relationships gain a practical basis for data exchange, which is important in supplier-heavy manufacturing corridors. Expansion across hundreds of consumer goods categories also reflects why Asia-Pacific matters, because many regional suppliers serve brands that need broad product-level emissions coverage. Supplier network approaches add to this dynamic by making it easier for large buyers to collect standardized information from distributed suppliers across sectors and locations. The regional growth story, therefore, comes from supply chain position as much as from local reporting rules.
The Americas and MEA Scope 3 Supply Chain Emissions Transparency Platform Market
North America remains one of the largest demand centers because multinational companies in the region often need systems that can serve both domestic sustainability programs and international reporting obligations. Enterprise solutions support this demand with products that connect carbon workflows to finance and procurement data, which matches the needs of large North American buyers. South America, the Middle East, and Africa are earlier-stage regions in the scope 3 supply chain emissions transparency platform market, but they remain relevant where exporters, industrial groups, and supplier networks are being pulled into multinational data requests. Across all regions, adoption still depends less on local branding and more on whether platforms can collect supplier data, integrate operational records, and support product-level traceability with enough consistency to satisfy large enterprise buyers.
Competitive Landscape
The scope 3 supply chain emissions transparency platform market showed a moderately concentrated structure in 2026 because a limited set of large vendors captured much of the high-value enterprise demand, while a wider field of viable specialists remained active across narrower use cases. Competition now turns less on whether a platform can calculate emissions and more on whether it can collect supplier data, support product-level traceability, and integrate with finance and procurement systems. Updates in 2025 and 2026 tied carbon calculations more closely to ERP records, transport data, and country-specific factors. Similar paths emphasize supply chain intelligence tied to direct financial data and transaction-level method selection. These moves raise the bar for smaller vendors because deep enterprise integration is becoming a basic expectation in major deals.
Sustainability-native vendors are defending their position by building data networks and supplier-participation models that larger software groups cannot quickly duplicate. Expanded Carbon Data Networks through partnerships in 2026 demonstrate a deliberate push to strengthen the value of shared supplier and product carbon data rather than compete solely on a calculation engine. Product breadth is also used as a competitive lever by extending impact calculators to more than 260 consumer goods categories, improving relevance for brands and retailers with wide assortments. Other launches based on bill-of-materials data and AI-supported factor mapping strengthen positions with manufacturing customers. These moves show that competitive advantage in the scope 3 supply chain emissions transparency platform market is now tied to network depth, product data readiness, and workflow fit.
AI is becoming another clear line of competition, as vendors seek to reduce manual mapping work without weakening audit confidence. AI-driven emissions matching is one example of this direction because it automates data classification, unit interpretation, and factor matching across large emissions datasets. Comments on data quality highlight why buyers are not looking for automation alone, but automation that can help improve trust in the data being reviewed and reported. The market concentration score is 5 out of 10 because large enterprise contracts are concentrated among a limited group of strong vendors, but the presence of 30 to 40 viable platforms and continued fragmentation outside the top tier keeps the overall field from becoming tightly controlled.
Scope 3 Supply Chain Emissions Transparency Platform Industry Leaders
-
Watershed Technology, Inc
-
Persefoni AI Inc.
-
SAP SE
-
Microsoft Corporation
-
Sweep SAS
- *Disclaimer: Major Players sorted in no particular order
Scope 3 Supply Chain Emissions Transparency Platform Market Companies Covered in this Report
- Persefoni AI Inc.
- Watershed Technology, Inc.
- Sweep SAS
- Normative AB
- Emitwise Limited
- CarbonChain Ltd
- Greenly SAS
- SINAI Technologies, Inc.
- Climatiq GmbH
- Plan A Software GmbH
- Carbon Analytics Limited
- Dcycle Sustainability Solutions, S.L.
- Novata, Inc.
- EcoVadis SAS
- Sphera Solutions, Inc.
- IBM Corporation
- SAP SE
- Microsoft Corporation
- Salesforce, Inc.
- Diligent Corporation
Recent Industry Developments in Scope 3 Supply Chain Emissions Transparency Platform Market
- April 2026: Assent Inc. launched its Product Carbon Footprint (PCF) solution, enabling manufacturers to generate PCFs at scale across entire product portfolios using BOM-level data, AI-powered emission factor mapping, and cradle-to-gate calculations aligned with GHG Protocol and ISO 14067. The solution directly addresses rising customer demand for verified per-SKU carbon data ahead of EU DPP requirements and CSRD Category 1 reporting obligations.
- April 2026: EcoVadis expanded its Carbon Data Network (CDN) by adding Carbmee as a strategic partner, following partnerships with Watershed, Sweep, and Normative. Carbmee's AI-native Environmental Intelligence System (EIS), built on its Carbontology framework, provides SKU-level Scope 3 emissions hotspot identification linked to supply chain automation and financial ROI, adding a financially integrated decarbonization layer to EcoVadis's supplier rating network.
- May 2026: EcoVadis and Watershed Technology announced a strategic partnership to address the Scope 3 primary data gap, combining EcoVadis's PCF Calculator (available in 13 languages across 12 industrial sectors and assigned carbon data reliability levels) with Watershed's sustainability AI platform, enabling enterprises to replace spend-based averages with verified, supplier-specific primary data at the scale of EcoVadis's 175,000-company network.
- February 2026: Worldly expanded its Product Impact Calculator to cover over 260 consumer goods product categories, including apparel, home goods, furniture, sporting goods, and hard goods, enabling multi-category brands and retailers to calculate product-level Scope 3 emissions using primary data rather than industry-average estimates at scale across product portfolios.
Global Scope 3 Supply Chain Emissions Transparency Platform Market Report Scope
The Scope 3 Supply Chain Emissions Transparency Platform market refers to software platforms and services that enable organizations to measure, monitor, and disclose indirect (Scope 3) carbon emissions generated across their supply chains. These solutions provide functionalities such as supplier emissions tracking, Scope 3 data collection and disclosure, lifecycle emissions assessment, ESG risk management, and compliance reporting aligned with global sustainability frameworks. By embedding carbon transparency into procurement and supply chain workflows, these platforms help enterprises identify high-emission suppliers, improve accountability, and accelerate decarbonization strategies.
The Scope 3 Supply Chain Emissions Transparency Platform market report is segmented by Component (Software, and Services), Deployment (Cloud, On-Premises, and Hybrid), Enterprise Size (Large Enterprises, and Small and Medium Enterprises), Application (Supplier Carbon Emissions Tracking, Scope 3 Data Collection and Disclosure, Supply Chain ESG and Risk Management, Lifecycle Emissions Assessment, and Compliance and Audit Reporting), End-Use Industry (IT and Telecom, BFSI, Manufacturing, Energy and Utilities, Oil and Gas, Retail and E-Commerce, Construction and Infrastructure, Government and Public Sector, and Other End-User Industries), and Geography (North America, South America, Europe, Asia-Pacific, Middle East, and Africa). The Market Forecasts are Provided in Terms of Value (USD).
Segmentation Overview
| Software Platforms |
| Services |
| Cloud |
| On-Premises |
| Hybrid |
| Large Enterprises |
| Small And Medium Enterprises |
| Supplier Emissions Data Collection |
| Data Validation and Verification |
| Product Carbon Footprint Transparency |
| Supply Chain Traceability |
| Reporting and Disclosure |
| Supplier Collaboration |
| Manufacturing |
| Retail and E-Commerce |
| Transportation and Logistics |
| Energy and Utilities |
| IT and Telecom |
| BFSI |
| Construction and Infrastructure |
| Government and Public Sector |
| Other End-User Industries |
| North America | Canada | |
| Mexico | ||
| South America | Brazil | |
| Argentina | ||
| Rest of South America | ||
| Europe | Germany | |
| United Kingdom | ||
| France | ||
| Italy | ||
| Spain | ||
| Netherlands | ||
| Russia | ||
| Rest of Europe | ||
| Asia-Pacific | China | |
| Japan | ||
| India | ||
| South Korea | ||
| Australia and New Zealand | ||
| Indonesia | ||
| Rest of Asia-Pacific | ||
| Middle East and Africa | Middle East | Saudi Arabia |
| United Arab Emirates | ||
| Rest of Middle East | ||
| Africa | South Africa | |
| Nigeria | ||
| Rest of Africa | ||
| Rest of Africa | ||
| By Component | Software Platforms | ||
| Services | |||
| By Deployment Mode | Cloud | ||
| On-Premises | |||
| Hybrid | |||
| By Enterprise Size | Large Enterprises | ||
| Small And Medium Enterprises | |||
| By Transparency Function | Supplier Emissions Data Collection | ||
| Data Validation and Verification | |||
| Product Carbon Footprint Transparency | |||
| Supply Chain Traceability | |||
| Reporting and Disclosure | |||
| Supplier Collaboration | |||
| By End-Use Industry | Manufacturing | ||
| Retail and E-Commerce | |||
| Transportation and Logistics | |||
| Energy and Utilities | |||
| IT and Telecom | |||
| BFSI | |||
| Construction and Infrastructure | |||
| Government and Public Sector | |||
| Other End-User Industries | |||
| By Geography | North America | Canada | |
| Mexico | |||
| South America | Brazil | ||
| Argentina | |||
| Rest of South America | |||
| Europe | Germany | ||
| United Kingdom | |||
| France | |||
| Italy | |||
| Spain | |||
| Netherlands | |||
| Russia | |||
| Rest of Europe | |||
| Asia-Pacific | China | ||
| Japan | |||
| India | |||
| South Korea | |||
| Australia and New Zealand | |||
| Indonesia | |||
| Rest of Asia-Pacific | |||
| Middle East and Africa | Middle East | Saudi Arabia | |
| United Arab Emirates | |||
| Rest of Middle East | |||
| Africa | South Africa | ||
| Nigeria | |||
| Rest of Africa | |||
| Rest of Africa | |||
Key Questions Answered in the Report
What is the current and forecast value of the scope 3 supply chain emissions transparency platform space?
It was valued at USD 1.82 billion in 2025, stood at USD 2.12 billion in 2026, and is forecast to reach USD 5.01 billion by 2031 at a 18.77% CAGR.
What is driving software demand in this field?
Demand is being pushed by mandatory disclosure rules, the move toward supplier-specific data, and the need to connect carbon reporting with procurement and ERP workflows.
Which deployment model leads today?
Cloud led with 65.12% of revenue in 2025 because supplier data exchange and multi-party workflows are easier to manage through shared and connected platforms.
Why are large enterprises the main buyers?
Large enterprises held 63.45% of revenue in 2025 because they face the earliest disclosure pressure and have the scale to run supplier data programs across many business units and regions.
Which function is growing fastest?
Supply chain traceability is projected to expand at a 19.12% CAGR through 2031 as buyers need more product-level and upstream sourcing visibility.
Which end-use segment is setting the pace for adoption?
Manufacturing remained the largest end-use segment with 28.63% of revenue in 2025, while retail and e-commerce are expanding faster as multi-category brands seek broader supplier and product data coverage.