Revenue Marketing Services Market Size and Share
Market Overview
| Study Period | 2020 - 2031 |
|---|---|
| Market Size (2026) | USD 34.15 Billion |
| Market Size (2031) | USD 54.80 Billion |
| Growth Rate (2026 - 2031) | 9.90% CAGR |
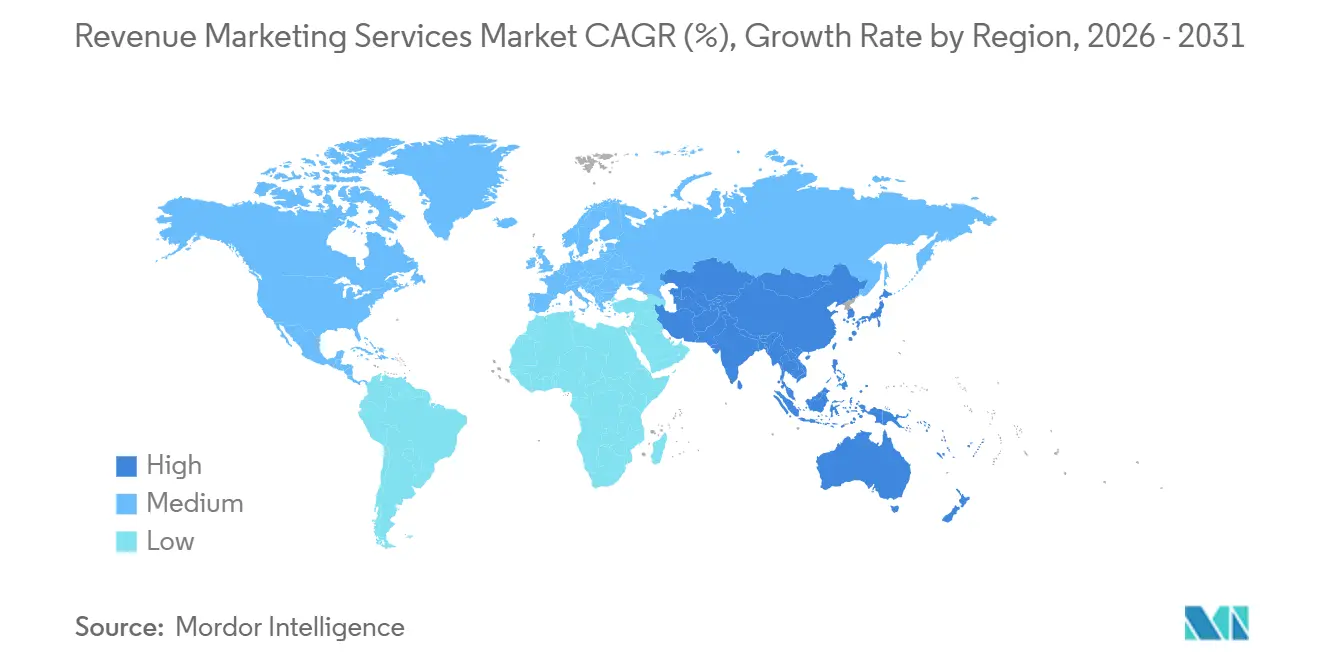
| Fastest Growing Market | Asia-Pacific |
| Largest Market | North America |
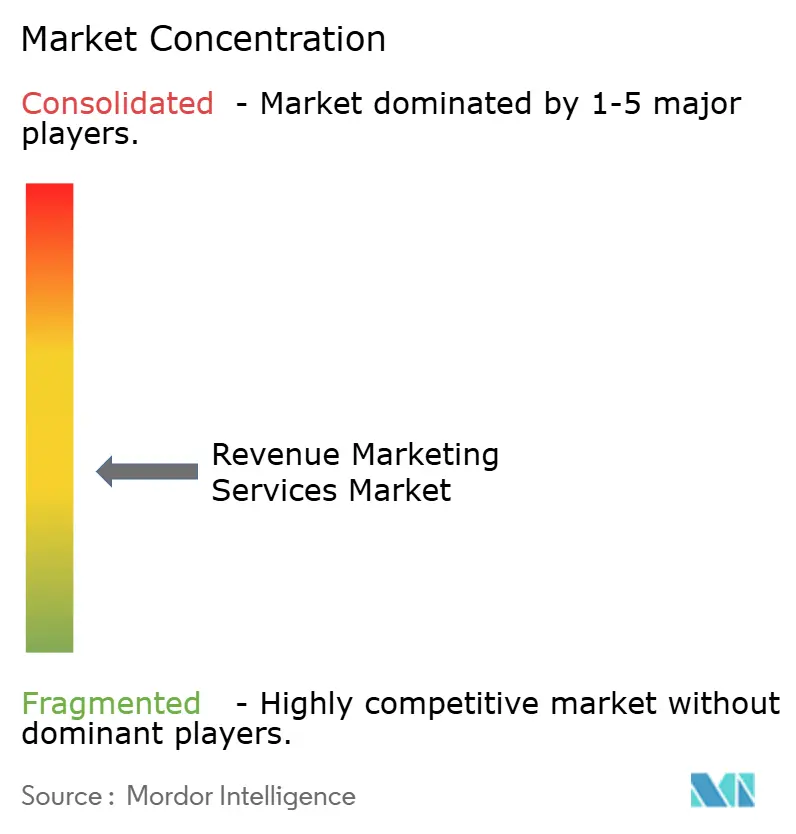
| Market Concentration | Medium |
Major Players *Disclaimer: Major Players sorted in no particular order Image © Mordor Intelligence. Reuse requires attribution under CC BY 4.0. | |
Revenue Marketing Services Market Analysis by Mordor Intelligence
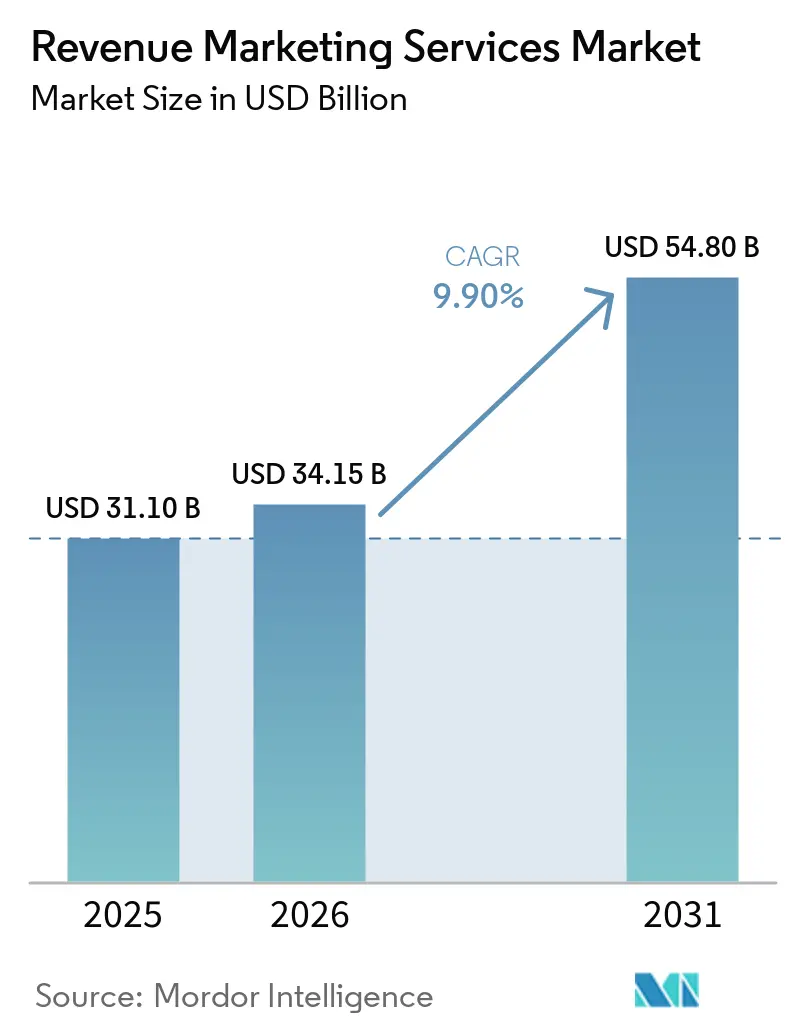
The revenue marketing services market size is projected to expand from USD 31.1 billion in 2025 and USD 34.15 billion in 2026 to USD 54.8 billion by 2031, registering a CAGR of 9.90% between 2026 to 2031. The revenue marketing services market is being reshaped by a clear shift in buyer expectations, as finance and revenue teams now want physical programs to meet the same accountability standards as paid digital. That change is pushing providers to rework pricing, staffing, reporting, and technology choices across the revenue marketing services market. Demand is moving toward programs that can connect in-person execution with CRM capture, attribution logic, and revenue reporting. This is also raising the importance of measurement infrastructure, because proof of delivery is no longer enough when clients want proof of conversion, pipeline movement, or retention value. At the same time, talent shortages and fragmented martech environments are making execution more difficult, which is widening the gap between scaled providers with stronger systems and smaller vendors that still rely on manual workflows.
Key Report Takeaways
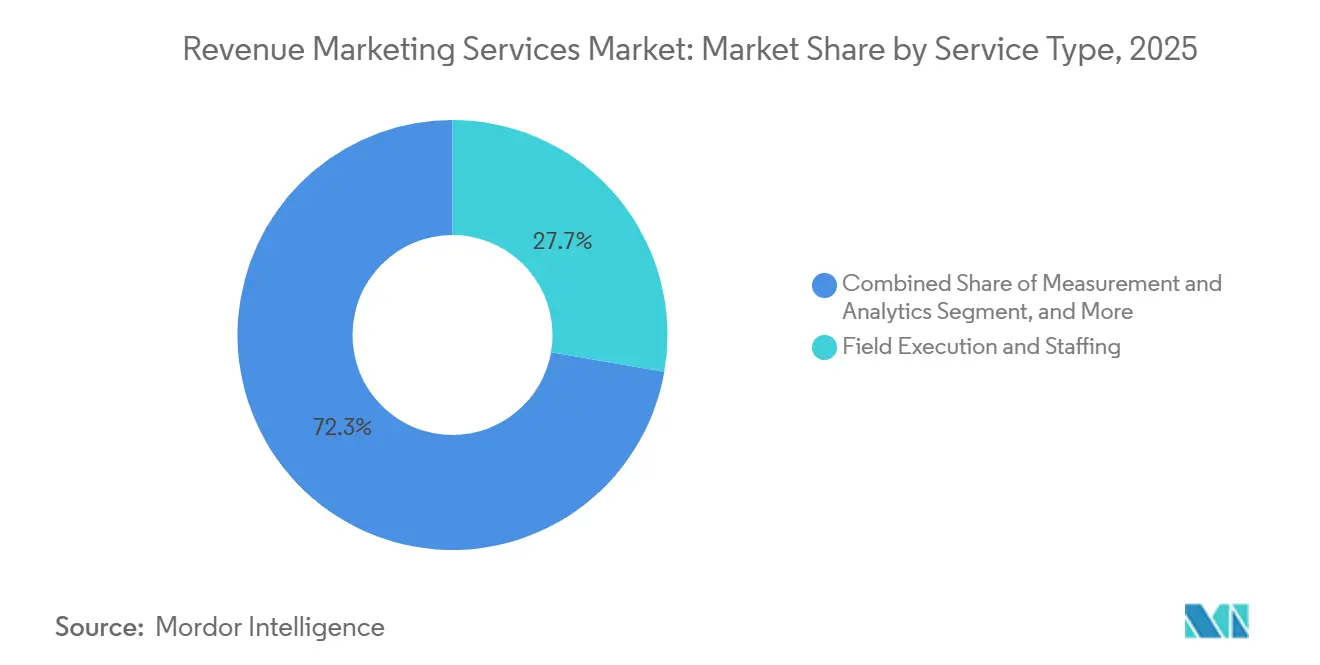
- By service type, Field Execution and Staffing held 27.74% of the revenue marketing services market share in 2025, while Measurement and Analytics is projected to expand at a 14.26% CAGR through 2031.
- By end-user industry, Retail and E-commerce accounted for 30.16% of the market in 2025, while Healthcare and Life Sciences are projected to record the fastest growth at a 15.44% CAGR through 2031.
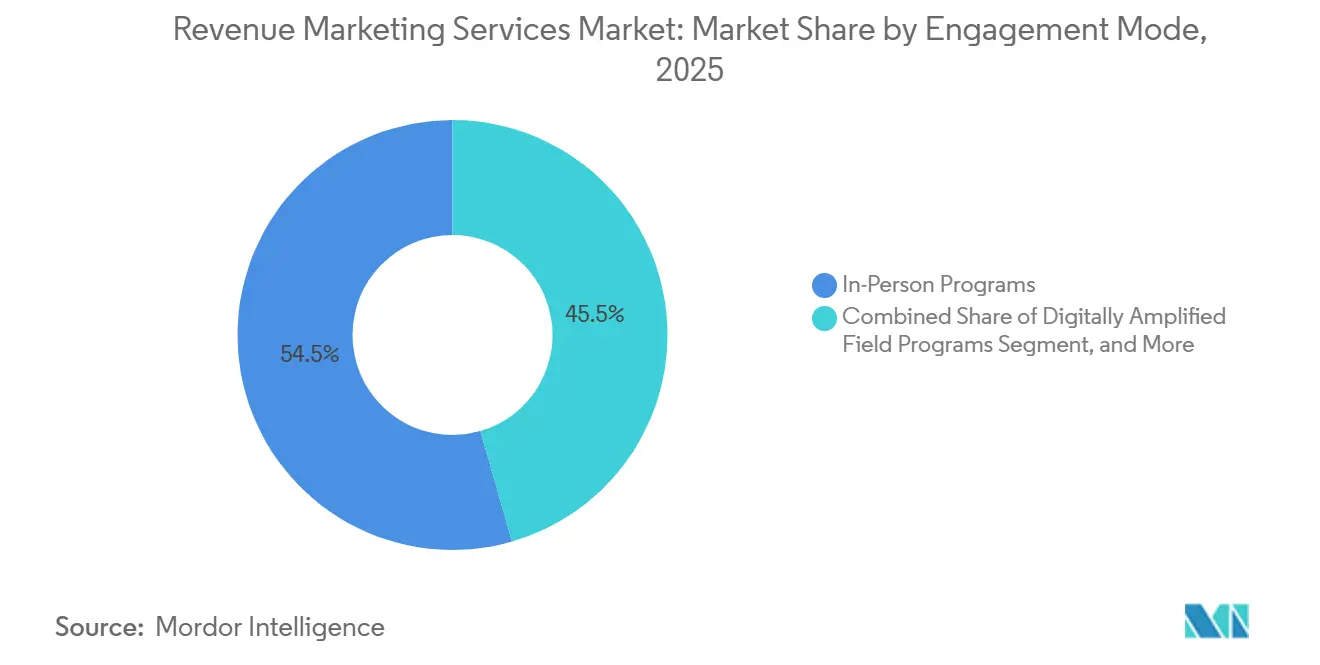
- By engagement mode, In-Person Programs represented 54.47% of spend in 2025, while Digitally Amplified Field Programs are expected to expand at a 15.68% CAGR through 2031.
- By campaign objective, Brand Awareness and Engagement led with a 26.68% share in 2025, while Product Trial and Sampling is projected to grow at a 14.42% CAGR through 2031.
- By geography, North America held 46.30% of the revenue marketing services market in 2025, while Asia-Pacific is expected to register the highest regional CAGR at 14.18% through 2031.
Note: Market size and forecast figures in this report are generated using Mordor Intelligence’s proprietary estimation framework, updated with the latest available data and insights as of January 2026.
Global Revenue Marketing Services Market Trends and Insights
Driver Impact Analysis*
| Driver | (~) % Impact on CAGR Forecast | Geographic Relevance | Impact Timeline |
|---|---|---|---|
| Rising Demand for Measurable Experiential ROI | +2.1% | Global, with strongest pull in North America and Western Europe | Short term (≤ 2 years) |
| Expansion of Omnichannel and Face-to-Face Channel Mix | +1.8% | Global, APAC spill-over accelerating | Medium term (2-4 years) |
| Growing Use of Product Demonstration and Sampling to Lift Conversion | +1.6% | North America, Western Europe, APAC core (India, Japan, Australia) | Short term (≤ 2 years) |
| Retailer Demand for High-Accountability In-Store Execution | +1.2% | North America, APAC core, spill-over to UK and Germany | Short term (≤ 2 years) |
| First-Party and Zero-Party Data Capture Through Live Activations | +1.4% | Global, with compliance complexity shaping pace in EU and APAC | Medium term (2-4 years) |
| ABM and Field Marketing Convergence in B2B Revenue Teams | +1.3% | North America and Western Europe, early adoption in Singapore and Australia | Medium term (2-4 years) |
| Source: Mordor Intelligence | |||
Rising Demand for Measurable Experiential ROI
The revenue marketing services market is seeing stronger demand for measurable event and field outcomes because finance teams no longer treat live activation as spend that sits outside revenue scrutiny. Event teams have become better at linking attendance behavior to CRM and pipeline reporting, and 40% of organizers still reported difficulty proving ROI in 2026, down from 70% in 2025.[1]Bizzabo, “2026 State of Events Benchmark Report,” Bizzabo, welcome.bizzabo.com That improvement matters because it shows that methodology, not just spend levels, is changing buyer confidence in the revenue marketing services market. Smaller and mid-sized brands are also under tighter budget review, which makes unified reporting and defensible attribution more important when contracts come up for renewal. Providers that can show how event engagement connects to pipeline movement or retention are moving into a stronger position in the revenue marketing services market. Providers that still rely on isolated event dashboards or manual recap files are facing higher renewal risk even when execution quality remains solid.
Expansion of Omnichannel and Face-to-Face Channel Mix
The revenue marketing services market is no longer shaped by a simple tradeoff between digital and physical budgets, because many clients now fund both at the same time for different roles in the same program. Physical activations are increasingly expected to generate digital signals, while digital channels are being used to extend follow-up, retargeting, and measurement around live programs. This is changing the operating model of the revenue marketing services market, because field teams are now expected to support QR redemption, consent capture, and real-time follow-up tasks during the activation itself. France Pub reported that the French advertising market contracted in 2025, yet events and experiential outperformed other offline categories, which supports the view that brands are moving spend toward more measurable physical engagement rather than abandoning it. As a result, service providers are being asked to train staff for blended physical and digital workflows instead of traditional event-only execution. This shift is helping the revenue marketing services market grow in areas where face-to-face contact remains essential but where clients still want the reach and data discipline of digital programs.
Growing Use of Product Demonstration and Sampling to Lift Conversion
Product trial is playing a larger role in the revenue marketing services market because clients increasingly view it as a conversion tool instead of a simple awareness tactic. Brands are paying closer attention to whether a live demo or sample can move purchase intent, basket value, repeat purchase, or store-level sell-through after the event. That is changing vendor selection in the revenue marketing services market, because buyers want reporting tied to commercial outcomes rather than headcount, impressions, or basic footfall logs. It also changes how programs are designed, since brands are combining sampling with merchandising, retailer coordination, and customer data capture to make the activation more measurable. The strongest demand is going to providers that can connect field activity with scanner data, CRM records, or retailer reporting systems. This is creating a clear divide between providers that can defend premium pricing with verified outcomes and those that still compete mainly on labor supply.
First-Party and Zero-Party Data Capture Through Live Activations
First-party and zero-party data capture is becoming a stronger growth lever in the revenue marketing services market because clients want live programs to create lasting data assets, not just short-term exposure. QR-to-CRM flows, digital registration layers, and consent-led follow-up are turning in-person touchpoints into inputs for segmentation and lifecycle marketing inside the revenue marketing services market. India notified the DPDP Rules in November 2025, which give marketers a clearer compliance framework for handling personal data gathered during activations.[2]Press Information Bureau, “DPDP Rules, 2025 Notified,” Government of India, static.pib.gov.in Australia’s privacy regulator also launched a 2026 compliance sweep focused on personal data handling, which raises the bar for event and field programs that collect information in person.[3]Office of the Australian Information Commissioner, “Privacy Compliance Sweep to Put Privacy Policies Under the Spotlight,” OAIC, oaic.gov.au These developments matter because the revenue marketing services market is rewarding providers that can design clean opt-in journeys, retain usable records, and move the captured data into downstream systems without creating compliance risk. They also reinforce the view that live activations are becoming part of the customer data infrastructure rather than standing apart from it.
Restraint Impact Analysis*
| Restraint | (~) % Impact on CAGR Forecast | Geographic Relevance | Impact Timeline |
|---|---|---|---|
| Budget Scrutiny and Longer Revenue Proof Windows | -1.4% | Global, with acute pressure in North America and Western Europe | Short term (≤ 2 years) |
| Shortage of Trained Field and Event Labor | -1.1% | North America, Western Europe, emerging gap in Australia and Singapore | Medium term (2-4 years) |
| CRM and Event-Tech Fragmentation Weakening Closed-Loop Attribution | -0.9% | Global, more acute in mid-market than enterprise | Medium term (2-4 years) |
| Permit, Privacy, and Category Compliance Complexity in Roadshows and Sampling | -0.7% | EU, North America, APAC | Medium term (2-4 years) |
| Source: Mordor Intelligence | |||
Budget Scrutiny and Longer Revenue Proof Windows
Budget review is becoming a larger brake on the revenue marketing services market because physical programs often need more time than digital media to show final sales or conversion results. Marketing teams are operating under tighter internal review, and the CMO Survey reported that training budgets fell to 3.8% of marketing spend while headcount growth slowed sharply year over year in 2026. That environment is leading to slower procurement cycles, more pilot requirements, and more mid-program performance reviews across the revenue marketing services market. The problem is structural, because retail sell-through, repeat purchase, and CRM conversion often need 60-90 days to become visible after a live program ends. That timing can clash with approval cycles that now demand faster proof and more finance-ready documentation. Providers that can break work into milestones and report progress in a format that finance teams accept are better placed to defend budgets in the revenue marketing services market.
Shortage of Trained Field and Event Labor
Labor availability remains a major constraint in the revenue marketing services market, especially for roles that combine product knowledge, customer interaction, and clean data capture. The shortage is most visible at the senior brand ambassador and field program manager level, where buyers need people who can handle both activation quality and digital workflow discipline. Lower training budgets are making this harder to solve, because companies have less room to build deep talent benches before programs go live. This is pushing providers in the revenue marketing services market toward hybrid workforce models that rely on a trained core roster supported by flexible external labor. That model can protect service continuity, but it also raises baseline operating costs and reduces margin room when clients resist price increases. It also favors larger providers that can spread training and workforce management costs across a broader book of business.
*Our forecasts treat driver/restraint impacts as directional, not additive. The impact forecasts reflect baseline growth, mix effects, and variable interactions.
Segment Analysis
By Service Type: Measurement Infrastructure Is Reordering Value Capture
Field Execution and Staffing held 27.74% of the revenue marketing services market share in 2025, which reflects its role as the operating base for almost every downstream service category. The segment remains central because product demos, roadshows, in-store activations, and sales support all depend on trained personnel being deployed consistently across locations. In the revenue marketing services market, that leadership also comes with higher exposure to wage pressure, labor platform disruption, and client expectations for digitally verified proof rather than self-reported activity logs. Advantage Solutions reported events growth of nearly 20% in the first quarter of 2026 and an improved execution rate of 94%, which points to the value of centralized labor management and ongoing technology upgrades at scale. Measurement and Analytics is the fastest-growing service type at a 14.26% CAGR from 2026 to 2031, which shows that proof architecture is moving closer to the center of buying criteria.
Strategy and Program Design still command premium pricing in the revenue marketing services industry, but it remains lower in volume because it is usually purchased with execution rather than on a standalone basis. Retail Merchandising and In-Store Activation continues to benefit from retailer-brand accountability agreements that require tighter compliance at the shelf and stronger store-level reporting. Event and Roadshow Management, Lead Generation and Sales Support, and Product Demonstration and Sampling remain attractive parts of the revenue marketing services market, but these areas are fragmented and increasingly judged on their ability to connect execution with measurement. That is why providers that can bundle labor, workflow systems, analytics, and client reporting are gaining a more durable pricing edge than vendors that sell execution only.


By End-User Industry: Healthcare Is Opening Higher-Compliance Growth Lanes
Within the revenue marketing services market size in 2025, Retail and E-commerce accounted for a 30.16% share, which reflects the continued fight for shelf visibility, point-of-sale conversion, and trade partner support. This lead is tied to intense retail competition, where brands still need people in stores and on the ground to influence assortment, compliance, and shopper decision-making. Consumer Goods and Beauty followed closely in importance, because sampling and demonstration remain central to launch support and repeat purchase strategies in categories with high trial sensitivity. IT, Telecom, and BFSI use the revenue marketing services market in a different way, with more emphasis on B2B events, roadshows, lead generation, and pipeline progression. Healthcare and Life Sciences is the fastest-growing end-user category at a 15.44% CAGR from 2026 to 2031, which shows how quickly compliant omnichannel engagement is becoming a priority after years of reduced access to healthcare professionals.
Real Chemistry reported USD 560 million in 2025 revenue and 14% growth over 2024, and it said momentum is expected to strengthen in 2026 through AI-enabled delivery and expanded precision media services. That example matters because specialist healthcare providers can absorb regulatory complexity that generalist firms often struggle to manage in the revenue marketing services market. HIPAA, GxP standards, and category-specific marketing rules raise the compliance burden, but they also create a barrier to entry that can support stronger margins for capable firms in the revenue marketing services industry. Media and Entertainment, Education, Travel and Hospitality, Industrial, and Automotive also remain active users of revenue marketing services, though their activation calendars, measurement frameworks, and buyer priorities differ by category.
By Engagement Mode: Digital Layers Are Changing The Economics Of Field Programs
In-Person Programs retained a 54.47% share in 2025, which shows that direct physical contact still holds a central place in the revenue marketing services market even as digital channels expand around it. That result does not suggest resistance to digital change. It suggests that clients now expect physical engagement to do more work inside a broader program architecture. Hybrid Programs sit in the middle of the revenue marketing services market, because they help brands extend reach beyond a single venue while preserving the depth and trust that in-person contact can deliver. Bizzabo’s 2026 benchmark findings also point to a more mature hybrid model, where event teams are building around specific outcome goals rather than using hybrid formats mainly for cost control. This makes the engagement-mode mix less about replacement and more about how different formats are combined.
Digitally Amplified Field Programs is the fastest-growing engagement mode at a 15.68% CAGR from 2026 to 2031, and this is the part of the revenue marketing services market that most directly challenges older field economics. These programs extend the value of an activation by adding QR capture, social amplification, geofenced follow-up, and real-time dashboards to what used to be a stand-alone physical interaction. That changes staffing needs because brand representatives now need to manage consent mechanics, digital tools, and cleaner reporting while still delivering strong face-to-face execution. It also means providers with stronger operating systems can lift both revenue quality and client stickiness in the revenue marketing services market, while providers built around labor supply alone may find it harder to protect pricing.
By Campaign Objective: Trial And Data Capture Are Becoming More Commercially Central
Brand Awareness and Engagement led campaign objective spend with a 26.68% share in 2025, because many consumer activations still begin with reach, recall, and preference-building goals. Customer Acquisition remains another large objective in the revenue marketing services market, but it is now more often evaluated beside digital channels rather than inside a separate brand-only budget. Lead Generation and sales conversion continue to matter most in B2B programs, especially where field teams support account-based plays and need to influence specific opportunities instead of broad audiences. Channel and Retail Partner Support remains smaller in share, yet it is operationally demanding because it depends on close coordination between brand teams, retailers, and service providers. Product Trial and Sampling is the fastest-growing objective at a 14.42% CAGR from 2026 to 2031, which shows that clients are placing more weight on activation formats that can support both purchase movement and data capture.
The revenue marketing services market is treating live trial less like a one-time promotional activity and more like a structured route into customer data, CRM follow-up, and repeat purchase programs. Consent-based contact capture and preference data gathered during activations can continue delivering value long after the event itself ends. That makes these programs easier to defend in the revenue marketing services market, because the resulting data asset can support segmentation, lifecycle nurture, and future conversion work. It also reinforces why measurement, privacy handling, and post-event integration now matter as much as the trial experience itself.
Geography Analysis
North America commanded 46.30% of the revenue marketing services market share in 2025, which keeps the region in the leading position globally. The United States accounts for the largest part of regional demand, supported by a mature outsourced field marketing structure, deep retail-brand co-investment models, and heavy B2B event activity. Canada adds similar demand patterns at a smaller scale, while Mexico continues to develop as organized retail expands and multinational consumer brands increase field execution investment. In the revenue marketing services market, North America is also where budget scrutiny is most visible, because marketing teams are operating under tighter headcount and spend controls. Privacy compliance is also becoming more material in the region, which is raising the cost and complexity of data handling for live programs.
Europe remained the second-largest regional block in the revenue marketing services market, supported by established B2B event infrastructure in Germany and the United Kingdom and strong experiential demand from FMCG and beauty brands in France and Italy. The region also benefits from a broad base of omnichannel activation demand, where physical engagement is increasingly expected to generate measurable customer signals rather than brand exposure alone. France Pub reported that the French advertising market declined in 2025, yet events and experiential performed better than other communication categories, which supports the case for budget redistribution toward measurable physical engagement. GDPR and related national privacy rules continue to make Europe the most compliance-intensive region for data capture at activations, which raises operating overhead but also favors providers with stronger governance processes.
Asia-Pacific is the fastest-growing region in the revenue marketing services market, with a 14.18% CAGR from 2026 to 2031. China, India, Japan, South Korea, and Australia each represent different activation models, which means providers cannot treat the region as a single operating environment. India’s organized retail expansion and healthcare-related field demand are lifting service needs faster than the regional average, while Japan is seeing more structured investment in premium in-store experience as brands compete for attention in slower-growth categories. Australia’s privacy regulator launched a 2026 compliance sweep that focused on how organizations manage personal data, which is directly relevant for field and sampling programs that gather consumer information in person OAIC. South America is seeing stronger growth in Brazil, Mexico’s neighboring trade-linked brand networks, Chile, and Colombia, the Middle East is gaining from B2B event infrastructure and experiential retail investment, and Africa remains the smallest regional cluster, led by South Africa, Egypt, and Nigeria for FMCG sampling, telecom field sales, and financial services lead generation.

Competitive Landscape
The revenue marketing services market remains moderately fragmented at the service-type level, but concentration is increasing at the top as large holding groups deepen their control over experiential, field, and data assets. Omnicom completed its acquisition of Interpublic Group in November 2025, creating a larger combined structure with annual revenue above USD 25 billion and bringing major experiential capabilities under the same ownership umbrella. That move matters because it gives the combined group more reach across sponsorship, live experience, and field activation when serving large multinational clients in the revenue marketing services market. Even so, independent specialists continue to compete by offering faster execution, category depth, and clearer measurement transparency. The result is a two-track competitive structure in the revenue marketing services market, with scale groups pursuing integrated platforms while specialists win where speed, flexibility, or category-specific compliance matters more.
Publicis strengthened its position in data-led activation by announcing an agreement to acquire LiveRamp in May 2026, a move meant to expand data co-creation and AI-enabled marketing capability. One month earlier, Publicis also entered an agreement to acquire 160over90, which expands its sports, sponsorship, and culture-led experiential reach. Jack Morton completed its spinout from Omnicom and merged with Impact XM in January 2026, creating an independent experiential platform with more than 1,000 employees across 20 offices. Freeman also launched The Freeman Company in February 2026 to unite 9 live experience brands under one parent structure, which signals a similar push toward integrated delivery.
Below the biggest networks, the revenue marketing services market is still open to well-positioned independents and private-equity-backed firms that can combine execution quality with stronger reporting systems. Acosta Group said 2025 marked its fifth consecutive year of revenue and profit growth, and in January 2026 it formed a strategic alliance with CommerceIQ to build an AI-driven intelligent commerce offer that links in-store execution with commerce data. Advantage Solutions also continued to invest in technology transformation, and its first-quarter 2026 results showed nearly 20% growth in events with a 94% execution rate, which underlines how operational discipline is becoming a competitive asset. This leaves a meaningful mid-market gap in the revenue marketing services market, because brands with field budgets that are too small for full holding-company focus but too complex for small boutiques still need capable partners. AI is becoming a more visible differentiator in the revenue marketing services market, especially for territory planning, staffing allocation, activation scoring, and the broader proof architecture that now shapes renewals and pricing.
Revenue Marketing Services Industry Leaders
Advantage Solutions Inc.
Acosta Group
The Freeman Company
Informa PLC
Pico Far East Holdings Limited
- *Disclaimer: Major Players sorted in no particular order

Recent Industry Developments
- May 2026: Publicis Groupe announced agreement to acquire LiveRamp, the global data collaboration platform, for a total enterprise value of USD 2.2 billion in an all-cash transaction. The deal, expected to close before year-end 2026, is designed to accelerate Publicis's position in data co-creation for AI-enabled marketing, directly expanding the holding company's ability to connect revenue marketing activation data with audience intelligence assets at scale.
- April 2026: Publicis Groupe entered in to definitive agreement to acquire 160over90, the global sports and culture-first experiential agency, strengthening its revenue marketing services capability across sports sponsorships, fan activations, and branded cultural experiences. The acquisition builds on 2025 acquisitions of Adopt and Bespoke and a partnership with Magic Johnson Enterprises, consolidating Publicis's position in performance-linked experiential at scale.
- February 2026: The Freeman Company launched as a new parent entity uniting nine category-leading live experience brands including 3D Exhibits, BaAM, Sparks, mdg, and Alford Media. The consolidation creates one of the industry's most comprehensive integrated live experience providers, enabling single-partner delivery across design, production, staffing, and analytics for complex high-stakes events.
- January 2026: Jack Morton Worldwide completed its spinout from Omnicom and merged with Impact XM, a New Jersey-based global experiential agency, forming a privately held entity supported by The Riverside Company with over 1,000 employees across 20 offices in North America, Europe, the Middle East, and Asia-Pacific. The combined company retained the Jack Morton name and is positioned as an independent pure-play experiential partner.


Global Revenue Marketing Services Market Report Scope
The Revenue Marketing Services Market refers to services that help organizations align marketing activities with sales outcomes and measurable revenue impact. It includes support for pipeline generation, lead scoring, revenue attribution, demand-to-revenue conversion, and sales-marketing coordination.
The Revenue Marketing Services Market Report is Segmented by Service Type (Strategy and Program Design, Field Execution and Staffing, Retail Merchandising and In-Store Activation, Product Demonstration and Sampling, Event and Roadshow Management, Lead Generation and Sales Support, and Measurement and Analytics), End-user Industry (Retail and E-commerce, Consumer Goods and Beauty, Media and Entertainment, IT and Telecom, BFSI, and Healthcare and Life Sciences), Engagement Mode (In-Person Programs, Hybrid Programs, and Digitally Amplified Field Programs), Campaign Objective (Customer Acquisition, Lead Generation, Sales Conversion, Product Trial and Sampling, Brand Awareness and Engagement, and Channel and Retail Partner Support), and Geography. The Market Forecasts are Provided in Terms of Value (USD).
| Strategy and Program Design |
| Field Execution and Staffing |
| Retail Merchandising and In-Store Activation |
| Product Demonstration and Sampling |
| Event and Roadshow Management |
| Lead Generation and Sales Support |
| Measurement and Analytics |
| Other Service Types |
| Retail and E-commerce |
| Consumer Goods and Beauty |
| Media and Entertainment |
| IT and Telecom |
| BFSI |
| Healthcare and Life Sciences |
| Other End-user Industries (Education, Travel and Hospitality, Industrial, Automotive) |
| In-Person Programs |
| Hybrid Programs |
| Digitally Amplified Field Programs |
| Customer Acquisition |
| Lead Generation |
| Sales Conversion |
| Product Trial and Sampling |
| Brand Awareness and Engagement |
| Channel and Retail Partner Support |
| Other Campaign Objectives |
| North America | United States |
| Canada | |
| Mexico | |
| South America | Brazil |
| Argentina | |
| Chile | |
| Rest of South America | |
| Europe | Germany |
| United Kingdom | |
| France | |
| Italy | |
| Spain | |
| Rest of Europe | |
| Asia-Pacific | China |
| Japan | |
| India | |
| South Korea | |
| Australia | |
| Rest of Asia-Pacific | |
| Middle East | United Arab Emirates |
| Saudi Arabia | |
| Qatar | |
| Rest of Middle East | |
| Africa | South Africa |
| Egypt | |
| Nigeria | |
| Rest of Africa |
| By Service Type | Strategy and Program Design | |
| Field Execution and Staffing | ||
| Retail Merchandising and In-Store Activation | ||
| Product Demonstration and Sampling | ||
| Event and Roadshow Management | ||
| Lead Generation and Sales Support | ||
| Measurement and Analytics | ||
| Other Service Types | ||
| By End-user Industry | Retail and E-commerce | |
| Consumer Goods and Beauty | ||
| Media and Entertainment | ||
| IT and Telecom | ||
| BFSI | ||
| Healthcare and Life Sciences | ||
| Other End-user Industries (Education, Travel and Hospitality, Industrial, Automotive) | ||
| By Engagement Mode | In-Person Programs | |
| Hybrid Programs | ||
| Digitally Amplified Field Programs | ||
| By Campaign Objective | Customer Acquisition | |
| Lead Generation | ||
| Sales Conversion | ||
| Product Trial and Sampling | ||
| Brand Awareness and Engagement | ||
| Channel and Retail Partner Support | ||
| Other Campaign Objectives | ||
| By Geography | North America | United States |
| Canada | ||
| Mexico | ||
| South America | Brazil | |
| Argentina | ||
| Chile | ||
| Rest of South America | ||
| Europe | Germany | |
| United Kingdom | ||
| France | ||
| Italy | ||
| Spain | ||
| Rest of Europe | ||
| Asia-Pacific | China | |
| Japan | ||
| India | ||
| South Korea | ||
| Australia | ||
| Rest of Asia-Pacific | ||
| Middle East | United Arab Emirates | |
| Saudi Arabia | ||
| Qatar | ||
| Rest of Middle East | ||
| Africa | South Africa | |
| Egypt | ||
| Nigeria | ||
| Rest of Africa | ||


Key Questions Answered in the Report
What is the 2026 size of the revenue marketing services market?
The revenue marketing services market is valued at USD 34.15 billion in 2026 and is projected to reach USD 54.8 billion by 2031 at a 9.90% CAGR.
Which service type leads revenue marketing services spending?
Field Execution and Staffing led with a 27.74% share in 2025, which reflects the continued need for trained personnel across in-store, event, and B2B programs.
Why is Measurement and Analytics growing so quickly?
It is projected to expand at a 14.26% CAGR because clients increasingly want finance-ready reporting, attribution, and clearer proof of commercial outcomes.
Which end-user group is expanding the fastest?
Healthcare and Life Sciences is the fastest-growing end-user category, with a 15.44% CAGR through 2031, driven by compliant omnichannel engagement needs.
Which engagement format is gaining the most momentum?
Digitally Amplified Field Programs is expected to grow at a 15.68% CAGR, as brands add CRM capture, social amplification, and data-led follow-up to live activation.
Which region offers the strongest growth outlook through 2031?
Asia-Pacific is projected to grow the fastest at a 14.18% CAGR, supported by organized retail expansion, healthcare demand, and stronger adoption of experience-led marketing models.
Page last updated on:


