Market Overview
| Study Period | 2020 - 2031 |
|---|---|
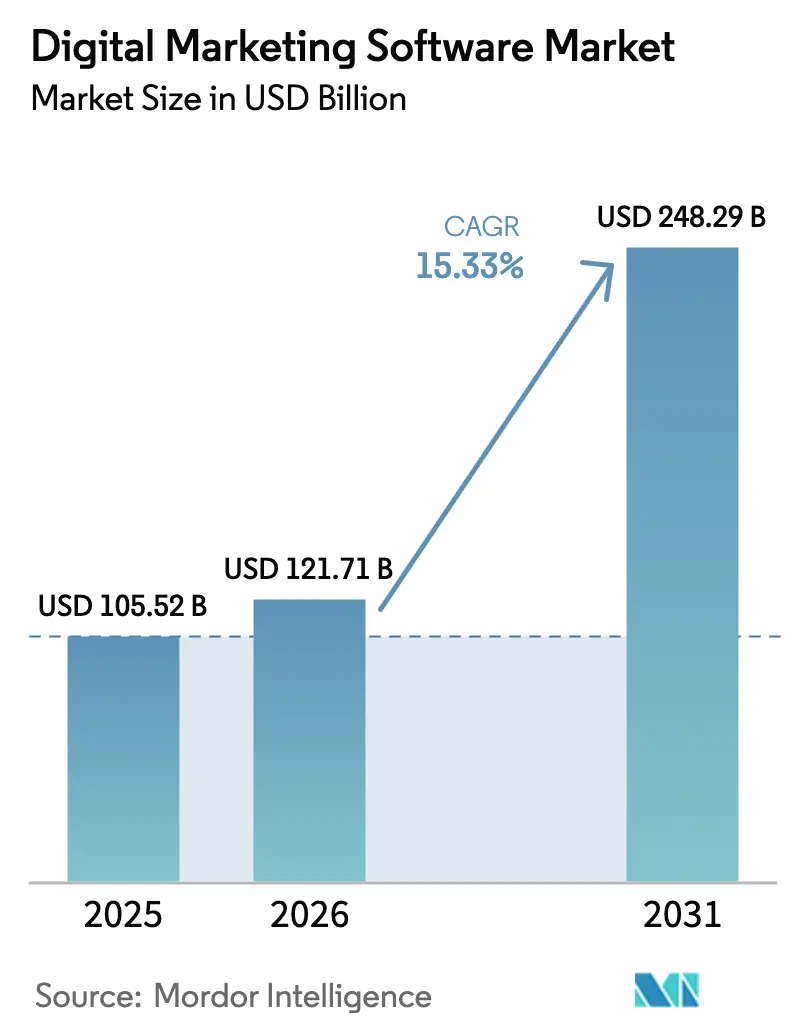
| Market Size (2026) | USD 121.71 Billion |
| Market Size (2031) | USD 248.29 Billion |
| Growth Rate (2026 - 2031) | 15.33% CAGR |
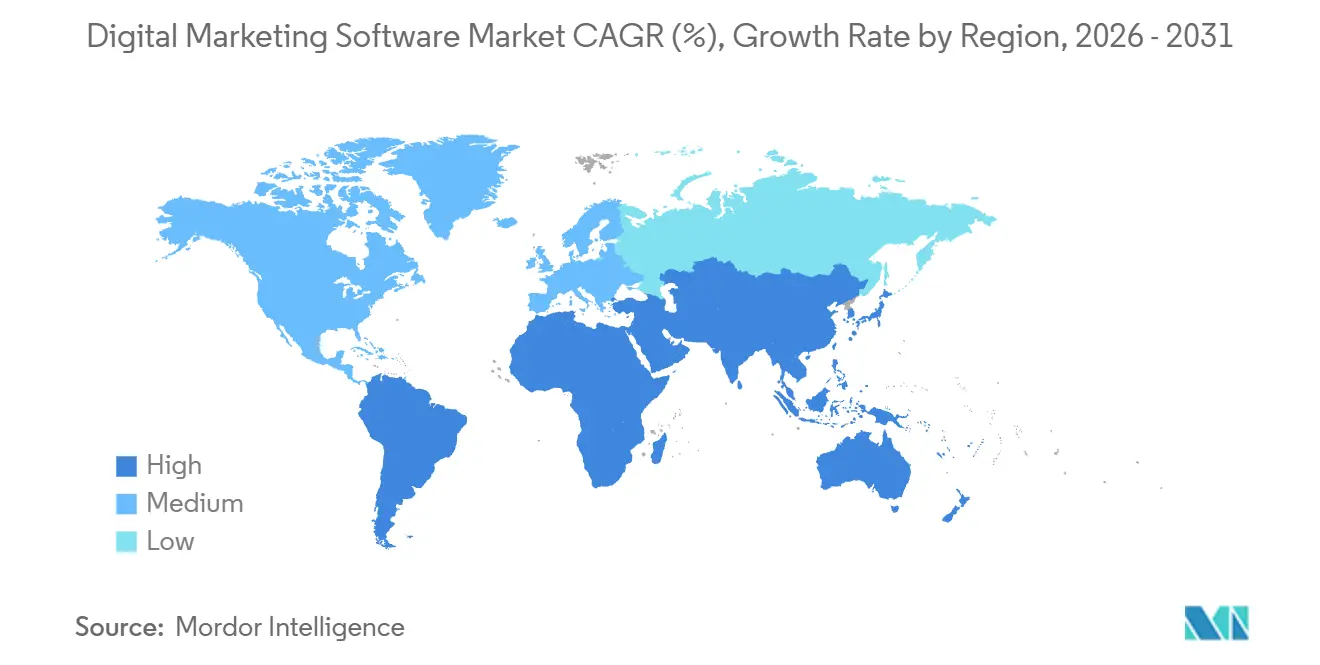
| Fastest Growing Market | Asia Pacific |
| Largest Market | North America |
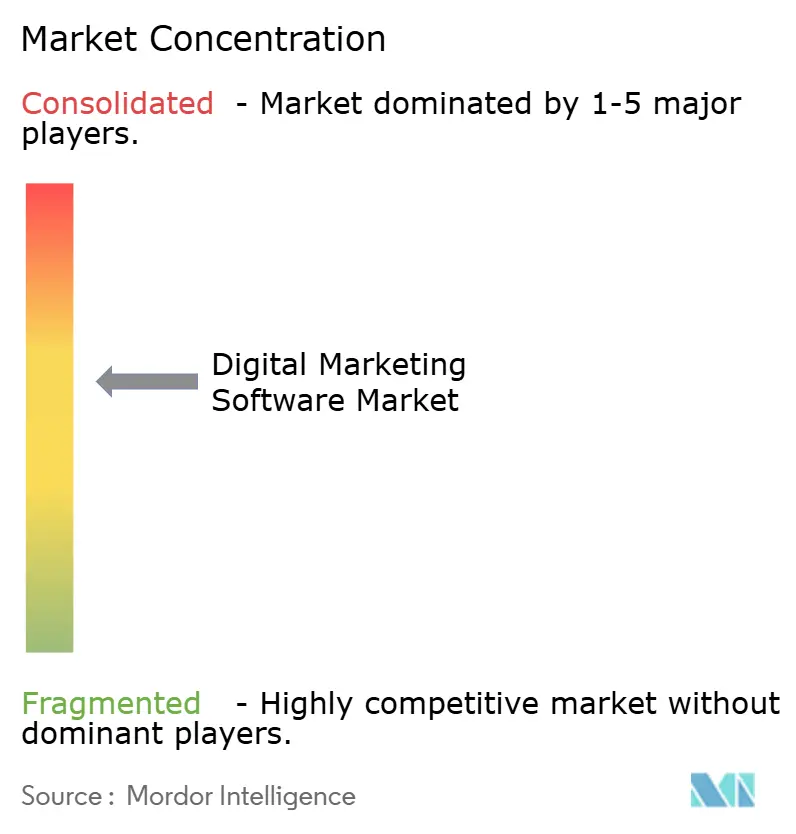
| Market Concentration | Medium |
Major Players *Disclaimer: Major Players sorted in no particular order Image © Mordor Intelligence. Reuse requires attribution under CC BY 4.0. | |
Digital Marketing Software Market Analysis by Mordor Intelligence
The Digital Marketing Software Market size is expected to increase from USD 105.52 billion in 2025 to USD 121.71 billion in 2026 and reach USD 248.29 billion by 2031, growing at a CAGR of 15.33% over 2026-2031. Heightened demand for generative-AI content engines, zero-party data strategies, and embedded modules inside vertical SaaS platforms has made the category one of the fastest-moving branches of enterprise applications. Cloud deployment, already the default delivery model, continues to widen its lead as budget owners shift capital expenditure to operating expenditure and as latency-sensitive edge architectures mature. Momentum is strongest among small and mid-sized enterprises because self-serve onboarding and usage-based pricing compress time-to-value, while services revenue is expanding faster than software as customers seek integration and change-management support. Vendors that couple marketing workflows with CRM, commerce, or payment capabilities are capturing early mindshare, whereas pure-play suites face lengthier sales cycles, steeper proof-of-concept requirements, and higher churn.
Key Report Takeaways
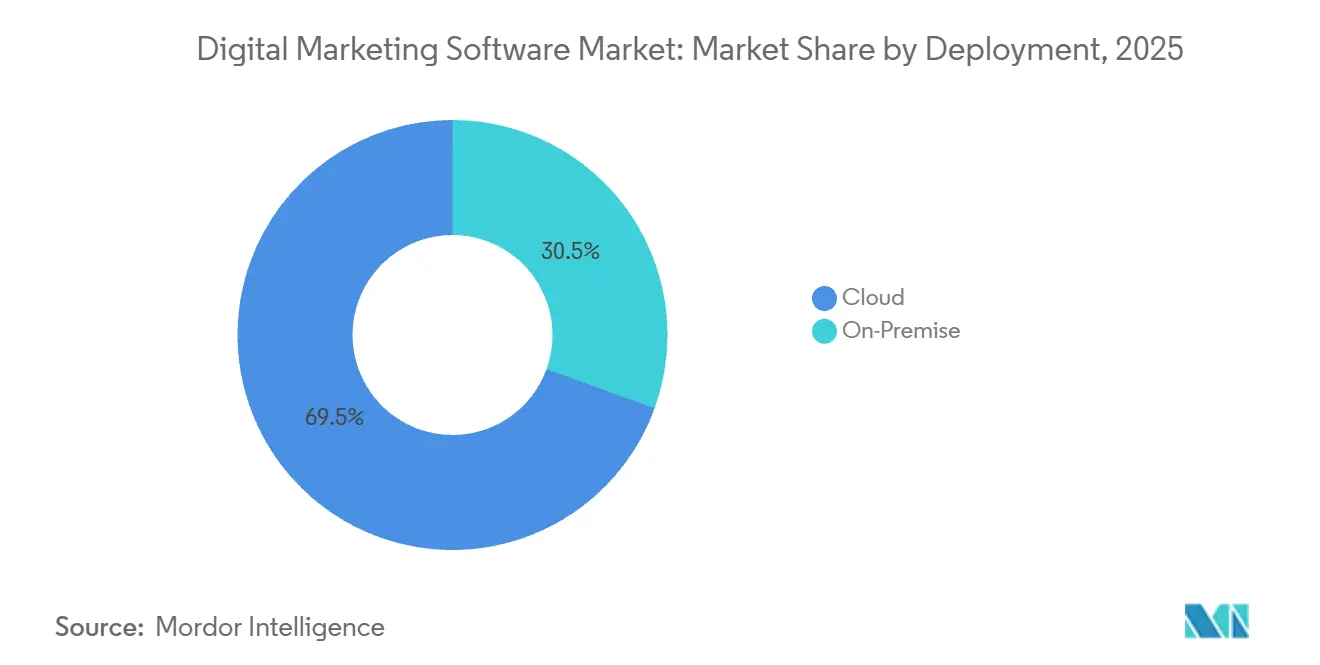
- By deployment, cloud solutions held 69.47% of digital marketing software market share in 2025, and the segment is forecast to expand at a 15.41% CAGR through 2031.
- By component, services revenue is advancing at a 16.13% CAGR, surpassing software licenses as enterprises budget for implementation and managed-service bundles. The software component held 60.13% of digital marketing software market share in 2025.
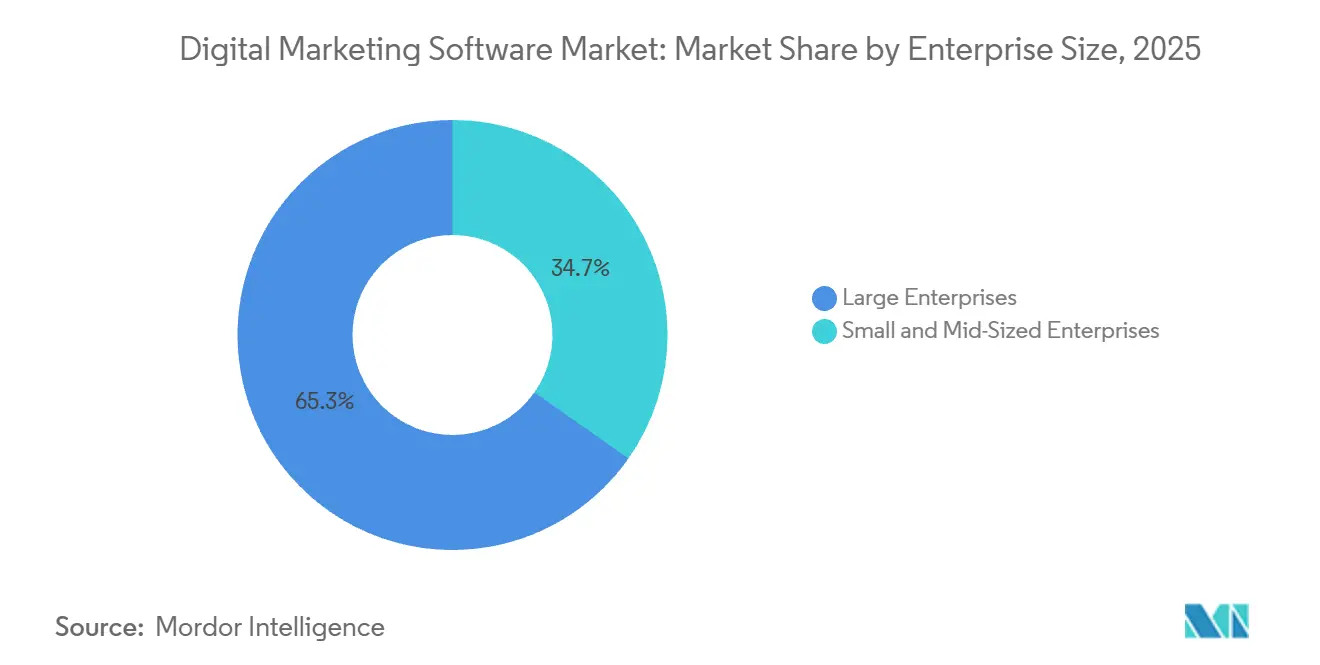
- By enterprise size, SMEs are projected to grow 15.64% annually through 2031, far outpacing large-enterprise outlays; large enterprises held 65.26% of digital marketing software market share in 2025.
- By end-user industry, healthcare and life sciences are expected to post the fastest 16.12% CAGR, while retail and e-commerce maintained a 28.29% revenue share in 2025.
- By geography, North America contributed 35.54% of 2025 revenue, yet Asia Pacific is tracking a 16.27% CAGR on the strength of mobile-first commerce.
Note: Market size and forecast figures in this report are generated using Mordor Intelligence’s proprietary estimation framework, updated with the latest available data and insights as of January 2026.
Global Digital Marketing Software Market Trends and Insights
Drivers Impact Analysis*
| Driver | (~) % Impact on CAGR Forecast | Geographic Relevance | Impact Timeline |
|---|---|---|---|
| Surge in Digital-First Customer Journeys | +3.2% | Global, with accelerated adoption in APAC and Middle East | Medium term (2-4 years) |
| Cloud-Native SaaS Cost Advantages | +2.8% | Global, particularly North America and Europe | Short term (≤ 2 years) |
| AI-Powered Content and Campaign Optimization | +3.5% | Global, led by North America and APAC technology hubs | Medium term (2-4 years) |
| Omnichannel Engagement Demand from B2C and B2B | +2.6% | Global, with B2B concentration in North America and Europe | Medium term (2-4 years) |
| Zero-Party Data and Cookieless Personalization | +2.4% | Europe and North America core, expanding to APAC | Long term (≥ 4 years) |
| Embedded "One-Click" Marketing in Vertical SaaS and Payments Platforms | +2.1% | North America and APAC, spill-over to South America | Short term (≤ 2 years) |
| Source: Mordor Intelligence | |||


AI-Powered Content and Campaign Optimization
Generative models are collapsing creative-production timelines from weeks to hours, letting marketers spin up localized ads, email sequences, and landing pages at scale without proportional headcount increases. Adobe embedded its Firefly engine into Experience Cloud in 2025 and reported 20-30% lower creative costs among early enterprise adopters.[1]Adobe Inc., “Firefly Integration Announcement,” adobe.com Salesforce exposed Einstein GPT across Marketing Cloud, boosting open rates 15-25% during pilots with retail and financial-services clients. Sectors with extensive product catalogs, including apparel, grocery, and consumer electronics, gain the most because manual asset creation breaks down past certain SKU counts. Yet data-science skills remain scarce, so vendors are monetizing managed services that package platform access with AI-strategy workshops. This services overlay explains why services revenue is rising faster than pure software subscriptions.
Zero-Party Data and Cookieless Personalization
Full Chrome cookie deprecation slated for late 2026 is forcing marketers to pivot toward volunteered data captured through preference centers, quizzes, and loyalty programs. Retailers such as Sephora and Nike deepened preference-center functionality in 2025, lifting email click-through rates 18-22% versus cookie-based cohorts. European enforcement of the Digital Markets Act standardized consent language, increasing compliance costs but also giving legal cover for uniform data-collection flows. Platforms that bundle consent orchestration with CDP capabilities (OneTrust, TrustArc, Adobe, Salesforce) see stronger renewals, while point solutions without native consent pipes risk latency that undercuts real-time personalization.
Surge in Digital-First Customer Journeys
Digital channels now drive more than 60% of customer interactions in banking, insurance, and B2B procurement, a ratio that has held steady since pandemic-era peaks. The permanence of online engagement is consolidating point solutions into unified clouds spanning email, SMS, push, and in-app messaging. HubSpot logged a 40% year-over-year jump in customers adopting its full-stack Marketing Hub during 2025. Industrial suppliers are following retail playbooks by layering account-based targeting and intent scoring atop standard lead-nurture tracks. Standalone email or social-publishing tools that lack workflow automation or CRM connectors face sliding renewal rates, while platforms that stitch marketing into broader customer-experience suites capture the bulk of expansion budgets.
Embedded One-Click Marketing in Vertical SaaS Platforms
Shopify, Square, GoDaddy, and other vertical SaaS players are baking marketing features directly into storefront, payment, and scheduling flows. Shopify merchants sent more than 10 billion messages through embedded Email and SMS modules in 2025, up 35% from 2024. Square added automated re-engagement campaigns tied to point-of-sale data, generating USD 200 million in incremental merchandise volume within six months. By collapsing the gap between transaction capture and campaign execution, these vendors win budgets before SMEs even evaluate standalone martech suites. Standalone platforms, therefore, race to deepen native connectors. Klaviyo’s real-time Shopify integration now syncs catalogs and order histories in seconds.
Restraints Impact Analysis*
| Restraint | (~) % Impact on CAGR Forecast | Geographic Relevance | Impact Timeline |
|---|---|---|---|
| Integration Complexity with Legacy Martech Stacks | -1.8% | Global, concentrated in North America and Europe | Short term (≤ 2 years) |
| Data-Privacy and Consent-Management Compliance Costs | -1.5% | Europe and North America, expanding to APAC | Medium term (2-4 years) |
| Rising Unit Prices for First-Party Data Enrichment | -1.1% | Global, with higher impact in mature markets | Medium term (2-4 years) |
| CX Talent Shortage for AI-Led Campaign Design | -0.9% | Global, acute in North America and Western Europe | Long term (≥ 4 years) |
| Source: Mordor Intelligence | |||
Integration Complexity with Legacy Martech Stacks
Enterprises commonly run 15-30 discrete marketing tools, and every additional API or schema mismatch compounds maintenance overhead. Monolithic suites built a decade ago often lack modular, API-first design, forcing IT teams to craft brittle connectors that break on vendor updates. Financial-services and healthcare organizations face added hurdles because audit trails and lineage tracking must span every system. Composable CDP architectures from providers such as Segment and mParticle offer a path to standard data pipes, yet uptake is slow where entrenched ERP or CRM deployments resist structural change. High integration cost therefore acts as a switching deterrent, bolstering incumbent renewal rates even when feature depth lags newer entrants.
Data-Privacy and Consent-Management Compliance Costs
Regulatory divergence across GDPR, CPRA, LGPD, and PIPL obliges multinationals to maintain region-specific pipelines for consent, storage, and deletion. Design teams must rebuild interfaces to avoid “dark patterns,” and engineering teams must enforce real-time consent checks before data activation. Penalties of up to 4% of global revenue under GDPR encourage conservative rollouts that delay campaign launches and shrink addressable segments. Vendors with certified consent modules bundled into their clouds reduce customer effort, whereas mid-market point solutions lacking legal resources either pivot to less-regulated verticals or absorb margin compression to fund compliance roadmaps.
*Our forecasts treat driver/restraint impacts as directional, not additive. The impact forecasts reflect baseline growth, mix effects, and variable interactions.
Segment Analysis
By Deployment: Cloud Dominance Accelerates with Edge Computing
Cloud-based offerings accounted for 69.47% of digital marketing software market share in 2025 and are on track for a 15.41% CAGR through 2031, reinforcing the asset-light preference of new buyers. Microsoft added more than 5,000 net-new Dynamics 365 Marketing accounts during 2025, many of which were migrating from on-premise systems.[2]Microsoft Corp., “Dynamics 365 Marketing Customer Growth,” microsoft.com On-premise stacks linger in regulated verticals that mandate data residency, but hybrid architectures now route analytics and campaign execution to the cloud while retaining sensitive identifiers on-site, blurring historical boundaries.
Edge deployments form a nascent third pillar, particularly for latency-sensitive personalization scenarios such as kiosk recommendations or in-app offers that cannot tolerate round-trip network delays. Salesforce and Adobe both pilot edge caches that store lightweight customer profiles locally, promising millisecond-level decisioning at point of interaction. If adoption broadens, the digital marketing software market size attributable to edge nodes could carve out a distinct revenue stream within five years.

By Component: Services Surge as Integration Demands Escalate
Software licenses still generated 60.13% of revenue in 2025, yet services lines such as implementation, integration, training, and managed campaigns are accelerating at a 16.13% CAGR. Accenture scaled its marketing-technology workforce by 2,000 specialists during 2025 to meet demand for Adobe, Salesforce, and Oracle rollouts. AI-heavy engagements command premiums because model tuning, feature engineering, and MLOps oversight exceed traditional configuration scope.
Vendors increasingly embed onboarding and success managers inside subscription tiers, converting one-time fees into recurring services annuities. This format stabilizes monthly recurring revenue and simplifies procurement for customers that prefer a single invoice. Over time, service-attached contracts could lift gross margin volatility, though they also raise capacity-management risk for vendors that lack global delivery footprints.
By Enterprise Size: SMEs Drive Volume Growth
Large enterprises retained 65.26% of 2025 spend, while SMEs are the fastest-growing cohort, with a 15.64% CAGR through 2031. Mailchimp, now inside Intuit, counted more than 13 million active users last year, 90% of whom are classified as SMEs. Zoho Marketing Plus, priced at USD 50 per month, added 8,000 accounts in 2025.
Drag-and-drop builders, freemium tiers, and template libraries lower the skills barrier, while usage-based pricing aligns cost with cash flow. As SME platforms mature, they begin layering governance, audit, and single-sign-on features that appeal to mid-market firms, potentially compressing the enterprise ASP premium that incumbents enjoy today.
By End-User Industry: Healthcare Leads Growth as Retail Matures
Retail and e-commerce accounted for 28.29% of revenue in 2025, underpinned by large SKU catalogs and promotional cadences that require automated testing. However, persistent margin compression is shifting focus from broad-reach campaigns to loyalty-data-driven micro-segmentation. The healthcare and life-sciences segment is forecast to post a 16.12% CAGR, the fastest in the forecast window, aided by policy updates that allow direct-to-patient outreach under tighter consent frameworks and by pharmaceutical companies automating clinical-trial recruitment.
Pfizer and Novartis both deployed AI-enabled patient-engagement platforms in 2025, trimming trial enrollment timelines by nearly one-quarter. Banking, telecom, and media each represent between 12-18% of revenue, with financial institutions prioritizing audit-ready consent logs and broadcasters unifying subscription and ad-inventory data. Manufacturing, once a laggard, is adopting configurators and instant quoting, pulling CRM and marketing closer together.
Geography Analysis
North America contributed 35.54% of global revenue in 2025. Market maturity means most Fortune 500 companies have already rationalized sprawling stacks into two or three core platforms. Growth now pivots on optimization modules AI asset generation, real-time CDPs, and journey analytics and on mid-market rollouts in Canada and Mexico. California’s CPRA keeps privacy engineering top of mind, while the pending American Data Privacy and Protection Act may add federal oversight. Cross-border data flows remain relatively smooth inside the United States-Mexico-Canada corridor, accelerating regional vendor deployments.
Asia Pacific is expanding at a 16.27% CAGR through 2031, faster than any other region, propelled by mobile-first commerce across India, Indonesia, Vietnam, and the Philippines. Smartphone penetration above 70% and rising disposable income are steering ad budgets from social-network auctions toward owned marketing clouds that minimize dependency risk. Domestic Chinese vendors dominate inside mainland borders due to PIPL localization mandates, yet Japanese and South Korean enterprises exhibit high adoption of global suites with localized compliance extensions. ASEAN startups gravitate to pay-as-you-grow pricing, making the region a laboratory for tiered usage models that could eventually filter into mature markets.
Europe accounted for roughly 28% of 2025 spend. GDPR enforces strict consent regimes, prompting steady demand for platforms with built-in audit trails and geographic data fences. Germany, France, and the United Kingdom remain the largest contributors, while the Nordics display outsized AI module uptake relative to population. Southern European adoption trails because of legacy infrastructure and smaller IT budgets, although tourism and retail digitization programs are narrowing the gap. The Middle East and Turkey are investing under national diversification plans, and Brazil anchors South American demand despite currency volatility. Africa’s nascent markets rely on mobile-money rails to join digital commerce, offering greenfield upside for light-weight, cloud-native suites.

Competitive Landscape
The five largest vendors, Adobe, Salesforce, Oracle, Microsoft, and Google, command a combined major share of 2025 revenue, indicating moderate concentration. Adobe couples the Experience Cloud with the Creative and Document Clouds, making switching an expensive, multi-workstream exercise. Salesforce leverages acquisitions such as Tableau, MuleSoft, and Slack to cross-sell analytics, integration, and collaboration, inflating customer lifetime value by up to one-third. Google’s ad-tech heritage gives it data-science heft, though enterprise buying centers sometimes balk at channel conflict between Google marketing additional services and in-house teams.
Challengers such as HubSpot, Klaviyo, and Braze compete on ease of use, transparent pricing, and rapid implementation. Their composable APIs slot into headless commerce and custom CRM back ends, resonating with product-led growth companies unwilling to adopt monolithic suites. Vertical SaaS entrants capture green-field budgets by embedding marketing features at the point of payment or booking, often before merchants realize they are adopting martech.
Emerging disruptors exploit edge computing and event-stream dataflows, letting clients toggle best-of-breed modules in or out as objectives evolve. Segment, now inside Twilio, routes more than 400 billion monthly API calls that feed analytics, personalization, and support tools without duplicate data pipes. Adobe lodged 47 AI-focused patents during 2025, covering image generation, tone adaptation, and predictive personalization.[3]United States Patent and Trademark Office, “Adobe AI Patent Filings,” uspto.gov Sustained R&D investment will likely intensify the gulf between full-suite leaders and mid-tier vendors that lack comparable engineering budgets.
Digital Marketing Software Industry Leaders
Adobe Inc.
Salesforce Inc.
Oracle Corporation
SAP SE
Microsoft Corporation
- *Disclaimer: Major Players sorted in no particular order

Recent Industry Developments
- December 2025: Salesforce announced the USD 1.9 billion acquisition of Own Company, expanding cloud-data protection and backup capabilities for regulated-sector clients.
- November 2025: Adobe launched Experience Platform AI Assistant, reducing campaign setup time by up to 30% for early adopters.
- October 2025: HubSpot introduced HubSpot Breeze, bundling AI content generation, lead enrichment, and predictive scoring into its core license.
- September 2025: Klaviyo deepened its Shopify integration to include real-time inventory triggers for automated promotions.


Research Methodology Framework and Report Scope
Market Definitions and Key Coverage
Our study defines the digital marketing software market as all on-premise and cloud platforms that plan, execute, measure, and optimize marketing activities across web, mobile, social, email, search, and emerging channels. Tools included range from customer-relationship and content-management modules to marketing-automation and campaign-management suites, provided they are licensed as stand-alone software or SaaS.
Scope Exclusion: Advertising agency services, creative production outsourcing, and pure analytics engines that are not bundled with campaign execution features are left outside our boundary.
Segmentation Overview
- By Deployment
- Cloud
- On-Premise
- By Component
- Software
- Services
- By End-User Enterprise Size
- Large Enterprises
- Small and Mid-Sized Enterprises
- By End-User Industry
- IT and Telecom
- Media and Entertainment
- BFSI
- Retail and E-Commerce
- Manufacturing
- Healthcare and Life Sciences
- Other End-User Industries
- By Geography
- North America
- United States
- Canada
- Mexico
- Europe
- Germany
- United Kingdom
- France
- Italy
- Spain
- Russia
- Rest of Europe
- Asia Pacific
- China
- Japan
- India
- South Korea
- ASEAN
- Australia and New Zealand
- Rest of Asia Pacific
- South America
- Brazil
- Argentina
- Rest of South America
- Middle East
- Saudi Arabia
- UAE
- Turkey
- Rest of Middle East
- Africa
- South Africa
- Nigeria
- Rest of Africa
- North America
Detailed Research Methodology and Data Validation
Primary Research
We then interviewed enterprise marketing leaders, Martech software product heads, regional channel partners, and digital-first SMEs across North America, Europe, and Asia-Pacific. These conversations validated license fee patterns, renewal rates, and cloud migration timelines while highlighting region-specific compliance or privacy headwinds that influence spending plans.
Desk Research
Mordor analysts first assembled baseline inputs from open, high-integrity sources such as the Interactive Advertising Bureau, World Bank broadband data, U.S. Federal Communications Commission filings, Eurostat ICT surveys, and patent counts pulled through Questel. Company 10-Ks, investor decks, and trade association white papers further clarified revenue splits and adoption curves. Select subscription databases, including D&B Hoovers for vendor financials and Dow Jones Factiva for deal tracking, enriched the evidence pool. The sources listed are illustrative; many additional public and paid references supported data capture and checks.
Market-Sizing & Forecasting
A top-down construct begins with worldwide business ICT outlays, which are filtered through digital advertising share, average software allocation, and penetration ratios by vertical. Select bottom-up roll-ups, vendor reported revenue, sampled ASP × seat counts, and regional channel checks test the totals and adjust for under-reported cloud subscriptions. Key model variables include SaaS price erosion, marketing automation adoption in SMEs, paid social ad growth, GDPR-driven consent tool uptake, and generative-AI feature premiums. Forecasts employ a multivariate regression that links these drivers to historical spend, with scenarios stress-tested by primary experts. Gaps where vendor splits are opaque are bridged using peer benchmarks and three-year moving averages.
Data Validation & Update Cycle
Outputs pass variance screens against independent spend trackers; anomalies trigger analyst re-contact before sign-off. Reports refresh every twelve months, with mid-cycle revisions when material events, large acquisitions, policy shifts, or macro shocks alter demand assumptions. A final pre-publication sweep ensures clients receive the most current view.
Why Mordor's Digital Marketing Software Baseline Deserves Dependability
Published estimates often diverge because firms pick different modules, price points, and refresh cadences before projecting growth.
Key gap drivers include narrower module lists, one-off surveys that miss fast-rising SaaS fees, exchange-rate misalignment, and infrequent model updates that overlook AI-led premium pricing. Mordor's scope, annual refresh, and dual-path validation mitigate these pitfalls.
Benchmark comparison
| Market Size | Anonymized source | Primary gap driver |
|---|---|---|
| USD 105.33 B (2025) | Mordor Intelligence | - |
| USD 86.27 B (2025) | Global Consultancy A | Excludes content management suites and applies pre-COVID adoption ratios |
| USD 109.36 B (2025) | Trade Journal B | Adds ancillary ad-tech spend and assumes uniform AI premium globally |
The comparison shows that while other publishers land meaningfully higher or lower, their differences stem from scope or outdated assumptions. Mordor's disciplined variable selection, timely primary checks, and transparent model logic give decision-makers a balanced, repeatable baseline they can trust.


Key Questions Answered in the Report
How large is the global digital marketing software market in 2026?
The digital marketing software market size stood at USD 121.71 billion in 2026.
What CAGR is projected for digital marketing software between 2026 and 2031?
Revenue is forecast to grow at 15.33% annually through 2031.
Which segment of digital marketing software grows fastest, software or services?
Services are expanding at a 16.13% CAGR as buyers seek integration and managed support.
Why are SMEs adopting digital marketing platforms so rapidly?
Self-serve onboarding, freemium tiers, and usage-based pricing lower technical and financial barriers, yielding a 15.64% CAGR for SME spend.
Which end-user industry is expected to post the strongest growth?
Healthcare and life sciences lead with a projected 16.12% CAGR through 2031.
Which region offers the highest growth rate for vendors?
Asia Pacific is forecast to grow 16.27% per year, driven by mobile-first commerce and local SaaS adoption.
Page last updated on:


