Retail Logistics Market Size and Share
Market Overview
| Study Period | 2020 - 2031 |
|---|---|
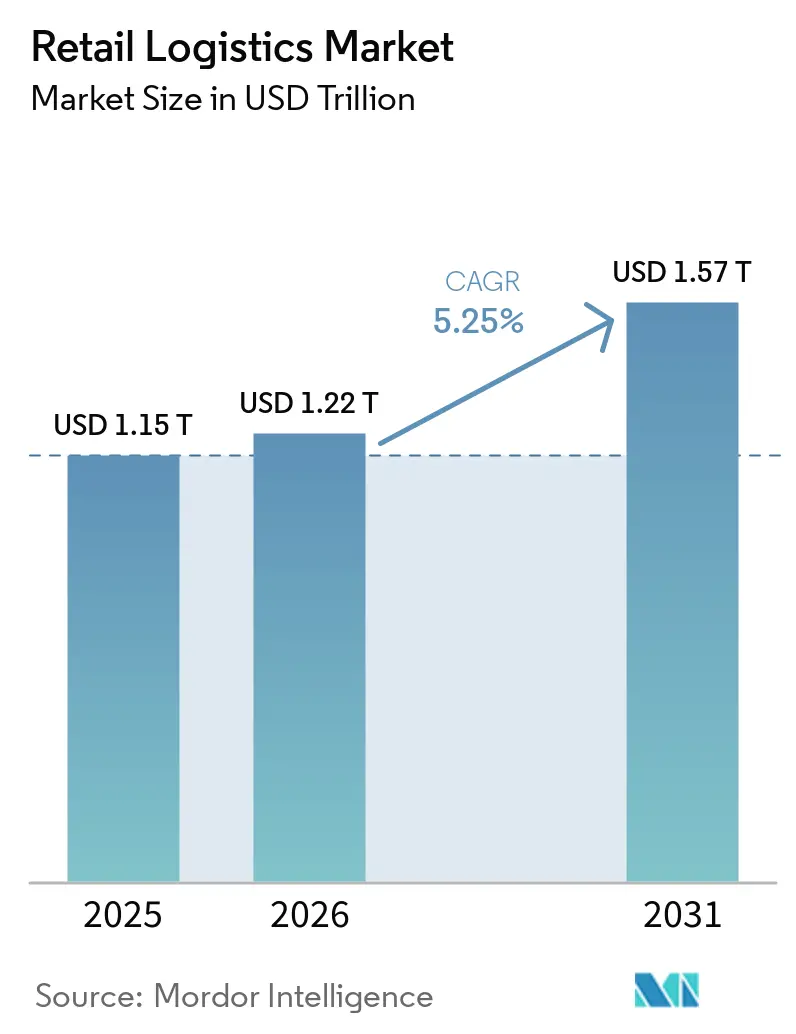
| Market Size (2026) | USD 1.22 Trillion |
| Market Size (2031) | USD 1.57 Trillion |
| Growth Rate (2026 - 2031) | 5.25% CAGR |
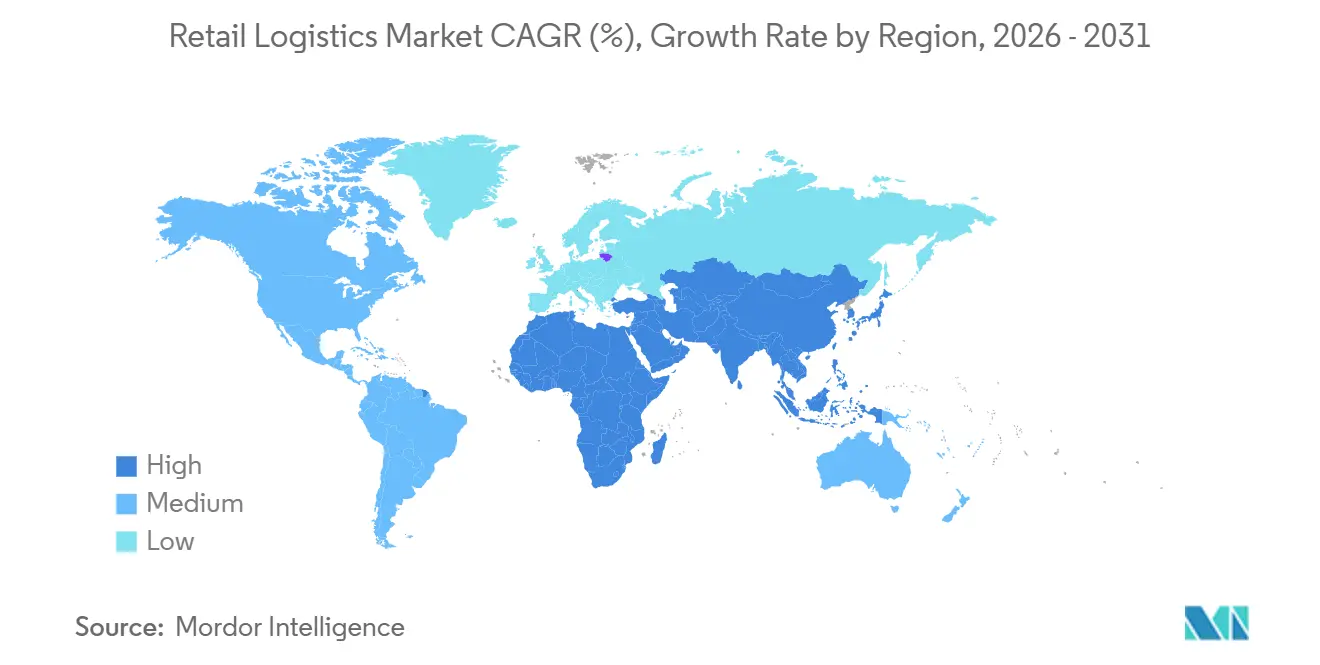
| Fastest Growing Market | Asia Pacific |
| Largest Market | Asia Pacific |
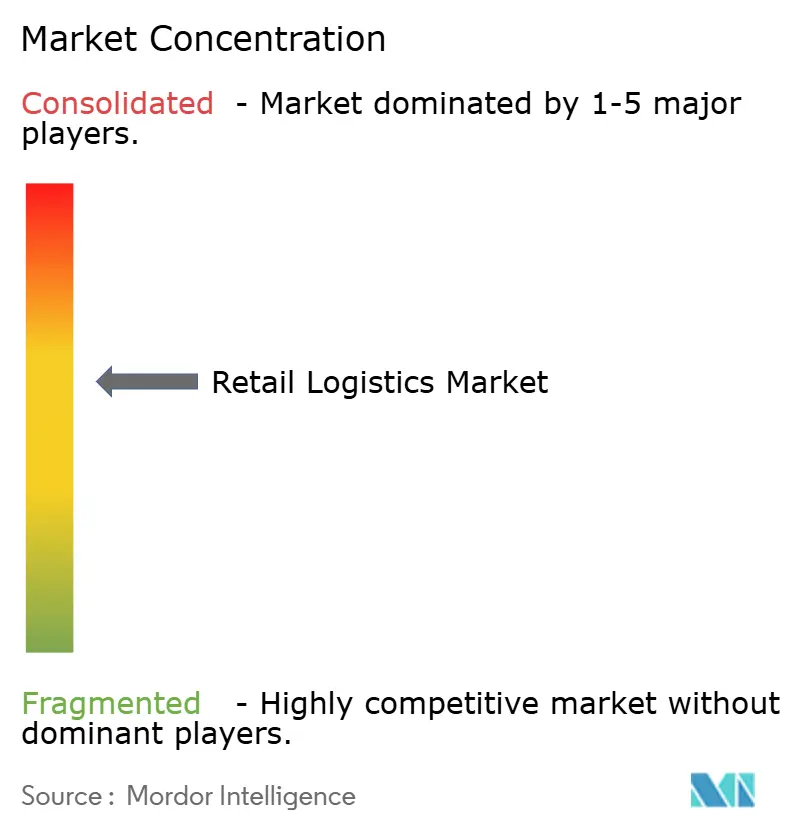
| Market Concentration | Medium |
Major Players *Disclaimer: Major Players sorted in no particular order Image © Mordor Intelligence. Reuse requires attribution under CC BY 4.0. | |
Retail Logistics Market Analysis by Mordor Intelligence
The Retail logistics market size is projected to expand from USD 1.15 trillion in 2025 and USD 1.22 trillion in 2026 to USD 1.57 trillion by 2031, registering a 5.25% CAGR between 2026 and 2031.
Automation roll-outs, subscription-commerce volumes, and blockchain traceability mandates are combining to reconfigure fulfillment economics, especially in last-mile and reverse-logistics settings. Delivery-robot deployments are moving beyond pilots, giving large retailers cost advantages through route-density optimization. At the same time, circular retail models are spurring demand for authentication and refurbishment services that outpace basic transport growth. Regionally, Asia-Pacific’s urban hubs continue to attract the bulk of new warehouse automation investments, while North American providers focus on vertical warehousing to offset land scarcity. Across all geographies, environmental, social, and governance (ESG) audits are elevating demand for carbon-accounting platforms that convert compliance costs into margin-protective insights.[1]U.S. Environmental Protection Agency, “National Recycling Strategy,” epa.gov
Key Report Takeaways
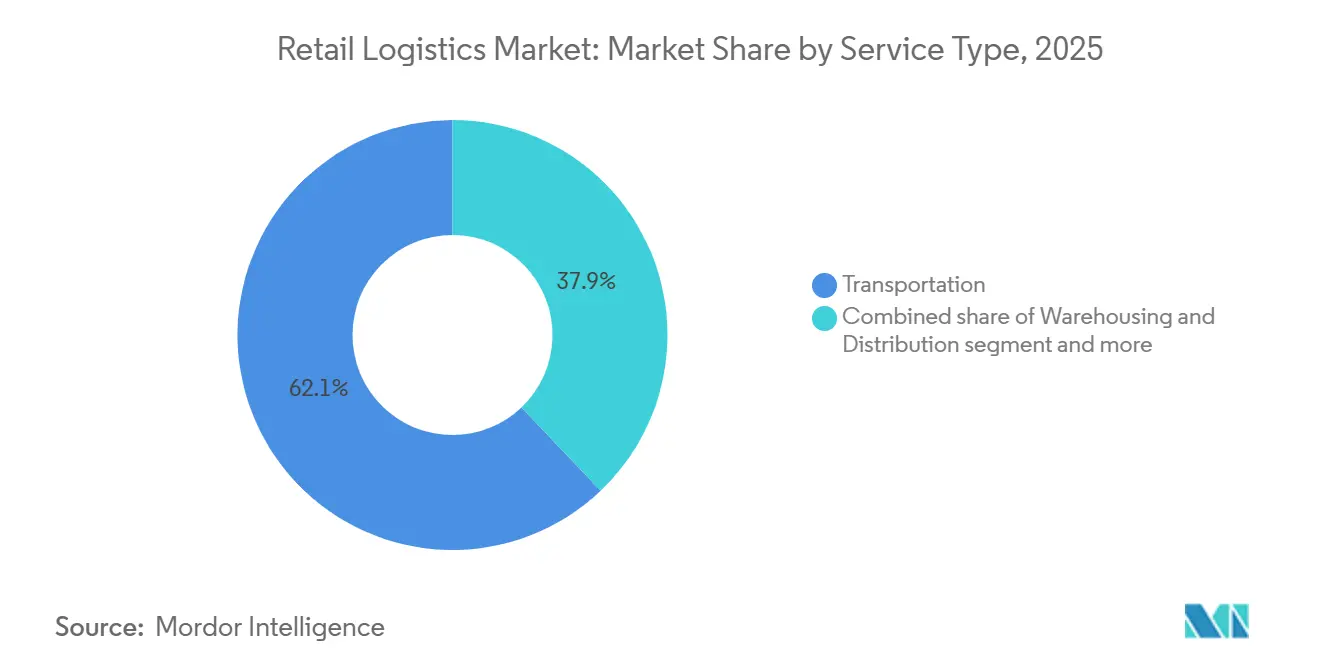
- By service type, transportation held 62.1% of the retail logistics market share in 2025, while value-added services are advancing at a 6.5% CAGR to 2031.
- By product, foods and beverages accounted for 32.6% of the retail logistics market size in 2025; fashion and lifestyle is forecast to expand at a 6.2% CAGR through 2031.
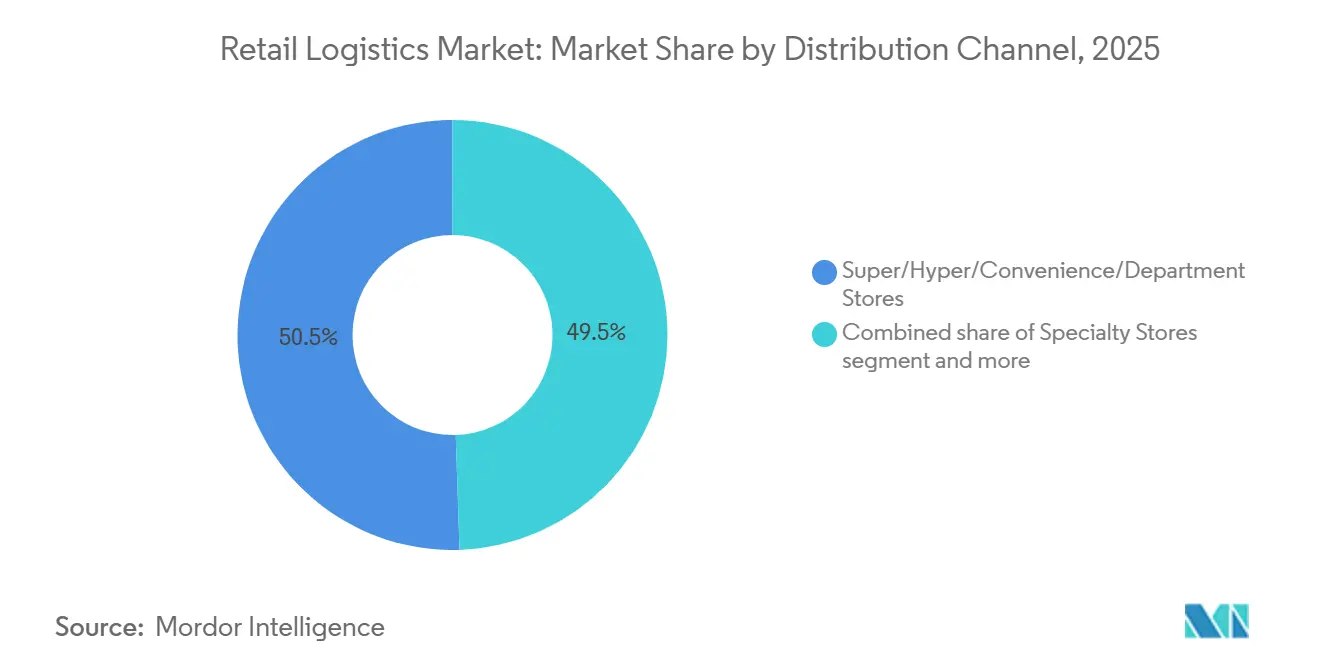
- By distribution channel, super, hyper, convenience, and department stores combined for 50.5% of the retail logistics market in 2025, whereas online channels are growing fastest at an 8.9% CAGR.
- By geography, Asia-Pacific led with 39.8% share of the Retail logistics market in 2025 and remains the fastest-growing region at a 6.9% CAGR to 2031.
Note: Market size and forecast figures in this report are generated using Mordor Intelligence’s proprietary estimation framework, updated with the latest available data and insights as of January 2026.
Global Retail Logistics Market Trends and Insights
Drivers Impact Analysis*
| Drivers | (~) % Impact on CAGR Forecast | Geographic Relevance | Impact Timeline |
|---|---|---|---|
| Scale deployment of autonomous delivery robots and drones | +1.3% | North America, Asia-Pacific urban centers, expanding to Europe | Medium term (2–4 years) |
| Growth of resale and circular retail spurring reverse-logistics platforms | +1.0% | Global, North America, and Europe lead | Medium term (2–4 years) |
| Cold-chain build-out for fresh grocery e-commerce | +0.9% | North America, Europe, and the Asia-Pacific cities | Medium term (2–4 years) |
| Subscription-commerce models stabilizing delivery demand | +0.8% | Global, mature e-commerce markets | Short term (≤2 years) |
| Retail media networks driving data-centric inventory positioning | +0.7% | North America, Europe, Asia-Pacific | Medium term (2–4 years) |
| Blockchain-based traceability mandates from major brands | +0.6% | Global, luxury, and pharma sectors lead | Long term (≥4 years) |
| Source: Mordor Intelligence | |||
Scale Deployment of Autonomous Delivery Robots and Drones
Autonomous delivery fleets continued to solidify their commercial scale through 2025. Building on earlier milestones such as Walmart surpassing 20,000 drone deliveries across seven U.S. states in early 2024, the sector saw significant ongoing expansion. Amazon’s Prime Air also expanded into the Phoenix metro area, underscoring a corporate goal of moving 500 million packages annually by aerial means before 2031. Ground-based robots from Starship Technologies now operate on over 60 university campuses and across more than 270 global locations, cutting last-mile costs by up to 60% for quick-commerce orders. Subscription programs supply the predictable order density needed to maximize battery usage and fleet turnaround times. As regulators issue sandbox permits in Asia-Pacific and Europe, cross-border technology standards are expected to converge, enabling further scale gains.
Growth of Resale / Circular Retail Spurring Reverse-Logistics Platforms
Circular retail activity is accelerating reverse-logistics investments, highlighted by DHL’s 2025 purchase of Inmar Supply Chain Solutions, which added 14 returns centers and 800 specialists to its North American network. Resale marketplaces such as ThredUp and Vestiaire Collective depend on high-throughput authentication lines that traditional forward networks cannot match. Brands are internalizing take-back loops, Patagonia’s Worn Wear and Lululemon’s Like New programs process returned goods for verified resale, protecting brand equity. Blockchain tagging verifies provenance and condition, building consumer trust while reducing counterfeit risk. Continued regulatory support for waste-reduction targets should keep funding flowing toward dedicated returns infrastructure.
Cold-Chain Build-Out for Fresh Grocery E-Commerce
Perishable e-commerce needs chill warehouses that cost up to four times more per square foot than ambient equivalents. U.S. grocery chains Kroger and Albertsons opened automated fulfillment centers in 2025 with robotic pick-to-tote lines operating at 34 °F zones, ensuring cart-to-cart integrity. IoT sensors monitor door-open intervals and trigger route re-sequencing if temperature drift occurs. Blockchain record-keeping shortens recall investigations from days to minutes, minimizing shrink. As the online share of fresh groceries rises, providers that master low-temperature logistics are set to command premium rates.[2]U.S. Food and Drug Administration, “Food Traceability Rule,” fda.gov
Subscription-Commerce Models Stabilizing Delivery Demand
Recurring order programs smooth demand spikes and improve trucking asset utilization. Amazon Subscribe & Save, a multibillion-dollar business line, lets planners pre-batch shipments and adjust warehouse picking sequences well in advance. Meal-kit operators HelloFresh and Blue Apron parallel this logic inside temperature-controlled micro-fulfillment centers that guarantee two-hour freshness windows. Predictable volumes anchor multi-year carrier contracts, cutting volatile spot-rate exposure. Optimized routing also shrinks average emissions per order, aligning with ESG scorecards and helping justify capital outlays for electric vans.
Restraints Impact Analysis*
| Restraints | (~) % Impact on CAGR Forecast | Geographic Relevance | Impact Timeline |
|---|---|---|---|
| Volatile cross-border tariffs impacting route economics | -1.0% | Global, North America–Asia lanes | Short term (≤2 years) |
| Warehouse real-estate scarcity in tier-1 metros inflating 3PL costs | -0.9% | North America, Europe, and the Asia-Pacific cities | Medium term (2–4 years) |
| ESG audit pressures elevating emissions-measurement capex | -0.6% | Europe leads, global rollout | Long term (≥4 years) |
| AI-skills shortage delaying digital-twin rollouts | -0.5% | Global, acute in developed markets | Medium term (2–4 years) |
| Source: Mordor Intelligence | |||
Volatile Cross-Border Tariffs Impacting Route Economics
Tariff swings on United States–China trade lanes altered landed-cost math several times in 2025, compelling retailers to dual-source from Mexico to hedge duty risks. Nearshoring demand drove UPS’s buyout of Estafeta, giving it express reach across 160 Mexican cities. Yet last-minute rule changes force carriers to renegotiate fuel-surcharge clauses, adding administrative friction. Elevated uncertainty pushes warehouse lessors to shorten contract terms, raising per-square-foot rates. The outlook suggests persistent volatility until multilateral trade forums settle on longer-cycle frameworks.
Warehouse Real-Estate Scarcity in Tier-1 Metros Inflating 3PL Costs
Industrial vacancy in Los Angeles and New York hovered near 6% in late 2025 as a multi-year low in construction completions kept urban markets tight. Zoning constraints and community pushback curb greenfield builds, while competing residential conversions shrink the footprint of legacy sites. Third-party logistics providers (3PLs) respond with multi-story facilities that slot mezzanine robots between floors, albeit at 25% higher capital intensity. Shared-use hubs spread the cost across multiple tenants but raise data-security concerns. Until zoning reform materializes, vertical warehousing remains the prime workaround.
*Our forecasts treat driver/restraint impacts as directional, not additive. The impact forecasts reflect baseline growth, mix effects, and variable interactions.
Segment Analysis
By Service Type: Transportation Dominates as Value-Added Services Accelerate
Transportation accounted for 62.1% of the retail logistics market share in 2025, reflecting the indispensable role of domestic road freight in last-mile fulfillment. Road carriers benefit from rich route networks that link warehouses to urban micro-hubs, while rail captures bulk upstream moves for cost efficiency. Sea lanes handle most cross-border volume, though tariff volatility is prompting lane diversification into alternate ports. Value-added services, although smaller, are registering a 6.5% CAGR and converting compliance pain points into premium revenue streams. Reverse logistics, product customization, and inspection lines enable retailers to support circular models without building proprietary infrastructure.
Automation is reshaping both ends of the service spectrum. Autonomous trucks are beginning hub-to-hub pilots on interstate corridors, while warehouse robots cut average pick times by 40% to 50%. DHL’s Inmar acquisition exemplifies the stitched-together model, merging transport density with specialized return centers. Blockchain add-ons verify product authenticity at handoff, giving value-added divisions a technology moat. As ESG audits tighten, carbon-counting dashboards are likely to migrate from consultancy upgrades into standard service-level agreements.[3]U.S. Securities and Exchange Commission, “Enhancement and Standardization of Climate-Related Disclosures,” sec.gov


By Product: Foods & Beverages Lead, Fashion & Lifestyle Grow Fastest
Foods and beverages held 32.6% of the retail logistics market size in 2025, sustained by cold-chain complexity that elevates switching costs for shippers. Grocery e-commerce requires chill docks, insulated totes, and strict time windows, driving providers to command premium rates for compliance. Blockchain food safety trackers reassure consumers after recalls, reinforcing the category’s logistical intensity. Fashion and lifestyle products, meanwhile, post a 6.2% CAGR on the back of blockchain traceability and booming resale demand. Luxury groups’ digital passports require scan points at every node, expanding the need for specialized scanners and secure cages inside hubs.
The two segments increasingly overlap in service innovations. Perishable fashion goods think temperature-sensitive cosmetics, borrow cold-chain learnings, while apparel resale models import food-grade sanitization standards for garment refurbishment. Value-added offerings thus span authentication for bags and temperature checks for berries under one digital roof, underscoring the convergence of service expectations.
By Distribution Channel: Store-Based Formats Still Rule as Online Surges
Super, hyper, convenience, and department stores captured 50.5% of 2025 revenue, buoyed by bulk-shipment economics and established replenishment rhythms. Yet online platforms are shooting ahead at an 8.9% CAGR as micro-fulfillment robotics add same-day capability to urban zones. Physical stores are doubling as click-and-collect depots, optimizing inventory turns while lowering last-mile costs. Subscription programs then refine demand forecasts, letting planners sync store replenishments with outbound parcel waves for curbside pickups.
Autonomous vehicles heighten the channel convergence. Drone docks on retail rooftops dispatch prepaid orders within 30 minutes, blurring the line between in-store and online fulfillment. Meanwhile, specialty stores use curated assortments to justify premium delivery fees, leveraging blockchain to certify limited-edition drops. The evolving mix challenges logistics providers to maintain node flexibility while meeting channel-specific service-level targets.
Geography Analysis
Asia-Pacific led the Retail logistics market with a 39.8% share in 2025 and is set to grow at a 6.9% CAGR through 2031. China’s government-designated autonomous-vehicle zones in Shanghai and Shenzhen carve out low-friction corridors for drone and robot testing, accelerating commercial deployments. India’s National Logistics Policy unlocks funding for freight corridors and cold-chain clusters, lowering barrier costs for fresh-food e-commerce. Southeast Asian smart-city blueprints in Singapore and Kuala Lumpur integrate digital twins that feed live traffic data into routing engines, keeping delivery windows tight despite urban congestion.[4]Shenzhen Municipal People's Government, “Regulations on the Administration of Intelligent Connected Vehicles,” sz.gov.cn
North America remains a technology testbed but wrestles with land scarcity in tier-1 metros, elevating lease rates and nudging 3PLs toward multi-story hubs. Warehouse automation uptake is high, yet ESG disclosure rules emanating from corporate clients push carriers to measure diesel usage down to the parcel. Cross-border dynamics with Mexico intensify as nearshoring relocates portions of consumer-electronics assembly closer to United States buyers, shortening transit times and insulating supply chains from tariff risk.
Europe focuses on emissions compliance, with the Corporate Sustainability Reporting Directive enforcing cradle-to-gate carbon tallies that reshape procurement checklists. Vertical integration of port and rail assets in Rotterdam and Hamburg provides corridor visibility for shippers juggling green quotas. Latin America captures spillover investment through UPS’s Estafeta network expansion, though infrastructure gaps and customs complexity temper growth. Middle East and Africa markets show patchy progress Gulf Cooperative Council states invest in bonded logistics parks, while many sub-Saharan countries prioritize road connectivity before high-tech upgrades can gain traction.
Mordor Intelligence provides coverage of the retail logistics market across other key regional markets. Detailed country-level analysis extends to United States incorporating local coverage and market participation, as required.

Competitive Landscape
The retail logistics market exhibits moderate concentration. Global incumbents are layering acquisitions and partnerships to defend their share in the Retail logistics market. DHL’s 2025 purchase of Inmar adds the continent’s largest returns network, giving the German giant first-mover credentials in circular retail. UPS’s Estafeta deal secures cross-border express dominance as U.S. retailers near-shore sourcing to Mexico. GEODIS acquired Keppel Logistics to deepen its presence in Southeast Asia, enhancing its contract-logistics playbook with 200,000 m² of warehouse space.
Technology heavyweights Walmart and Amazon reorient service benchmarks by scaling autonomous delivery at pace. Their in-house fulfillment arms set on-time delivery expectations that ratchet upward for the wider sector. Smaller 3PLs respond through alliances. Robotics startup Serve Robotics signed multi-city pilots with grocery chains that lack internal drone budgets but still seek last-mile differentiation.
Data platforms emerge as the next battleground. Carriers integrate adtech insights from retail media networks, transforming shipment forecasting accuracy. Providers unable to ingest SKU-level AI signals risk relegation to overflow capacity suppliers. ESG metrics carve another frontier as early adopters monetize carbon-efficiency dashboards in bids and entrench client relationships beyond rate sheets.
Retail Logistics Industry Leaders
DHL Supply Chain & Global Forwarding
UPS Supply Chain Solutions
FedEx Logistics
XPO Logistics
Kuehne + Nagel International
- *Disclaimer: Major Players sorted in no particular order

Recent Industry Developments
- April 2026: CEVA Logistics secured a two-year inland transport and customs contract with home equipment retailer But-Conforama, managing 9,600+ maritime import containers annually in France.
- April 2026: Kuehne+Nagel expanded its logistics partnership with retail design brand Casaideas in Chile, operating a new 30,000 m² semi-automated facility to support omnichannel and e-commerce distribution.
- February 2026: DHL Group signed an MoU with JD Logistics to integrate cross-border B2C fulfillment, enabling European retail brands to access the Chinese market and vice versa via JD's Joybuy platform.
- January 2026: Ryder System acquired Truck Service Depot to expand Torque by Ryder, strengthening its retail mobile fleet maintenance and logistics support network across the Southeastern United States.


Global Retail Logistics Market Report Scope
| Transportation | Road |
| Rail | |
| Air | |
| Sea and Inland Waterway | |
| Warehousing & Distribution | |
| Value-Added Services |
| Foods and Beverages |
| Personal and Household Care |
| Fashion and Lifestyle (accessories, apparel, footwear) |
| Furniture |
| Electronics and Household Appliances |
| Other Products |
| Super/Hyper/Convenience and Department Stores |
| Specialty Stores |
| Online |
| Other Channels |
| North America | United States |
| Canada | |
| Mexico | |
| South America | Brazil |
| Peru | |
| Chile | |
| Argentina | |
| Rest of South America | |
| Asia-Pacific | India |
| China | |
| Japan | |
| Australia | |
| South Korea | |
| South East Asia (Singapore, Malaysia, Thailand, Indonesia, Vietnam, and Philippines) | |
| Rest of Asia-Pacific | |
| Europe | United Kingdom |
| Germany | |
| France | |
| Spain | |
| Italy | |
| BENELUX (Belgium, Netherlands, and Luxembourg) | |
| NORDICS (Denmark, Finland, Iceland, Norway, and Sweden) | |
| Rest of Europe | |
| Middle East And Africa | United Arab Emirates |
| Saudi Arabia | |
| South Africa | |
| Nigeria | |
| Rest of Middle East and Africa |
| By Service Type | Transportation | Road |
| Rail | ||
| Air | ||
| Sea and Inland Waterway | ||
| Warehousing & Distribution | ||
| Value-Added Services | ||
| By Product | Foods and Beverages | |
| Personal and Household Care | ||
| Fashion and Lifestyle (accessories, apparel, footwear) | ||
| Furniture | ||
| Electronics and Household Appliances | ||
| Other Products | ||
| By Distribution Channel | Super/Hyper/Convenience and Department Stores | |
| Specialty Stores | ||
| Online | ||
| Other Channels | ||
| By Geography | North America | United States |
| Canada | ||
| Mexico | ||
| South America | Brazil | |
| Peru | ||
| Chile | ||
| Argentina | ||
| Rest of South America | ||
| Asia-Pacific | India | |
| China | ||
| Japan | ||
| Australia | ||
| South Korea | ||
| South East Asia (Singapore, Malaysia, Thailand, Indonesia, Vietnam, and Philippines) | ||
| Rest of Asia-Pacific | ||
| Europe | United Kingdom | |
| Germany | ||
| France | ||
| Spain | ||
| Italy | ||
| BENELUX (Belgium, Netherlands, and Luxembourg) | ||
| NORDICS (Denmark, Finland, Iceland, Norway, and Sweden) | ||
| Rest of Europe | ||
| Middle East And Africa | United Arab Emirates | |
| Saudi Arabia | ||
| South Africa | ||
| Nigeria | ||
| Rest of Middle East and Africa | ||


Key Questions Answered in the Report
What is the forecast value of the Retail logistics market by 2031?
It is projected to reach USD 1.57 trillion by 2031.
Which region is growing fastest in Retail logistics?
Asia-Pacific leads with a projected 6.9% CAGR from 2026 to 2031.
Which service segment has the highest 2025 share?
Transportation holds 62.1% of 2025 revenue.
Why are value-added services gaining momentum?
Circular retail and blockchain mandates drive demand for authentication and refurbishment streams growing at a 6.5% CAGR.
How do autonomous drones affect last-mile costs?
Commercial drone fleets can cut last-mile expenses by up to 60% when route density is high.
What is the key restraint for warehouse expansion?
Tier-1 land scarcity pushes vacancy rates near 6%, inflating lease costs and spurring vertical-warehouse designs.
Page last updated on:


