On-demand Logistics Market Size and Share
Market Overview
| Study Period | 2020 - 2031 |
|---|---|
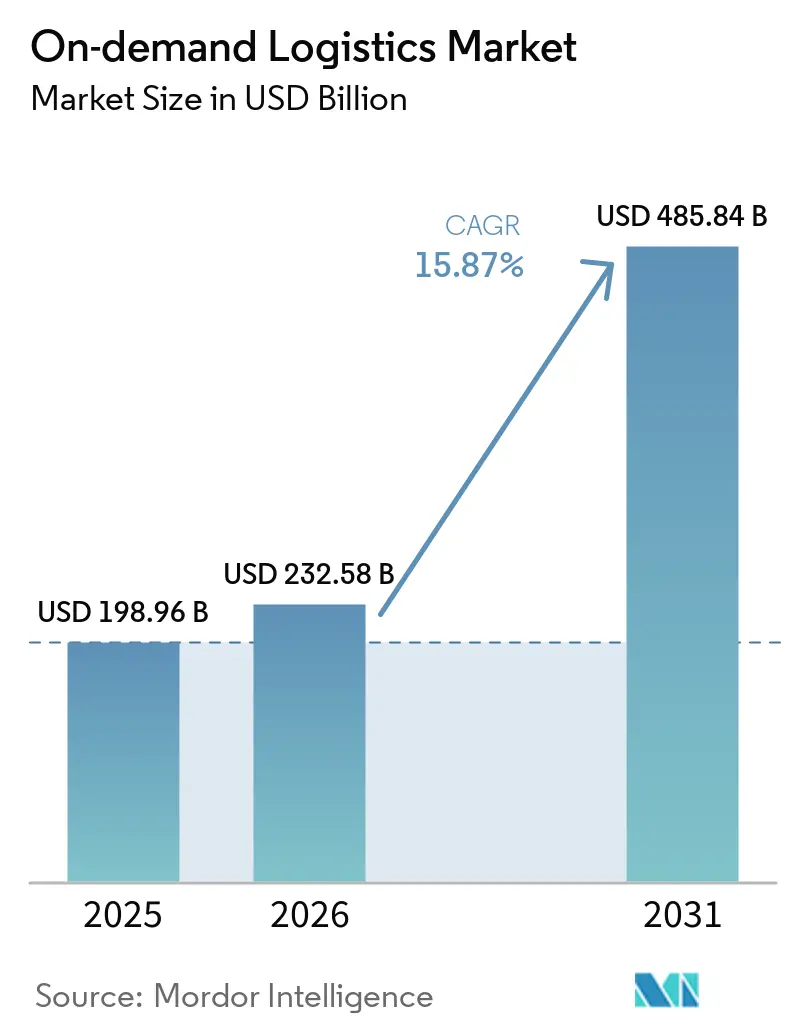
| Market Size (2026) | USD 232.58 Billion |
| Market Size (2031) | USD 485.84 Billion |
| Growth Rate (2026 - 2031) | 15.87% CAGR |
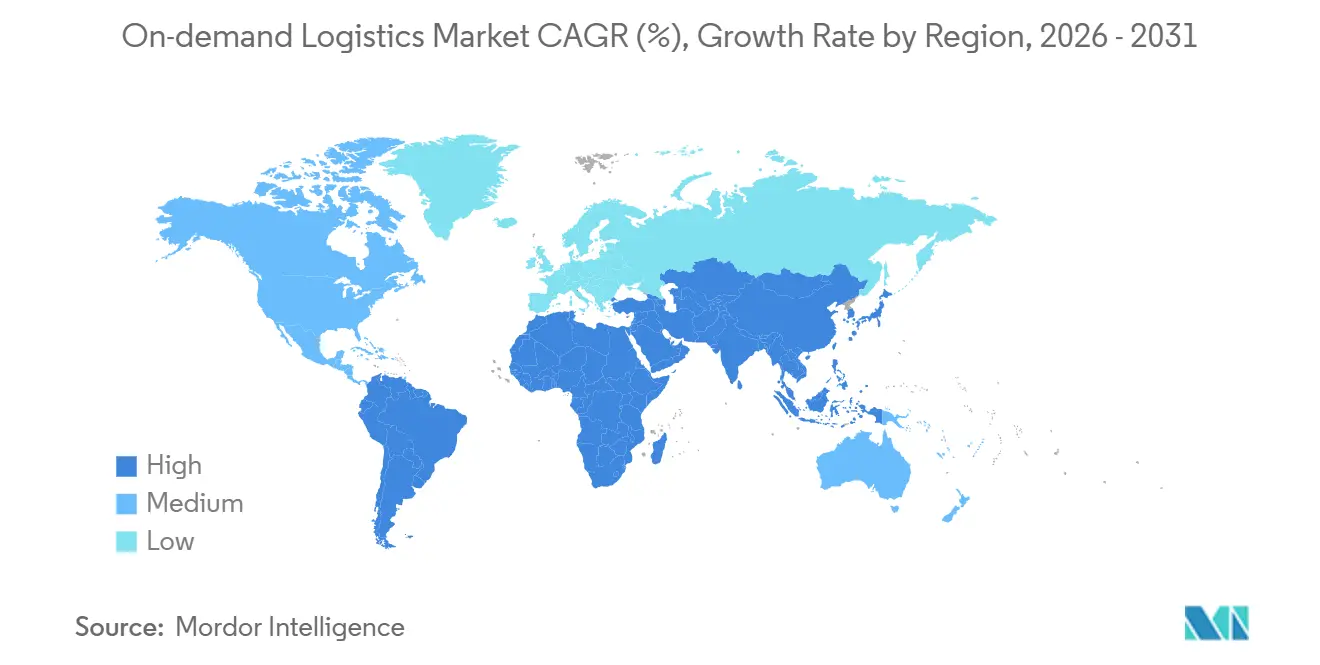
| Fastest Growing Market | Asia Pacific |
| Largest Market | Asia Pacific |
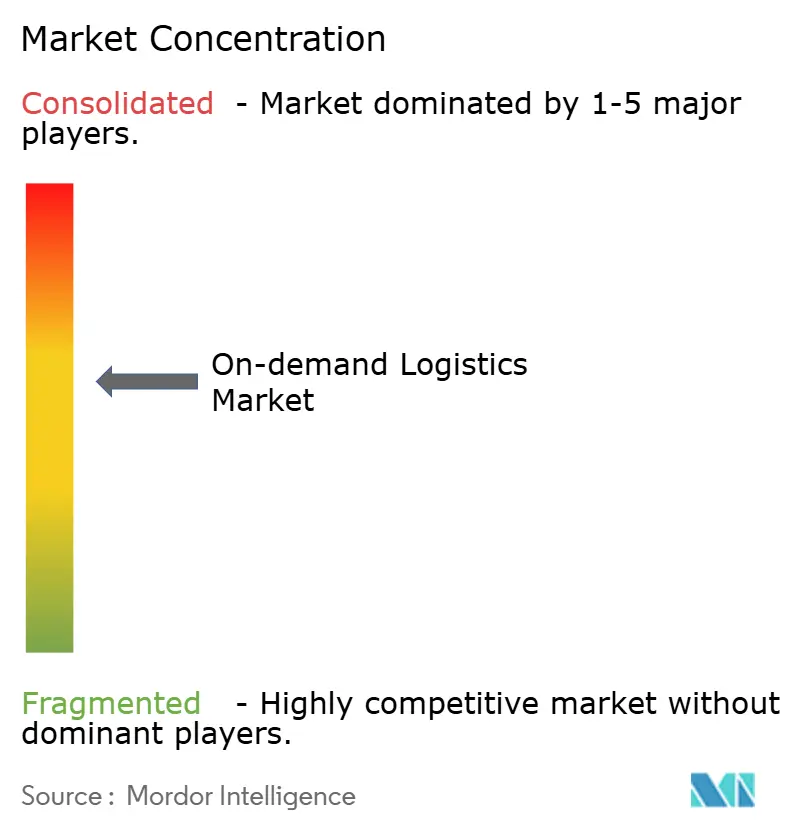
| Market Concentration | Medium |
Major Players *Disclaimer: Major Players sorted in no particular order Image © Mordor Intelligence. Reuse requires attribution under CC BY 4.0. | |
On-demand Logistics Market Analysis by Mordor Intelligence
The On-demand logistics market size is projected to expand from USD 198.96 billion in 2025 and USD 232.58 billion in 2026 to USD 485.84 billion by 2031, registering a CAGR of 15.87% between 2026 and 2031.
Consumer expectations for near-instant delivery have turned what was once a premium perk into a baseline service requirement, accelerating platform investment in real-time routing, micro-fulfillment, and embedded payments. The On-demand logistics market is also shaped by cross-border e-commerce, where lower parcel shipping costs and customs simplification drive higher international order density. Sustainability mandates push providers toward electric fleets and consolidated delivery slots, while creator-commerce and live shopping events inject unpredictable surges that reward operators able to flex capacity in minutes. Asia Pacific, already the largest contributor to the On-demand logistics market, benefits from dense urban networks and regulatory sandboxing that speed drone and autonomous delivery pilots.
Key Report Takeaways
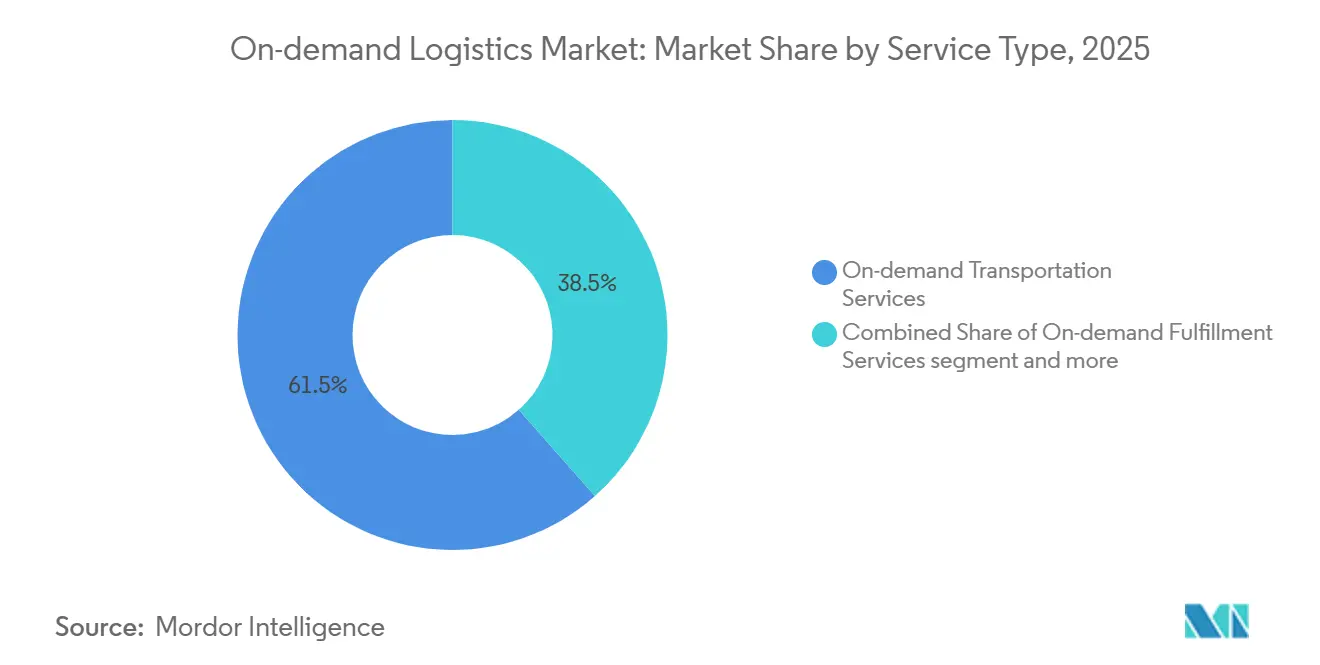
- By service type, on-demand transportation held 61.54% of the On-demand logistics market share in 2025, whereas value-added services are forecast to expand at a 16.34% CAGR through 2031.
- By end-user industry, e-commerce and retail commanded 26.03% of the On-demand logistics market in 2025, while healthcare logistics is advancing at a 19.80% CAGR to 2031.
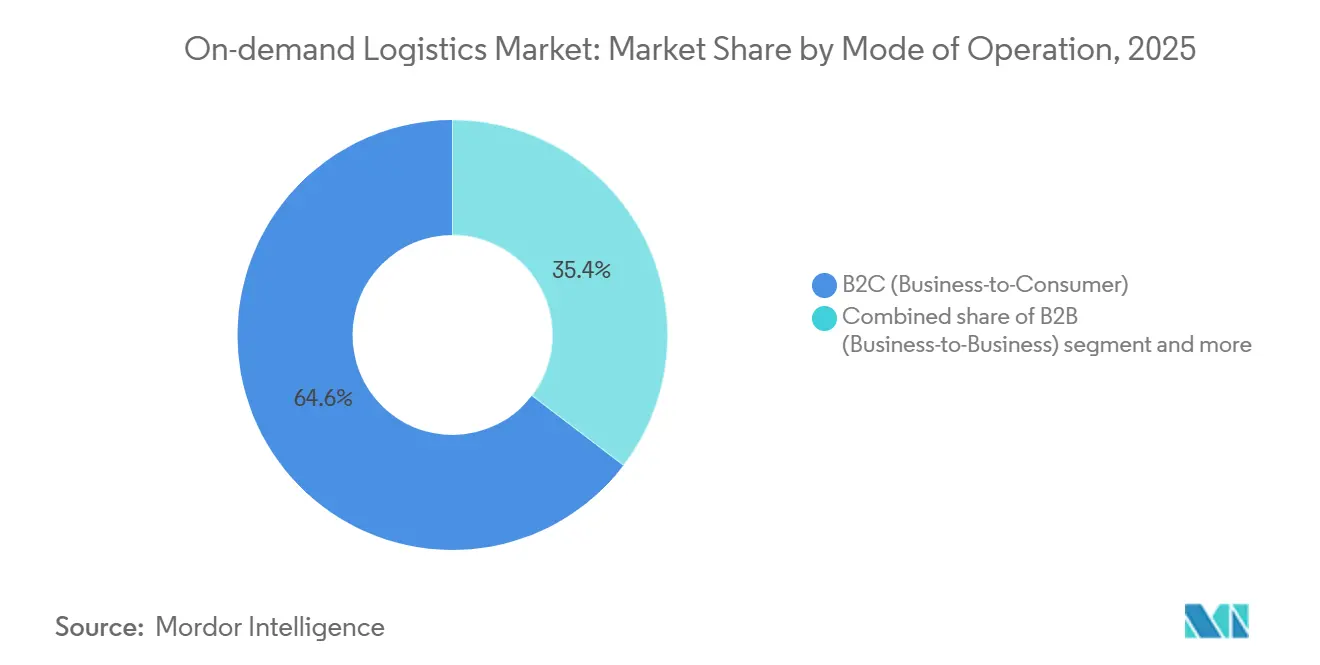
- By mode of operation, the B2C segment accounted for 64.64% share of the On-demand logistics market size in 2025 and is projected to grow at 18.07% CAGR through 2031.
- By enterprise size, large enterprises led with 54.81% revenue share in 2025, whereas SMEs record the fastest projected CAGR at 19.16% to 2031.
- By geography, the Asia Pacific held 42.91% of the On-demand logistics market in 2025, and the region is poised to post an 18.28% CAGR through 2031.
Note: Market size and forecast figures in this report are generated using Mordor Intelligence’s proprietary estimation framework, updated with the latest available data and insights as of January 2026.
Global On-demand Logistics Market Trends and Insights
Drivers Impact Analysis*
| Driver | (~) % Impact on CAGR Forecast | Geographic Relevance | Impact Timeline |
|---|---|---|---|
| Quick-commerce grocery model proliferation | +2.6% | Urban centers globally, concentrated in Asia Pacific and Europe | Short term (≤ 2 years) |
| SaaS route-optimisation uptake among 3PLs | +1.9% | Global, with early adoption in North America and Europe | Medium term (2-4 years) |
| Surge in cross-border e-commerce parcels | +2.4% | Asia Pacific to North America/Europe corridors, intra-Asia growth | Medium term (2-4 years) |
| Corporate ESG mandates favouring green slot consolidation | +1.5% | Europe leading, North America following, emerging in APAC | Long term (≥ 4 years) |
| Creator-commerce live-shopping fulfilment needs | +1.8% | Asia Pacific dominance, expanding to North America and Latin America | Short term (≤ 2 years) |
| Real-time payment rails enabling instant courier payouts | +1.3% | Global, with fastest adoption in Asia Pacific and Latin America | Medium term (2-4 years) |
| Source: Mordor Intelligence | |||
Quick-Commerce Grocery Model Proliferation
Ten-minute grocery delivery reshapes urban retail by breaking the weekly shop into multiple micro-purchases, fulfilled from dark stores within a two-kilometer radius of dense neighborhoods. Getir’s recent retreat from several European countries after USD 2 billion in losses illustrates how profitability hinges on order density. Yet, surviving players consolidate enough volume to achieve break-even at under 30 orders per rider shift. Indian platforms such as Blinkit and Zepto are scaling thousands of micro-fulfillment sites, pressuring legacy grocers to retrofit distribution centers for hourly inventory turns. Repurposed secondary retail real estate keeps fixed costs in check, and QR-code pick systems reduce dwell time to 15 seconds per SKU, raising labor productivity by 40%. For the On-demand logistics market, the quick-commerce race sustains premium pricing for bike-based last-mile capacity while locking in recurring demand from subscription-style grocery baskets.
SaaS Route-Optimization Uptake Among 3PLs
Cloud-native transportation software trims 15-20% of operating costs by balancing traffic data, driver hours, and vehicle capacity in real time. The subscription model removes heavy up-front licenses, enabling mid-size 3PLs to compete with global integrators. Continuous telemetry loops feed machine-learning engines that fine-tune delivery windows, steadily driving down empty miles across the On-demand logistics market. Compliance modules embed rules for hazmat, weight limits, and labor mandates, shielding operators from fines and litigation. Network effects emerge as anonymized route data improves algorithm accuracy for every new participant, expanding the addressable base for SaaS vendors.
Surge in Cross-Border E-commerce Parcels
International parcel value is surging, as marketplaces bundle import duties and transparent shipping at checkout. Air-cargo lane volatility caused by Middle East conflicts lifted Asia-Europe spot rates by 173% in March 2026, yet express carriers maintain service levels through dynamic routing and charter agreements. EU VAT reforms and China’s cross-border pilot zones reduce paperwork, spurring cross-border sellers to localize inventory in bonded warehouses[1]“Global e-commerce sales,” UNCTAD, unctad.org . Within destination countries, instant couriers perform final-mile hand-offs, fusing global line-haul with hyperlocal delivery and cementing cross-border traffic as a growth engine for the On-demand logistics market.
Corporate ESG Mandates Favoring Green Slot Consolidation
Enterprises racing toward net-zero targets now treat logistics emissions as board-level KPIs, catalyzing demand for carbon-accounting dashboards and electric fleets. The EU’s Alternative Fuels Infrastructure Regulation obliges member states to build nationwide fast-charging corridors, unlocking electric van adoption for last-mile routes[2]“Alternative Fuels Infrastructure Regulation,” European Parliament, europa.eu . Retailers experiment with discounted “eco windows” that bundle multiple orders on one truck, winning consumer acceptance once the carbon impact is shown at checkout. Battery-safety guidance from the United Kingdom regulators drives investment in fire-resistant charging enclosures, raising capital intensity yet accelerating professionalization of e-bike fleets. The push towards sustainability widens service differentiation, letting providers price green delivery at a margin premium within the On-demand logistics market.
Restraints Impact Analysis*
| Restraint | (~) % Impact on CAGR Forecast | Geographic Relevance | Impact Timeline |
|---|---|---|---|
| Gig-economy worker reclassification cost pressures | -2.1% | North America, Europe, emerging in Asia Pacific | Short term (≤ 2 years) |
| Geopolitical air-cargo lane disruptions | -1.6% | Global air freight corridors, particularly Asia-Europe routes | Short term (≤ 2 years) |
| Lithium-battery safety limits on e-bike fleet density | -1.0% | Urban centers in Europe, North America, developed Asia | Medium term (2-4 years) |
| Algorithmic price-setting litigation exposure | -0.8% | United States, European Union | Long term (≥ 4 years) |
| Source: Mordor Intelligence | |||
Gig-Economy Worker Reclassification Cost Pressures
The United States Department of Labor’s January 2026 six-factor test blurs the contractor–employee divide, potentially adding payroll taxes, health benefits, and workers’ compensation costs that compress gross margins by up to 6 percentage points. Spain’s Rider Law and similar EU statutes flip the burden of proof onto platforms, triggering local court battles over back pay. Operators hedge by trialing hybrid rosters where core demand is met with employees while peaks are subcontracted, though regulators question the permanence of such dual systems. Compliance complexity multiplies for platforms spanning 30+ jurisdictions, prompting higher legal and HR spend across the On-demand logistics market. Some providers respond with automation initiatives, such as delivery robots, lockers, and drones, to decouple capacity growth from headcount risk[3]“Employee or Independent Contractor Classification,” U.S. Department of Labor, dol.gov.
Geopolitical Air-Cargo Lane Disruptions
Armed conflict in key overflight regions forces carriers to detour thousands of nautical miles, erasing capacity just as e-commerce peaks. March 2026 saw spot rates on Shanghai–Frankfurt routes jump 173% year over year. Express firms buffer risk by pre-booking block-space agreements and expanding intra-Asia rail as a fallback, yet transit times lengthen, and SLA credits rise. Shippers shift safety stock forward into destination markets, raising warehouse demand and tying up working capital, which in turn tempers parcel growth in the On-demand logistics market. Aircraft shortages amplify exposure, as wide-body freighters remain scarce amid delayed OEM production schedules.
*Our forecasts treat driver/restraint impacts as directional, not additive. The impact forecasts reflect baseline growth, mix effects, and variable interactions.
Segment Analysis
By Service Type: Value-Added Services Scale Beyond Transport
Value-added services carved 16.34% CAGR through 2031, demonstrating customer appetite for integrated warehousing, reverse logistics, and analytics that extend beyond simple drop-off. In contrast, on-demand transportation retained 61.54% On-demand logistics market share in 2025 due to its ubiquity in last-mile workflows. Providers leverage “store-and-ship” bundles, short-term storage paired with instant dispatch to lock in clients uneasy about separate suppliers for inventory and delivery. The On-demand logistics market size for fulfillment modules is projected to expand faster than line-haul because packaging, labeling, and returns each create additive fee layers. Reverse logistics, critical for apparel where return ratios hover near 25%, commands premium pricing given inspection and refurbishment requirements. Operators that master these adjacencies see customer churn fall by up to 40%, signaling that end-to-end visibility trumps the lowest per-mile rate in enterprise tender decisions.
Second-order impacts surface in network design: dark stores double as forward stock locations, trimming delivery radius and boosting same-hour hit rates. Data exhaust from pick-pack steps feeds demand forecasts that in turn cut stock-outs on D2C sites, forming a positive feedback loop. Cross-selling analytics dashboards accelerates wallet share, with some 3PLs reporting 25% of 2025 revenue from software subscriptions rather than physical movement. As the On-demand logistics market matures, differentiation shifts from pure speed to accuracy, sustainability reporting, and friction-free returns, all of which sit squarely inside the value-added playbook.


By End-User Industry: Healthcare Logistics Surges Ahead
E-commerce and retail captured 26.03% of the On-demand logistics market in 2025, yet healthcare logistics is poised to be the fastest riser at 19.80% CAGR through 2031. Temperature-controlled services gain urgency as global biologics pipelines swell; DHL earmarked EUR 2 billion (USD 2.35 billion) for GDP-certified hubs and active-container fleets by 2030. Tight regulatory windows 2–8 °C within ±1 °C require redundant monitoring, pushing per-shipment revenue 3–5 times higher than fashion parcels. In emerging markets, cold-chain penetration currently under 15% represents a blue-ocean growth lever for the On-demand logistics industry. Aging demographics in Japan, the EU, and the United States raise chronic-care drug volumes, locking in secular demand insulated from consumer-spending swings.
Parallel to pharma, food and beverage rely on similar thermal protocols, enabling asset reutilization across verticals and smoothing capacity utilization curves. Industrial users pivot toward emergency parts delivery to curtail factory downtime, adopting premium same-day courier loops once reserved for retail. This convergence flattens seasonality, giving network planners steadier asset turns and healthier free cash flow. Within the On-demand logistics market, sector diversity therefore acts as a hedge, buffering cyclical dips in discretionary e-commerce with inelastic medical shipments.
By Mode of Operation: B2C Drives Network Investments
The B2C channel held 64.64% On-demand logistics market in 2025 and will expand fastest at 18.07% CAGR through 2031, propelled by social shopping and subscription boxes. TikTok Shop’s United States expansion funnels creator-led demand into third-party networks, amplifying parcel counts without proportional marketing spend. B2B usage trails but benefits from consumer-grade service features, minute-level tracking, and proactive delay alerts being ported into procurement portals. C2C remains niche yet lucrative for high-value collectibles and recommerce, often commanding double the per-mile rate of bulk business freight.
Network economics hinge on stop density: every incremental household added to a van route cuts cost per drop by roughly 8%, explaining why B2C growth cascades gains into other modes. As the On-demand logistics market further digitizes, operators package unified service catalogs where merchants toggle between B2B pallet moves and B2C parcel flows depending on order size, maximizing fleet utilization across diurnal demand curves.
By Enterprise Size: SME Digital Adoption Closes the Gap
Large enterprises controlled 54.81% of revenue in 2025, yet SMEs are accelerating at 19.16% CAGR as low-code dashboards and pay-as-you-go tariffs remove scale barriers. Government grants and cloud credits offset onboarding costs, while managed-service desks fill skill gaps for inventory planning and customs clearance. Platform providers court SMEs with tiered SLAs, bundling insurance and returns into flat fees predictable for cash-flow-sensitive founders. In return, operators gain access to fragmented but fast-growing verticals, such as artisan foods and niche cosmetics that diversify customer portfolios[4]“SME Digitalisation to Manage Shocks and Transitions,” OECD, oecd.org.
For large shippers, procurement rationalization compresses vendor lists, rewarding 3PLs capable of multi-country coverage and compliance assurance. Contract tenures lengthen beyond three years, baking demand stability into fleet planning. The On-demand logistics market, therefore, evolves toward a barbell structure where scale giants and tech-savvy boutiques set the pace, while mid-size incumbents risk margin squeeze unless they pivot to specialization or platform aggregation.
Geography Analysis
Asia Pacific generated 42.91% of the On-demand logistics market share in 2025 and is forecast to post an 18.28% CAGR to 2031, lifted by urban density and mobile-first retail ecosystems. China’s live-commerce turnover hit RMB 4.9 trillion (USD 699.84 billion) in 2023, with embedded one-click checkout translating into sub-60-minute delivery in tier-1 cities. Southeast Asia’s super-apps, led by Grab, bundle ride-hailing, payments, and parcel dispatch, creating multi-service engagement loops that lock in 42 million monthly active users. Japan confronts a driver shortage that threatens 278,000 vacancies by 2028, prompting policy support for drones and autonomous sidewalk robots. These innovations, once proven, are exported to developing neighbors, reinforcing Asia Pacific’s status as the lead market for rapid-delivery playbooks.
North America, despite platform maturity, still exhibits white space in rural zones; Amazon’s USD 4 billion 2025–2026 program to serve 4,000 smaller towns shows latent upside when hub-and-spoke models extend beyond metropolitan rings. Sustainability dominates European strategy. EU alternative-fuel rules accelerate electric-van procurement and hydrogen corridor construction, enabling carriers to cut Scope 3 emissions and charge green premiums. Latin America rides a nearshoring boom as manufacturers hedge China exposure by adding Mexican capacity; MercadoLibre’s USD 2.5 billion logistics spend exemplifies how regional champions integrate warehousing and last mile under one pane of glass.
In the Middle East and Africa, infrastructure gaps spur leapfrogging mobile wallets and pickup lockers offset limited home addressing systems. Yet geopolitical conflict along major air corridors injects cost volatility, compelling operators to pre-position stock in Gulf free-zones to sidestep airspace closures. Collectively, regional diversification cushions the On-demand logistics market against localized shocks, ensuring global providers can re-route volume to whichever lanes remain fluid.

Competitive Landscape
Competitive intensity is high as asset-light platforms square off against integrators owning aircraft, trucks, and sort centers. The April 2025 merger of DSV and DB Schenker for EUR 14.3 billion (USD 15.4 billion) created a USD 45 billion revenue titan spanning 160,000 staff across 90 countries, signaling that scale remains a potent hedge against margin erosion.
Amazon Logistics, DHL Express, and FedEx leverage network breadth to guarantee next-day delivery to over 95% of addresses in their home regions, while disruptors such as Uber Freight monetize crowd-sourced capacity with algorithmic matching. Regional specialists like Delhivery, JD Logistics, and Lalamove defend moats via hyperlocal fleet density and regulatory know-how.
Technology stakes continue rising. AI-driven dispatching cuts empty miles by up to 22%, yet exposes providers to antitrust probes into algorithmic collusion. ESG positioning becomes a brand differentiator: DHL targets 100% electric last-mile fleet in Europe by 2030, and JD Logistics pilots hydrogen vans for heavy urban routes. Creator-commerce fulfillment represents a fresh battleground; Gopuff and Deliveroo deploy micro-hubs staffed 24/7 to capture impulse demand loops fueled by social media. The On-demand logistics market therefore rewards operators that combine asset agility, data mastery, and vertical specialization, while laggards risk relegation to commoditized subcontractor roles.
On-demand Logistics Industry Leaders
Uber Technologies (Uber Direct, Uber Freight)
DHL Group
JD Logistics
C.H. Robinson Worldwide
FedEx
- *Disclaimer: Major Players sorted in no particular order

Recent Industry Developments
- March 2026: Redwood Logistics bought Stridas to enrich its digital freight platform with real-time rating and capacity tools.
- April 2025: DSV completed the EUR 14.3 billion (USD 15.4 billion) acquisition of DB Schenker, targeting EUR 1.2 billion (USD 1.41 billion) in annual synergies by 2028.
- April 2025: DHL Group announced EUR 2 billion (USD 2.35 billion) through 2030 to scale its health-logistics division, adding GDP hubs on three continents.
- March 2025: Amazon earmarked USD 4 billion to extend rapid delivery to 4,000 smaller U.S. towns by end-2025.


Global On-demand Logistics Market Report Scope
| On-demand Transportation Services | Road Freight |
| Air Freight | |
| Rail Freight | |
| Sea and Inland Waterways | |
| On demand Warehousing and Fulfillment Services | On demand Storage |
| Order Fulfillment and Distribution | |
| Other Warehousing and Fulfillment Services | |
| Value-Added Services |
| E-commerce and Retail |
| Consumer Packaged Goods |
| Food and Beverage (incl. Cold-chain) |
| Healthcare and Pharma |
| Industrial and Manufacturing |
| Others |
| B2C (Business-to-Consumer) |
| B2B (Business-to-Business) |
| C2C (Consumer-to-Consumer) |
| Large Enterprises |
| Small and Medium-sized Enterprises (SMEs) |
| North America | United States |
| Canada | |
| Mexico | |
| South America | Brazil |
| Peru | |
| Chile | |
| Argentina | |
| Rest of South America | |
| Asia-Pacific | India |
| China | |
| Japan | |
| Australia | |
| South Korea | |
| Southeast Asia (Singapore, Malaysia, Thailand, Indonesia, Vietnam, and Philippines) | |
| Rest of Asia-Pacific | |
| Europe | United Kingdom |
| Germany | |
| France | |
| Spain | |
| Italy | |
| BENELUX (Belgium, Netherlands, and Luxembourg) | |
| NORDICS (Denmark, Finland, Iceland, Norway, and Sweden) | |
| Rest of Europe | |
| Middle East and Africa | United Arab Emirates |
| Saudi Arabia | |
| South Africa | |
| Nigeria | |
| Rest of Middle East and Africa |
| By Service Type | On-demand Transportation Services | Road Freight |
| Air Freight | ||
| Rail Freight | ||
| Sea and Inland Waterways | ||
| On demand Warehousing and Fulfillment Services | On demand Storage | |
| Order Fulfillment and Distribution | ||
| Other Warehousing and Fulfillment Services | ||
| Value-Added Services | ||
| By End-User Industry | E-commerce and Retail | |
| Consumer Packaged Goods | ||
| Food and Beverage (incl. Cold-chain) | ||
| Healthcare and Pharma | ||
| Industrial and Manufacturing | ||
| Others | ||
| By Mode of Operation | B2C (Business-to-Consumer) | |
| B2B (Business-to-Business) | ||
| C2C (Consumer-to-Consumer) | ||
| By Enterprise Size | Large Enterprises | |
| Small and Medium-sized Enterprises (SMEs) | ||
| By Geography | North America | United States |
| Canada | ||
| Mexico | ||
| South America | Brazil | |
| Peru | ||
| Chile | ||
| Argentina | ||
| Rest of South America | ||
| Asia-Pacific | India | |
| China | ||
| Japan | ||
| Australia | ||
| South Korea | ||
| Southeast Asia (Singapore, Malaysia, Thailand, Indonesia, Vietnam, and Philippines) | ||
| Rest of Asia-Pacific | ||
| Europe | United Kingdom | |
| Germany | ||
| France | ||
| Spain | ||
| Italy | ||
| BENELUX (Belgium, Netherlands, and Luxembourg) | ||
| NORDICS (Denmark, Finland, Iceland, Norway, and Sweden) | ||
| Rest of Europe | ||
| Middle East and Africa | United Arab Emirates | |
| Saudi Arabia | ||
| South Africa | ||
| Nigeria | ||
| Rest of Middle East and Africa | ||


Key Questions Answered in the Report
How large will on-demand courier services become by 2031?
The On-demand logistics market size is projected to reach USD 485.84 billion by 2031 at a 15.87% CAGR.
Which region contributes the most revenue today?
Asia Pacific generated 42.91% of 2025 revenue and remains the fastest-growing region at 18.28% CAGR.
What is driving demand for value-added logistics services?
Merchants seek integrated warehousing, returns, and analytics, fueling a 16.34% CAGR for value-added offerings through 2031.
Why is healthcare logistics accelerating faster than retail?
Regulatory cold-chain requirements and aging populations create inelastic demand, underpinning a 19.80% CAGR to 2031.
How are gig-economy rules impacting delivery platforms?
Worker reclassification in the United States and EU could trim operating margins by up to 6 points due to payroll taxes and benefits.
Where are investment hot spots for new entrants?
Rapid expansion in live-commerce fulfillment, carbon-neutral delivery, and SME-focused digital platforms present the clearest growth runways.
Page last updated on:


