Retail Oil And Gas Logistics Market Size and Share
Market Overview
| Study Period | 2020 - 2031 |
|---|---|
| Market Size (2026) | USD 25.31 Billion |
| Market Size (2031) | USD 31.09 Billion |
| Growth Rate (2026 - 2031) | 4.20% CAGR |
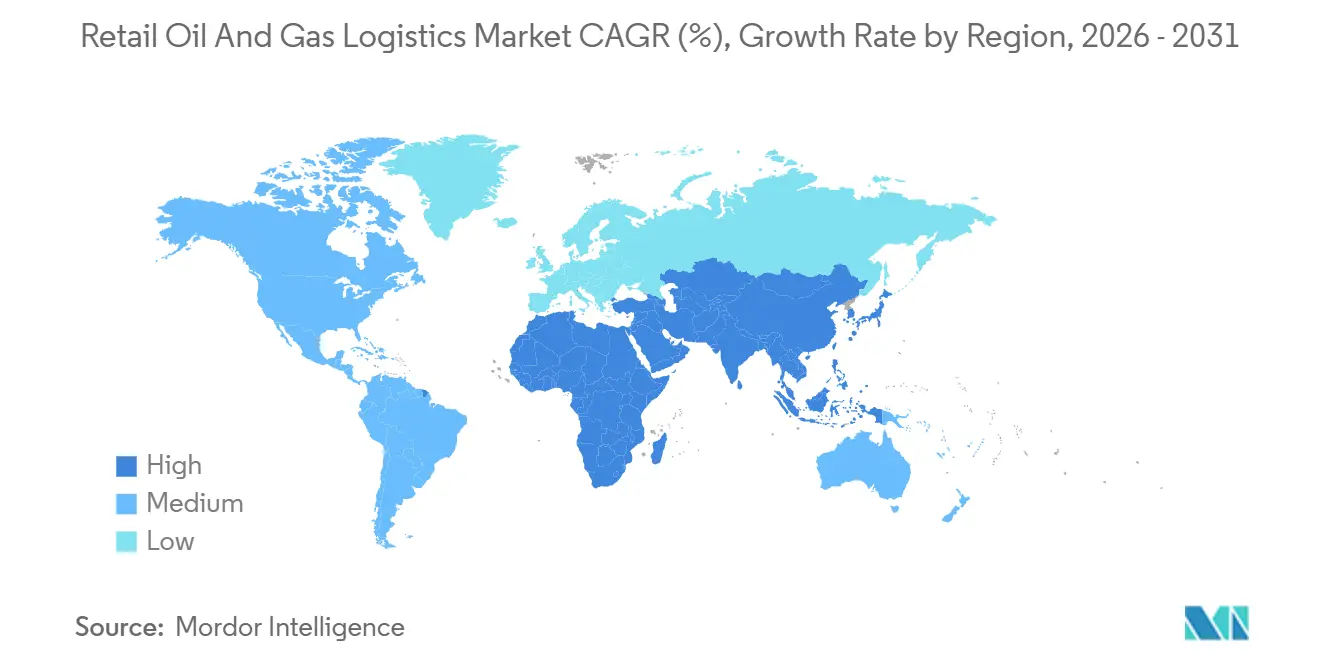
| Fastest Growing Market | Asia Pacific |
| Largest Market | Asia Pacific |
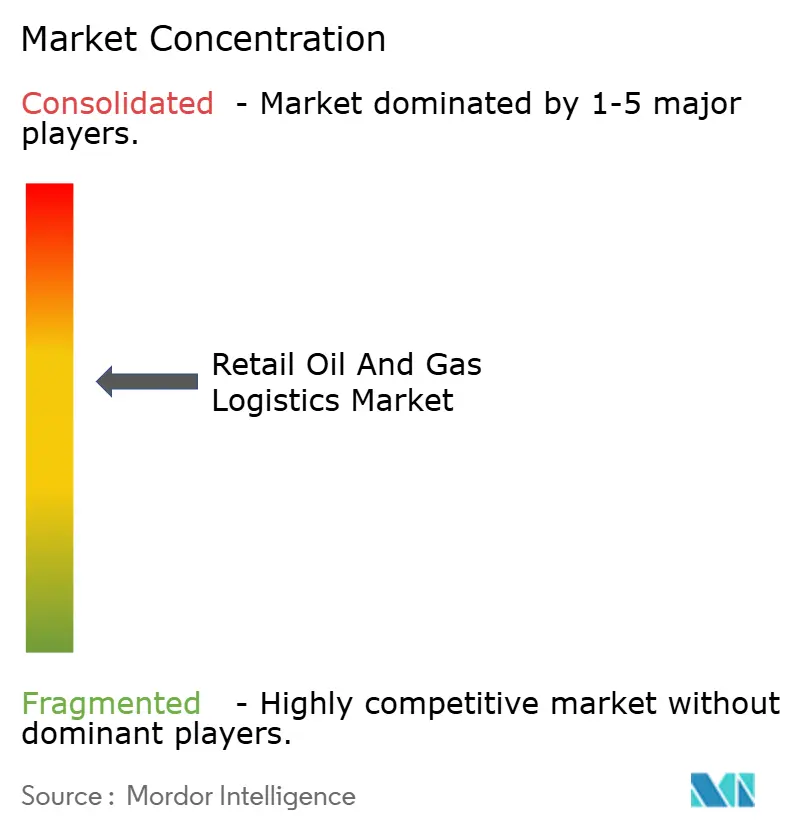
| Market Concentration | Medium |
Major Players *Disclaimer: Major Players sorted in no particular order Image © Mordor Intelligence. Reuse requires attribution under CC BY 4.0. | |
Retail Oil And Gas Logistics Market Analysis by Mordor Intelligence
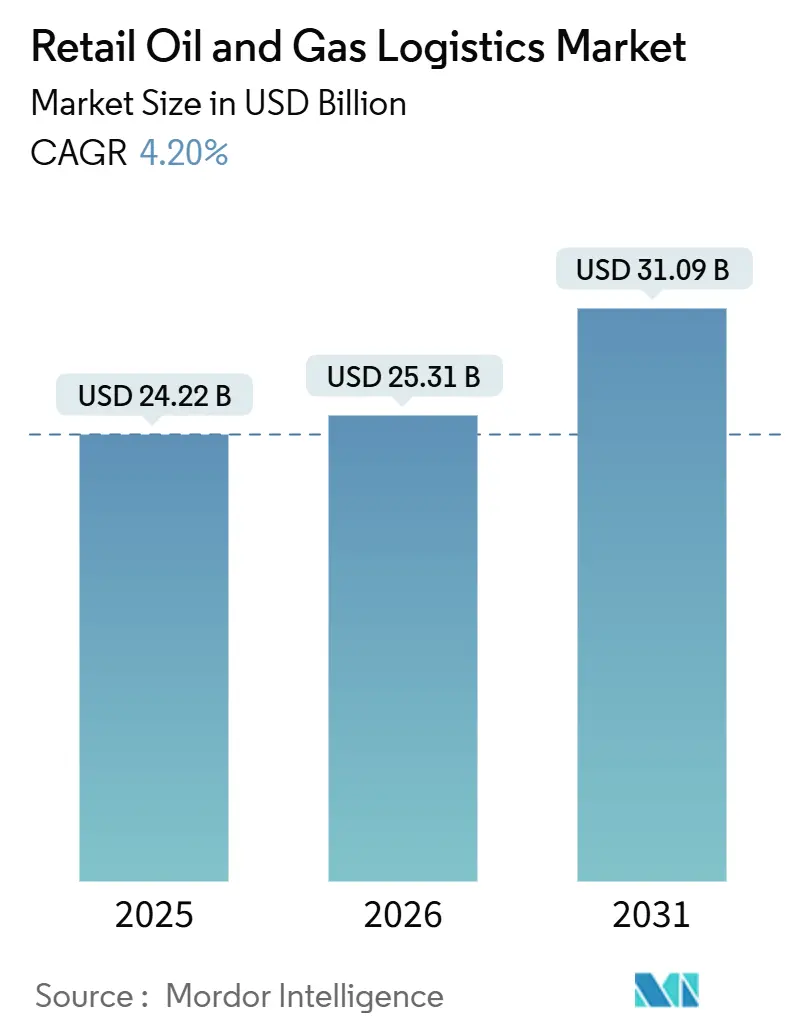
The retail oil and gas logistics market size is projected to expand from USD 24.22 billion in 2025 and USD 25.31 billion in 2026 to USD 31.09 billion by 2031, registering a CAGR of 4.20% between 2026 and 2031.
Muted headline growth conceals sweeping structural changes as providers transition from pure transport to integrated offerings that blend fuel delivery, forecourt inventory orchestration, and temperature-controlled handling for renewable blends. Heightened sulfur and octane regulations accelerate investment in dedicated tanker compartments and quality-testing protocols, while drone-enabled audits compress working-capital cycles by matching deliveries to real-time consumption. Consolidation typified by DSV’s EUR 14.3 billion (USD 16.6 billion) Schenker integration signals a scale race to amortize digital platforms and specialized assets. Simultaneously, pay-per-use depot platforms unlock low-cost market entry for independents and expand addressable volumes for third-party operators.
Key Report Takeaways
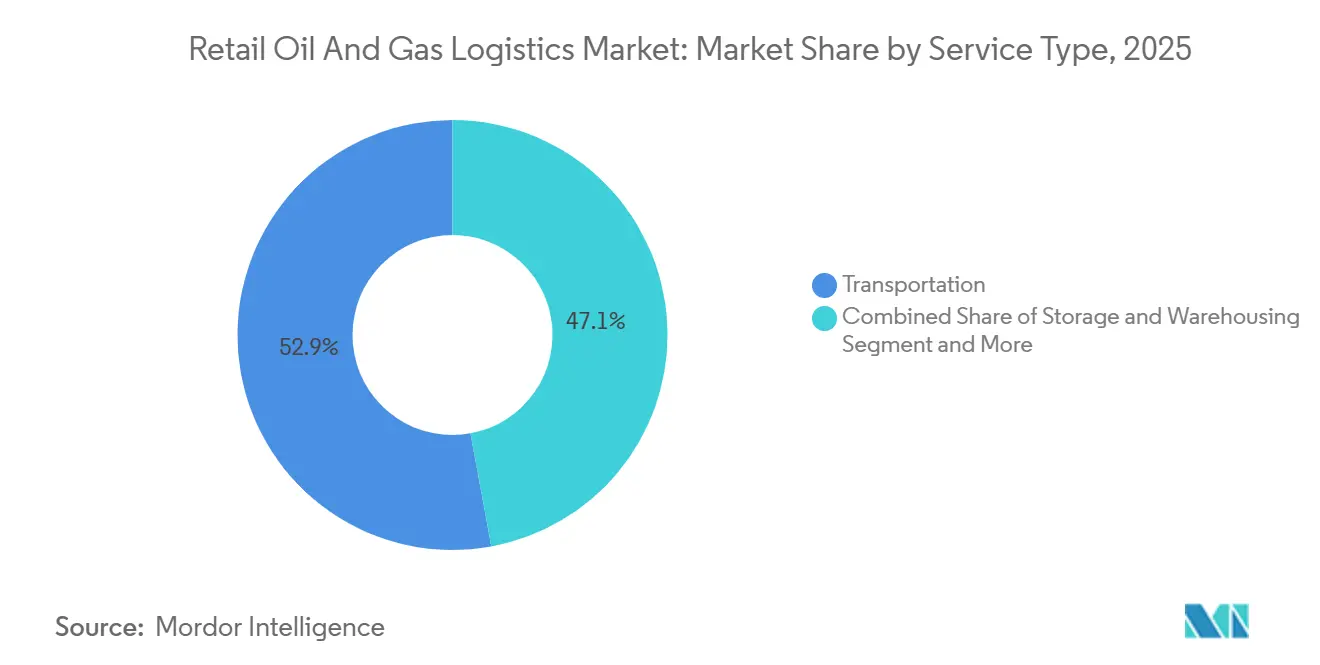
- By service type, transportation commanded 52.89% of the retail oil and gas logistics market share in 2025, while value-added services registered the fastest expansion at a 7.07% CAGR through 2031.
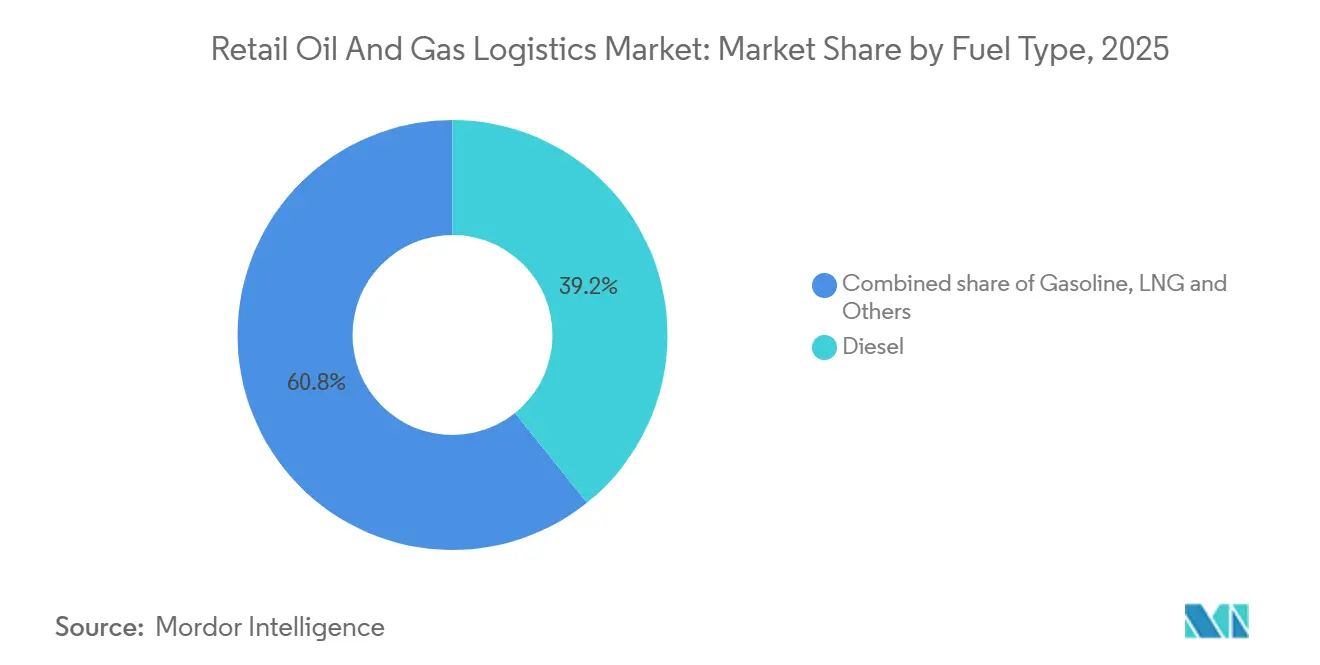
- By fuel type, diesel accounted for 39.24% of the retail oil and gas logistics market size in 2025, and LNG is advancing at an 8.50% CAGR over 2026-2031.
- By end user, fuel retailers held 54.37% revenue share in 2025, whereas industrial customers are projected to grow at a 6.40% CAGR to 2031.
- By region, Asia-Pacific led with 33.75% share of the retail oil and gas logistics market size in 2025 and is forecast to expand at a 5.15% CAGR through 2031.
Note: Market size and forecast figures in this report are generated using Mordor Intelligence’s proprietary estimation framework, updated with the latest available data and insights as of January 2026.
Global Retail Oil And Gas Logistics Market Trends and Insights
Drivers Impact Analysis*
| Driver | (~) % Impact on CAGR Forecast | Geographic Relevance | Impact Timeline |
|---|---|---|---|
| Growth of Integrated Forecourt-Retail Formats | +0.9% | Global, led by North America & Asia-Pacific | Medium term (2-4 years) |
| Stricter Sulfur & Octane Standards | +0.7% | Global, EU & North America spearhead compliance | Short term (≤ 2 years) |
| Expansion of Refined-Product Pipeline Networks | +0.6% | Asia-Pacific, Middle East, Africa | Long term (≥ 4 years) |
| Drone-Assisted Stock Audits | +0.5% | North America & APAC rural markets | Medium term (2-4 years) |
| Pay-Per-Use Shared Depot Platforms | +0.4% | Global, early adoption in fragmented markets | Medium term (2-4 years) |
| Temperature-Controlled Logistics for Renewable Diesel | +0.3% | North America & EU biofuel corridors | Short term (≤ 2 years) |
| Source: Mordor Intelligence | |||
Growth of Integrated Forecourt-Retail Formats (Fuel + Foodservice)
Large retailers are redesigning forecourts to merge fuel pumps with quick-service restaurants and convenience aisles, boosting per-site turnover and necessitating dual-temperature deliveries that protect both fuel quality and food freshness. Walmart’s remodeling of 45 fuel sites in 2025 en route to more than 450 multi-category locations illustrates how unified footprints lift traffic and basket size. Integrated formats require synchronized scheduling, shared inventory systems, and cross-trained crews, enabling third-party logisticians to monetize premium bundled services[1]U.S. Environmental Protection Agency, “Fuels Regulatory Streamlining Sampling and Testing Updates,” federalregister.gov.
Stricter Sulfur & Octane Standards Driving Specialized Handling
The EPA’s January 2025 rule tightened sampling, testing, and inline-blending controls, forcing segmentation of tanker compartments and rigorous clean-down between loads. Certification agencies such as Bureau Veritas and SGS report surging demand for verification audits that reassure lenders and insurers. Logistics firms equipped with lab services and insulated compartments command price premiums while shrinking contamination risk.
Expansion of Refined-Product Pipeline Networks in Developing Regions
Pipeline additions from Texas to the Rocky Mountains and across Asia-Pacific replace costly road and rail hauls with hub-and-spoke models that slash carbon intensity and transit time. OPEC projects 6.3 million b/d of new capacity by 2029, catalyzing demand for regional terminals and last-mile tanker fleets. Integrated operators capturing both trunk and spoke legs stand to deepen customer stickiness[2]U.S. Energy Information Administration, “Five petroleum product pipelines were completed in the United States in 2024,” eia.gov.
Drone-Assisted Stock Audits at Remote Filling Stations
Thermal-equipped UAVs survey tank levels at dispersed outlets in hours instead of days, streaming data into AI dispatch engines that recalibrate routes based on live burn rates. Falling sensor costs and evolving BVLOS rules are triggering pilot programs across North American agricultural belts, reducing emergency drops and insurance claims. As adoption grows, data-driven predictive logistics and automated monitoring promise to further optimize fuel distribution and operational resilience.
Restraints Impact Analysis*
| Restraint | (~) % Impact on CAGR Forecast | Geographic Relevance | Impact Timeline |
|---|---|---|---|
| Rising Insurance Premiums for Hazardous-Cargo Tankers | -0.8% | Global, acute in developed markets | Short term (≤ 2 years) |
| Certified Tanker-Driver Shortages | -0.7% | North America & EU, emerging in APAC | Medium term (2-4 years) |
| Poor Digital Connectivity at Rural Outlets | -0.5% | Rural markets globally | Medium term (2-4 years) |
| Volatile Renewable-Fuel Tax Credits | -0.4% | North America & EU biofuel markets | Short term (≤ 2 years) |
| Source: Mordor Intelligence | |||
Rising Insurance Premiums for Hazardous-Cargo Tanker Fleets
Underwriters tightened terms after high-profile incidents, lifting premiums by 30-40% on LNG and renewable fuel tankers. Safety tech exemptions, such as enhanced brake lights approved for Coffeyville Resources, showcase efforts to curb risk and regain pricing leverage. Smaller carriers lacking spread capacity face margin squeeze or exit. Meanwhile, evolving regulatory scrutiny and rising claims frequency continue to pressure underwriting strategies, challenging carriers to balance risk mitigation with competitive pricing[3]Federal Motor Carrier Safety Administration, “Application for an Exemption From Coffeyville Resources,” federalregister.gov.
Certified Tanker-Driver Shortages Affecting Delivery Reliability
An aging workforce and tougher HAZMAT endorsements leave seats unfilled. Rail resiliency advisories and fleet-telematics mandates spotlight training gaps and workload fatigue. Wage inflation and retention bonuses erode operating margins, especially on peak-season spot work. Regulatory compliance pressures and increasing cybersecurity requirements add layers of administrative burden. Meanwhile, rising fuel and maintenance costs further squeeze already tight profit margins.
*Our forecasts treat driver/restraint impacts as directional, not additive. The impact forecasts reflect baseline growth, mix effects, and variable interactions.
Segment Analysis
By Service Type: Value-Added Services Reshape Competitive Dynamics
Value-added services posted a 7.07% CAGR, the fastest within the retail oil and gas logistics market share, as shippers pay premiums for end-to-end visibility, onsite quality testing, and automated inventory reconciliation. Emerson’s radar-based gauging illustrates how digital terminals lift turnover and shrink losses. Transportation still represents 52.89% of the retail oil and gas logistics market share in 2025, yet driver shortages and insurance costs force carriers to boost utilization via AI route planners and drone-fed stock data. The retail oil and gas logistics market size, tied to storage and warehousing, benefits from renewable blend segregation and chilled bays for biofuels.
Second-order effects include sticky customer contracts: once monitoring portals and automated billing are embedded in a retailer’s ERP, switching costs rise, lifting renewal rates. Pay-per-use depots extend network reach without capital outlay, aligning with asset-light strategies. Meanwhile, pipeline operators capture steady tariff revenue in hub-and-spoke models, integrating last-mile tanker dispatch under unified SLAs to protect quality from trunk line to nozzle.


By Fuel Type: LNG Infrastructure Build-Out Accelerates Growth
LNG recorded an 8.50% CAGR on corridor build-outs and bunkering terminals such as the Galveston LNG Bunker project, supplying a fleet exceeding 1,000 vessels by 2027. Cryogenic trailers and ISO tanks differentiate service portfolios. Diesel’s entrenched base preserved 39.24% retail oil and gas logistics market share in 2025, yet renewable diesel volumes expand, requiring thermostatic tanks to avoid cloud-point failures. The retail oil and gas logistics market size linked to jet fuel sees quality-critical shipments synchronize with SAF rollouts; EIA forecasts sustainable aviation fuel capacity near 30,000 b/d by end-2024.
Operators diversify fleets: LNG tankers for cryogenic, heated trailers for bitumen, and multi-compartment units for gasoline and diesel to maximize backhauls. Stricter specifications stimulate investment in inline blending skids and onboard chromatographs, reducing rejections on delivery.
By End User: Industrial Customers Drive Service Innovation
Industrial customers push the fastest 6.40% CAGR as they outsource fuel management to on-site wet-hosing specialists that shave downtime. Drone-assisted audits supply accurate demand signals for quarry fleets deep inland, while shared depots locate buffer stock near remote operations. For these users, the retail oil and gas logistics market size growth centers on uptime guarantees and consolidated invoicing that folds quality testing with delivery.
Fuel retailers retained 54.37% of the retail oil and gas logistics market share due to daily replenishment needs. Integrated forecourt-retail sites demand synchronized delivery windows for both fuel and perishables, necessitating cross-trained crews and consolidated paperwork. Hypermarkets such as Walmart extend fleet contracts across their merchandise and fuel channels, bundling volumes that fortify carrier bargaining power. Independent retailers leverage depot marketplaces to match majors on wholesale cost, democratizing supply.
Geography Analysis
Asia-Pacific generated 33.75% of the retail oil and gas logistics market revenue in 2025 and is set for a 5.15% CAGR through 2031. China and India expand refinery throughput, while pipeline corridors move coastal output inland, tightening service-level requirements for tank-truck partners. Poor rural connectivity tempers live dispatch adoption, but low-earth-orbit satellite providers promise coverage upgrades that can unlock predictive replenishment in underserved provinces.
North America exhibits logistic modernization amid mature volumes. Five new product pipelines came online in 2024, rebalancing modes away from costly rail legs. Driver shortages heighten wage pressure, while renewable diesel adoption opens niches for thermostatic trucking. Volatile tax credits disrupt route economics, prompting carriers to maintain flexible fuel-agnostic fleets[4]: U.S. Energy Information Administration, “Outlook on Global Refining to 2028,” eia.gov.
Europe confronts green-policy imperatives. Germany’s EUR 20 billion (USD 23 billion) hydrogen grid plan under the European Clean Hydrogen Alliance foreshadows future blend logistics. Stringent liability laws magnify insurance costs, catalyzing mergers of sub-scale haulers. Middle East and Africa leverage producer status to integrate downstream supply chains; CEVA’s Saudi JV exemplifies international-local tie-ups that fuse capital with market knowledge. South America’s ethanol corridors create specialized tank demands, positioning Brazil as a biofuel export node.

Competitive Landscape
Post-merger DSV eclipsed rivals by combining Schenker’s contract-logistics depth with its own forwarding network, targeting DKK 9.0 billion (USD 1.40 billion) synergies by 2028. Sunoco’s USD 9.1 billion Parkland buy builds the continent’s largest fuel-distribution grid, integrating 14,000 miles of pipeline with retail channels. Mitsui O.S.K. Lines’ USD 1.72 billion LBC Tank Terminals acquisition illustrates vertical convergence of maritime haulage and shore-side storage to offer cradle-to-wharf solutions.
Mid-tier players chase niches: drone-enabled audit services, cryogenic LNG circuits, and depot marketplaces. DHL’s partnership with Envision targets 30% SAF mix by 2030, underscoring a pivot to low-carbon value pools. Technology capability is emerging as a primary differentiator, relegating capacity alone to commodity status.
Scale advantages translate into purchasing leverage on insurance, fuel, and equipment, yet market fragmentation persists in rural geographies and specialized liquids. Strategic alliances like Aramco’s ASMO hub with DHL bundle procurement with logistics, offering one-stop services that squeeze standalone haulers.
Retail Oil And Gas Logistics Industry Leaders
DHL Group
CMA CGM Group
DSV
Kuehne + Nagel
C.H. Robinson Worldwide Inc.
- *Disclaimer: Major Players sorted in no particular order

Recent Industry Developments
- December 2025: DHL expanded its Mexico operations with new service points and fleet investments. This strengthens cross-border logistics, especially supporting manufacturing and energy-related supply chains.
- April 2025: DSV completed its EUR 14.3 billion (USD 16.6 billion) Schenker acquisition, creating a DKK 310 billion (USD 48 billion) revenue logistics leader with projected DKK 9.0 billion (USD 1.40 billion) annual synergies by 2028.
- June 2025: DHL announced a EUR 500 million (USD 580 million) investment across Saudi Arabia and the UAE to expand logistics infrastructure. The expansion supports industrial and energy supply chains in key oil-producing regions.
- January 2025: DHL Supply Chain acquired Inmar’s reverse logistics business to strengthen returns management capabilities in retail and e-commerce. This enhances post-sale supply chain services, a critical area in omnichannel distribution.


Global Retail Oil And Gas Logistics Market Report Scope
| Transportation | Road |
| Rail | |
| Sea and Inland (Including Barge) | |
| Storage & Warehousing | |
| Value-added Services and Others(metering, quality testing) |
| Gasoline |
| Diesel |
| Jet Fuel |
| Liquefied Petroleum Gas (LPG) |
| Liquefied Natural Gas (LNG) |
| Others (bitumen, lubricants) |
| Fuel Retailers (Fuel Stations) |
| Convenience Stores & Hypermarkets |
| Industrial Retail Customers (Mining, Agriculture, Construction, Government, Aviation, Marine, etc.) |
| Others |
| North America | United States |
| Canada | |
| Mexico | |
| South America | Brazil |
| Peru | |
| Chile | |
| Argentina | |
| Rest of South America | |
| Asia-Pacific | India |
| China | |
| Japan | |
| Australia | |
| South Korea | |
| South East Asia (Singapore, Malaysia, Thailand, Indonesia, Vietnam, and Philippines) | |
| Rest of Asia-Pacific | |
| Europe | United Kingdom |
| Germany | |
| France | |
| Spain | |
| Italy | |
| BENELUX (Belgium, Netherlands, and Luxembourg) | |
| NORDICS (Denmark, Finland, Iceland, Norway, and Sweden) | |
| Rest of Europe | |
| Middle East and Africa | United Arab Emirates |
| Saudi Arabia | |
| South Africa | |
| Nigeria | |
| Rest of Middle East And Africa |
| By Service Type (Value) | Transportation | Road |
| Rail | ||
| Sea and Inland (Including Barge) | ||
| Storage & Warehousing | ||
| Value-added Services and Others(metering, quality testing) | ||
| By Fuel Type (Value) | Gasoline | |
| Diesel | ||
| Jet Fuel | ||
| Liquefied Petroleum Gas (LPG) | ||
| Liquefied Natural Gas (LNG) | ||
| Others (bitumen, lubricants) | ||
| By End User (Value) | Fuel Retailers (Fuel Stations) | |
| Convenience Stores & Hypermarkets | ||
| Industrial Retail Customers (Mining, Agriculture, Construction, Government, Aviation, Marine, etc.) | ||
| Others | ||
| By Geography (Value) | North America | United States |
| Canada | ||
| Mexico | ||
| South America | Brazil | |
| Peru | ||
| Chile | ||
| Argentina | ||
| Rest of South America | ||
| Asia-Pacific | India | |
| China | ||
| Japan | ||
| Australia | ||
| South Korea | ||
| South East Asia (Singapore, Malaysia, Thailand, Indonesia, Vietnam, and Philippines) | ||
| Rest of Asia-Pacific | ||
| Europe | United Kingdom | |
| Germany | ||
| France | ||
| Spain | ||
| Italy | ||
| BENELUX (Belgium, Netherlands, and Luxembourg) | ||
| NORDICS (Denmark, Finland, Iceland, Norway, and Sweden) | ||
| Rest of Europe | ||
| Middle East and Africa | United Arab Emirates | |
| Saudi Arabia | ||
| South Africa | ||
| Nigeria | ||
| Rest of Middle East And Africa | ||


Key Questions Answered in the Report
What is the projected value of the Retail Oil and Gas Logistics market in 2031?
It is forecast to reach USD 31.09 billion by 2031.
Which service segment is expanding fastest?
Value-added services are growing at 7.07% CAGR through 2031 due to demand for integrated inventory, quality, and forecourt support.
Why is LNG logistics growing rapidly?
Corridor infrastructure and bunkering terminals are making LNG viable for truck and marine fleets, driving an 8.50% CAGR in related logistics.
Which region offers the greatest growth opportunity?
Asia-Pacific leads with a 5.15% CAGR as refinery expansions and pipeline projects multiply distribution needs.
How are driver shortages affecting logistics costs?
Lack of certified tanker drivers inflates wages and limits capacity, pressing operators to adopt automation and retention programs.
What strategic moves define recent competitive dynamics?
Megadeals such as DSV-Schenker and Sunoco-Parkland boost scale, while niche players invest in drone audits, depot platforms, and renewable-fuel handling.
Page last updated on:


