Apparel Logistics Market Size and Share
Market Overview
| Study Period | 2020 - 2031 |
|---|---|
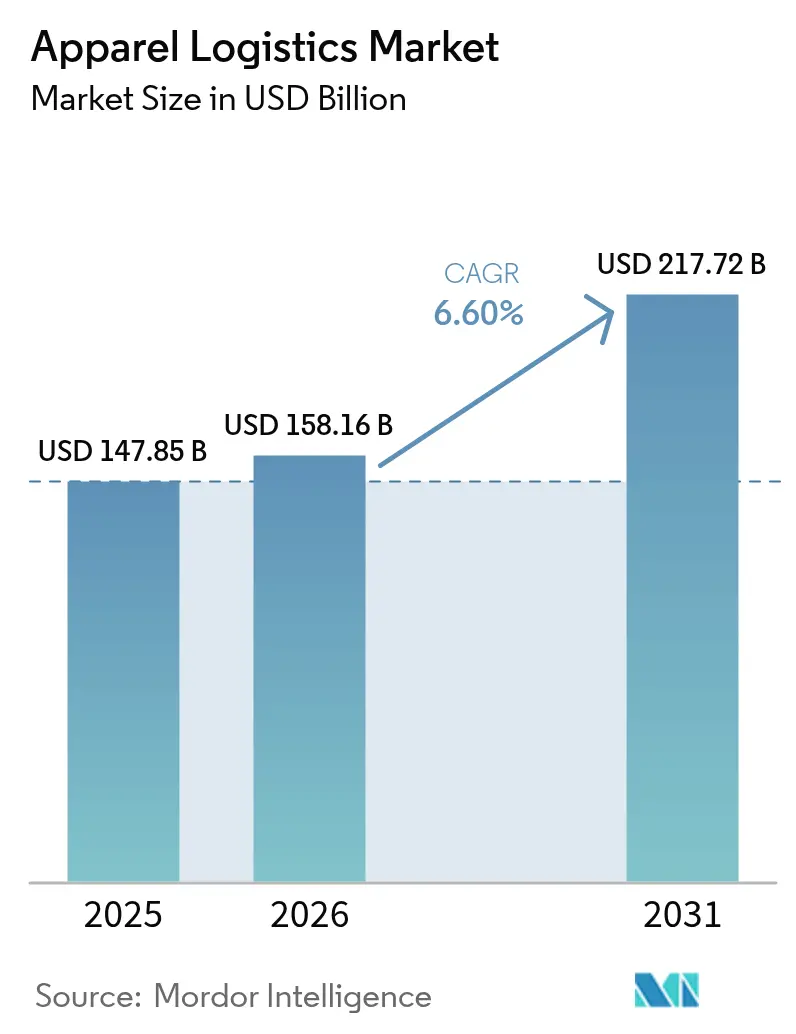
| Market Size (2026) | USD 158.16 Billion |
| Market Size (2031) | USD 217.72 Billion |
| Growth Rate (2026 - 2031) | 6.60% CAGR |
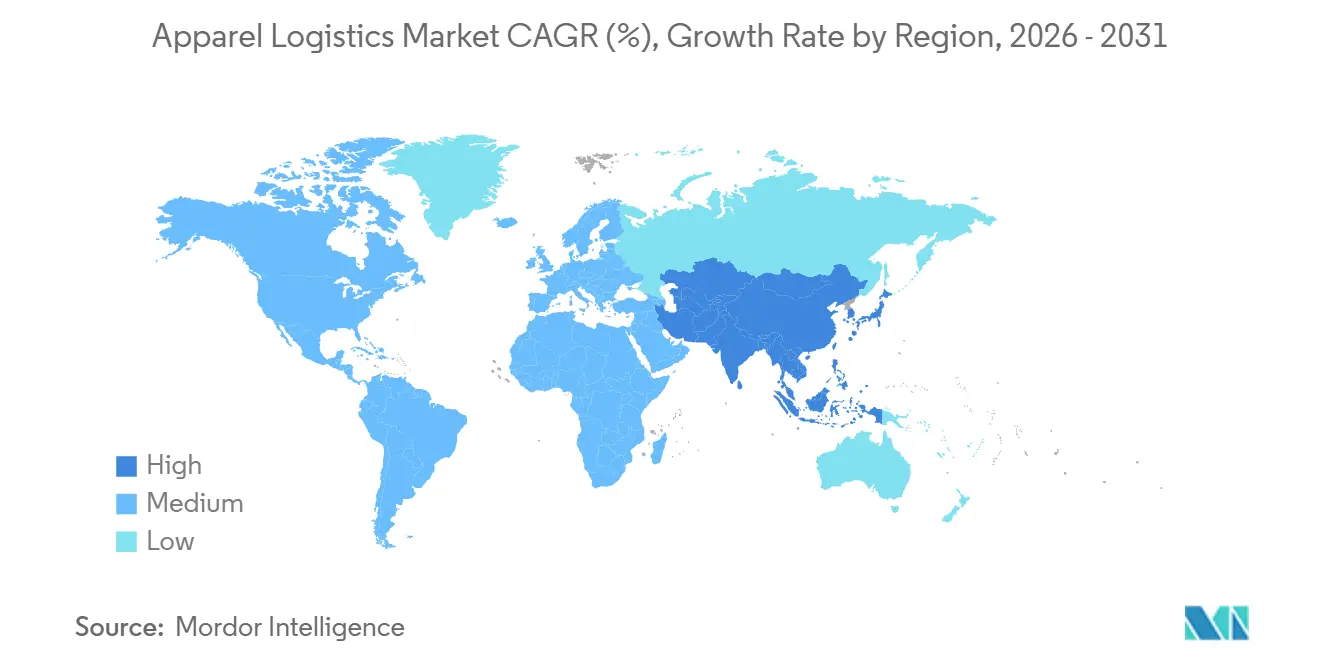
| Fastest Growing Market | Asia Pacific |
| Largest Market | Asia Pacific |
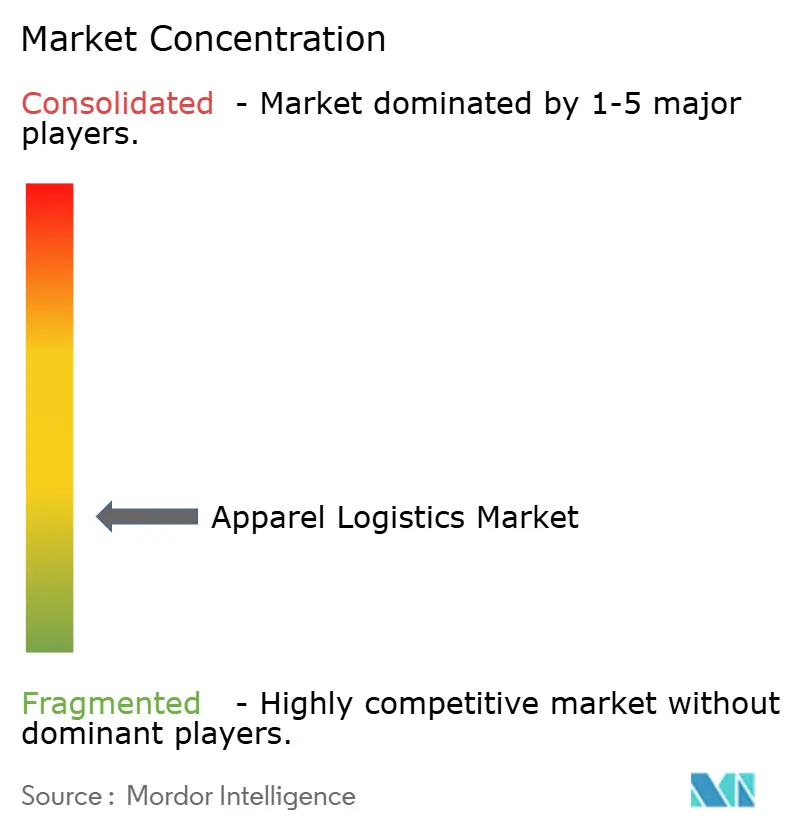
| Market Concentration | Medium |
Major Players *Disclaimer: Major Players sorted in no particular order Image © Mordor Intelligence. Reuse requires attribution under CC BY 4.0. | |
Apparel Logistics Market Analysis by Mordor Intelligence
The global apparel logistics market size is expected to grow from USD 147.85 billion in 2025 to USD 158.16 billion in 2026 and is forecast to reach USD 217.72 billion by 2031 at a 6.60% CAGR over 2026-2031.
Surging omnichannel retail strategies are prompting brands to re-engineer supply chains around delivery speed and inventory visibility instead of pure cost minimization. Near-shoring initiatives in Mexico, Central America, Turkey, and North Africa are compressing ocean routes, stimulating cross-border road and short-sea activity, and heightening the need for regional cross-docking nodes. Mandatory Digital Product Passport (DPP) rules in the European Union are accelerating the deployment of RFID, QR, and blockchain, driving demand for granular track-and-trace services across the apparel logistics market. Operators face margin pressure from volatile bunker and electricity prices, driving automation, renewable-energy sourcing, and index-linked contracts. Competitive differentiation now hinges on warehouse robotics, AI-driven inventory analytics, and the ability to execute reverse logistics and circular-economy programs at an industrial scale within the apparel logistics market.
Key Report Takeaways
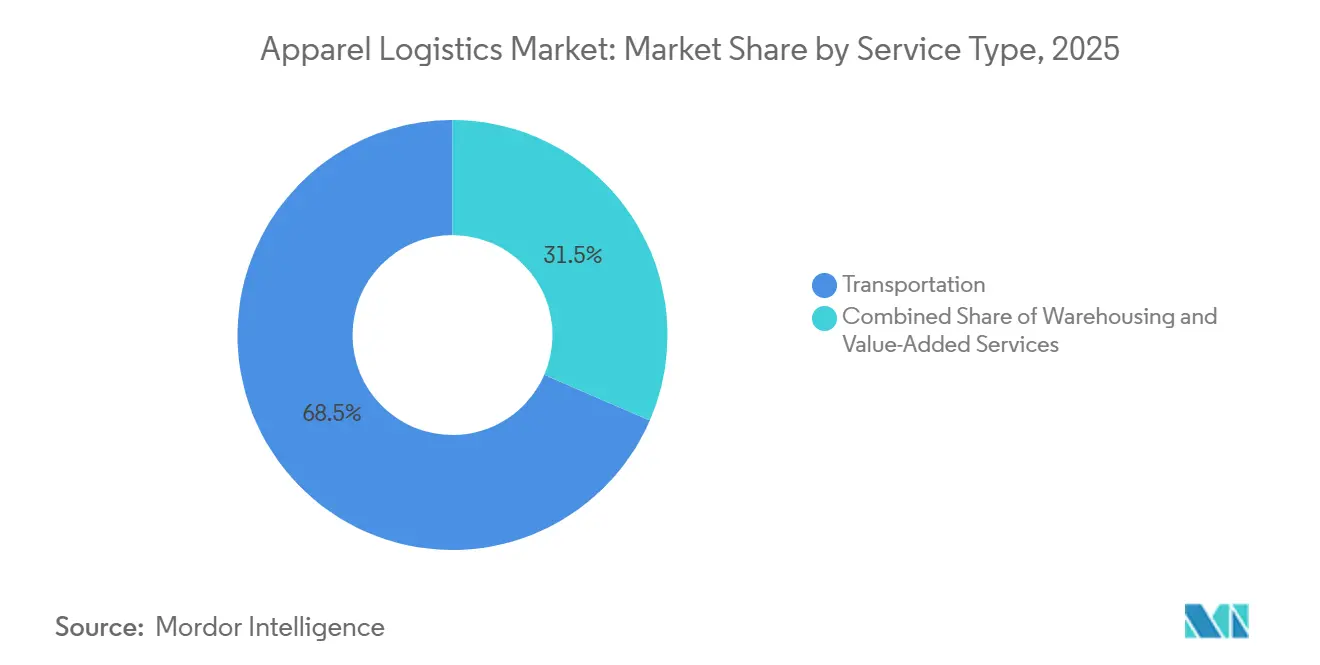
- By service, transportation accounted for 68.50% of the apparel logistics market share in 2025. Value-added services are forecast to expand at a 6.70% CAGR through 2031.
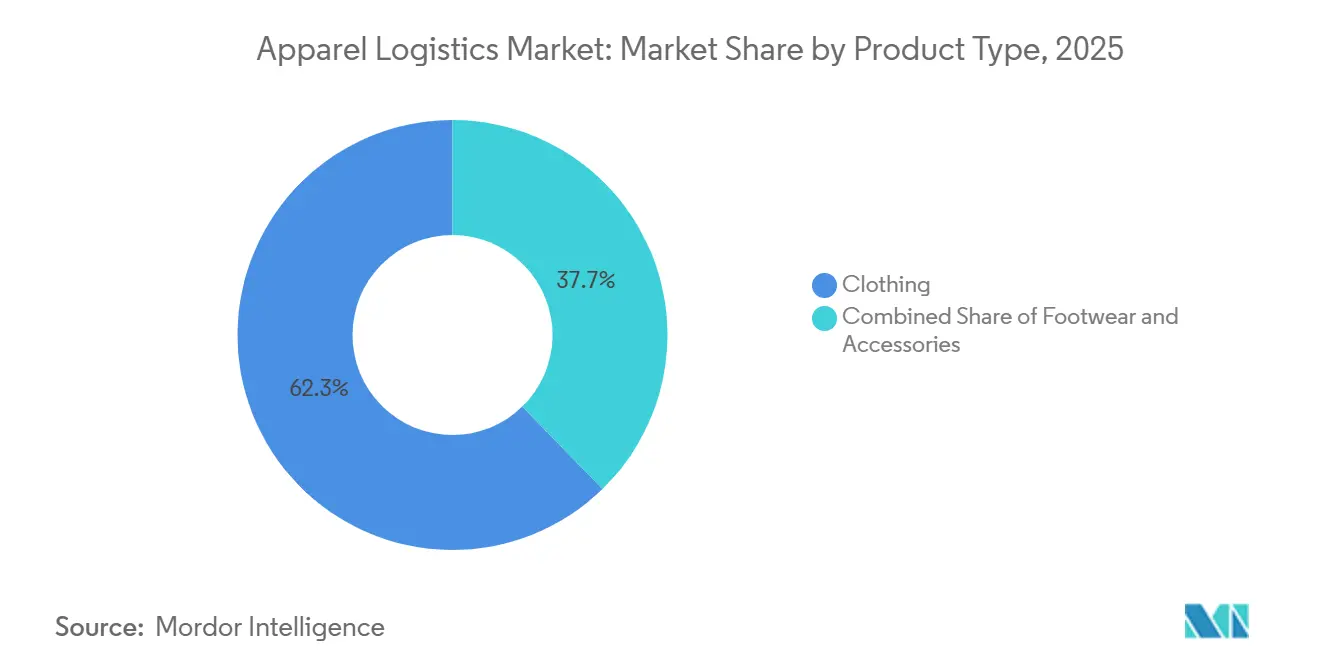
- By product type, clothing captured 62.30% of the apparel logistics market size in 2025. Clothing is projected to advance at a 6.64% CAGR over 2026-2031.
- By geography, Asia-Pacific held 41.80% revenue share in 2025 and is poised for the fastest regional CAGR of 6.80% through 2031.
Note: Market size and forecast figures in this report are generated using Mordor Intelligence’s proprietary estimation framework, updated with the latest available data and insights as of 2026.
Global Apparel Logistics Market Trends and Insights
Drivers Impact Analysis*
| Driver | (~) % Impact on CAGR Forecast | Geographic Relevance | Impact Timeline |
|---|---|---|---|
| Omnichannel fulfillment mandates requiring integrated same-day delivery networks | +1.6% | North America, EU metros, emerging APAC megacities | Short term (≤ 2 years) |
| Regionalized apparel manufacturing near demand centers is diluting long-haul dependencies | +1.3% | Mexico, Central America, Turkey, North Africa | Medium term (2-4 years) |
| Acceleration of warehouse robotics and goods-to-person automation to offset labor shortages | +1.4% | Global, strongest in high-wage economies | Medium term (2-4 years) |
| Advanced inventory analytics and AI for real-time optimization of hyper-fragmented SKUs | +1.2% | North America, Western Europe, and leading APAC e-commerce markets | Short term (≤ 2 years) |
| EU Digital Product Passport legislation driving item-level traceability investments | +0.9% | EU core, export-oriented Asian suppliers | Long term (≥ 4 years) |
| Expansion of bonded e-commerce hubs in ASEAN, enabling 48-hour cross-border apparel delivery | +0.7% | Singapore, Malaysia, Thailand, Vietnam | Medium term (2-4 years) |
| Source: Mordor Intelligence | |||
Omnichannel Fulfillment Mandates Requiring Integrated Same-Day Delivery Networks
Retailers are shrinking fulfillment radii to satisfy same-day promises, pouring capital into urban sortation sites and in-store micro-fulfillment modules. Target committed USD 100 million to six United States sortation centers, while Walmart opened five automated nodes capable of covering 90% of households the next day. City authorities in Paris, Barcelona, and New York restrict curb-side dwell time, compelling carriers to adopt slot-optimization and gig-driver orchestration software. Indian quick-commerce providers anticipate 75-85% annual order growth, further straining legacy hub-and-spoke designs. Collectively, these moves elevate the need for dense cross-dock grids, time-definite line-haul, and integrated last-mile capacity across the apparel logistics market. Operators that fuse transport, inventory, and labor data in real time secure higher tender win rates and margin resilience[1] International Association of Public Transport, “Urban Logistics and Same-Day Delivery Trends 2025,” uitp.org .
Regionalized Apparel Manufacturing Near Demand Centers Diluting Long-Haul Dependencies
Record Mexican exports to the United States in 2025 shortened replenishment cycles to 4-6 weeks, half the duration of East-Asian sourcing. Duty-free corridors under USMCA and CAFTA-DR, coupled with flexible production in Turkey for EU brands, are amplifying truck-based flows and short-sea rotations. While Asia retains leadership in synthetic fabrics, rising geopolitical risk and disrupted shipping lanes are driving hedging toward nearshore plants. Freight-mix patterns now favor regional full-truckload and air-charter solutions, bolstering agility for fashion drop calendars inside the apparel logistics market. Providers that operate bonded warehouses near land borders and offer integrated customs desks gain a structural edge.
Acceleration of Warehouse Robotics and Goods-to-Person Automation to Offset Labor Shortages
Amazon surpassed 1 million robots, cutting pick travel by 10% and improving on-site safety metrics. Shuttle systems at leading fashion 3PLs deliver more than triple the productivity of manual configurations, while generative-AI copilots accelerate exception handling. Automation trims reliance on scarce labor, extends operating hours, and underpins error-free fulfillment, reinforcing the competitive positioning of technologically fluent providers within the apparel logistics market. Capital intensity, however, is driving industry consolidation as mid-tier operators struggle to finance robotics rollouts.
Advanced Inventory Analytics and AI for Real-Time Optimization of Hyper-Fragmented SKUs
AI-powered forecasting converts social media sentiment into purchase orders within weeks at Walmart, sharply compressing design-to-shelf intervals. Cloud platforms ingest web traffic, point-of-sale signals, and weather patterns to refine size curves, slashing split shipments and last-mile costs. Users of predictive allocation engines report 30% faster inventory turns and improved first-attempt delivery success. These analytics exploit the big-data foundation of omnichannel retail, turning granular visibility into margin lift for 3PLs embedded in the apparel logistics market. Early adopters monetize insights through premium service bundles and dynamic pricing models.
Restraints Impact Analysis*
| Restraint | (~) % Impact on CAGR Forecast | Geographic Relevance | Impact Timeline |
|---|---|---|---|
| Escalating cross-border compliance costs and shifting customs regimes | -1.2% | Global, with acute impact on EU-UK, US-China, intra-ASEAN corridors | Short term (≤ 2 years) |
| Energy-price volatility is inflating distribution-centre operating expenses | -1.0% | EU core, extending to energy-import-dependent markets | Short term (≤ 2 years) |
| Persistent global container imbalance and port congestion are disrupting apparel flows | -1.1% | Transpacific and Asia-Europe routes, cascading to feeder services | Medium term (2-4 years) |
| Supply bottlenecks for recyclable logistics packaging materials are hindering sustainability targets | -0.6% | Global, with the highest impact in markets with mandatory packaging regulations | Long term (≥ 4 years) |
| Source: Mordor Intelligence | |||
Escalating Cross-Border Compliance Costs and Shifting Customs Regimes
New tariff rounds on Mexican apparel in 2025 forced emergency rerouting and elevated brokerage spending. EU carbon-border fees require shipment-level emissions declarations, adding paperwork and lengthening clearance cycles. Post-Brexit declarations can lift the cost per U.K. parcel by GBP 20-45, jeopardizing SME exports. Growing networks of free-trade agreements multiply rules-of-origin audits, pushing 3PLs to build automated HS-classification tools and staffed compliance desks. Heightened complexity increases the risk of penalties, delays deliveries, and erodes customer experience across the apparel logistics market.
Energy-Price Volatility Inflating Distribution-Center Operating Expenses
European warehouse electricity bills rose 12-18% year on year in 2025 as gas and power markets gyrated. Operators counter by installing LED lighting, rooftop solar arrays, and battery storage, yet capital payback stretches in the face of persistent price swings. Energy index clauses in contracts pass part of the volatility to shippers, sparking renegotiations and realigning cost responsibility. Seasonally adjusted billing, dynamic HVAC controls, and real-time dashboards now form part of standard service bids in the apparel logistics market. Firms unable to hedge energy spend face margin compression and asset underutilization[2].International Energy Agency, “Gas and Electricity Market Update 2025,” iea.org
*Our forecasts treat driver/restraint impacts as directional, not additive. The impact forecasts reflect baseline growth, mix effects, and variable interactions.
Segment Analysis
By Service: Transportation Retains Leadership as Value-Added Services Capture Growth
Transportation services held 68.50% of the apparel logistics market share in 2025, confirming their pivotal role in moving finished garments from the factory gate to the final consumer. The apparel logistics market size tied to transportation is set for steady expansion, yet value-added services will grow faster, registering a 6.70% CAGR to 2031. Air freight remains the premium conduit for capsule drops and influencer-driven flash sales, whereas sea freight underpins bulk flows for cost-sensitive staples. China-Europe rail corridors attract modal shift as brands chase lower emissions without sacrificing too much lead time. Robotics-enabled warehouses, embedded customs desks, and ESG dashboards transform storage from commodity to strategic control tower within the apparel logistics market.
As rental, resale, and repair models scale, logistics touches per garment multiply, elevating reverse-flow complexity and the revenue potential of value-added packages. Digital Product Passport compliance injects mandatory scanning and data upload at each checkpoint, increasing dwell minutes but creating new billable events. Bio-LNG long-haul trucks, dynamic route algorithms that shave 10% fuel use, and solar-powered cross-docks illustrate how carriers pursue both cost and carbon reduction. Contract awards increasingly hinge on API connectivity that feeds inventory, returns, and emissions data directly into brand ERP stacks, tightening technology integration requirements across the apparel logistics industry.


By Product Type: Clothing Dominance with Sustained Growth Momentum
Clothing accounted for 62.30% of the apparel logistics market size in 2025 and is projected to expand at a 6.64% CAGR through 2031. Ultra-fast fashion cycles. Shein, for example, can move from concept to live SKU in two weeks and has driven SKU proliferation, return surges, and inbound-outbound parity in some distribution centers. Footwear and accessories trail in volume but command higher handling fees owing to authentication steps and specialized protective packing. Temperature-controlled stockholding for premium leather jackets and high-end sneakers is rising, widening service diversity in the apparel logistics market.
Return rates for clothing hover around 21%, creating nearly symmetrical outbound and inbound volumes. Multi-fiber blends complicate DPP data capture, while metal adornments sometimes trigger dangerous-goods screening for air carriage. Accessories exhibit lower return rates but experience acute seasonal spikes, underscoring the need for demand sensing. Provider differentiation increasingly relies on granular SKU-level forecasting, AI-assisted sortation, and flexible labor orchestration to handle bursty workflows inside the apparel logistics industry[3].National Retail Federation, “Consumer Returns in the Retail Industry 2024,” nrf.com
Geography Analysis
Asia-Pacific generated 41.80% of worldwide revenue in 2025 and is expected to post a 6.80% CAGR through 2031, cementing its primacy in the apparel logistics market. China anchors large-scale production, but diversification into Vietnam, Bangladesh, and India accelerates, pushing intra-Asian feeders, cross-border trucking, and China-Europe rail to new highs. ASEAN bonded hubs permit 48-hour regional delivery, and Singapore consolidates multimodal flows through its free-trade zones. Persistent port congestion in Shanghai and Shenzhen is swelling dwell times, prompting shippers to adopt cross-border road and trans-Siberian rail for time-sensitive capsule collections.
North America is recalibrating toward resilience after pandemic-era shocks. Near-shoring in Mexico and Central America compresses order-to-delivery windows, while United States cross-border truck freight climbed 9% in 2025. Laredo surpassed Los Angeles as the busiest United States trade gateway, redistributing inland logistics patterns. Gulf and East Coast ports siphon discretionary cargo from the labor-disrupted West Coast, expanding demand for multi-client transload hubs and sparking infrastructure upgrades that intensify rivalry inside the apparel logistics market.
Europe balances sustainability mandates with supply-chain agility. DPP pilots in France and Germany are stimulating RFID portal rollouts and cloud traceability stacks, lifting logistics costs while unlocking compliance-driven value-added fees. Turkey and Morocco attract EU sourcing shifts, channeling short-sea and truck volumes through Mediterranean corridors. Energy-price volatility strains warehouse profit-and-loss statements, expediting solar-roof projects and power-purchase agreements. The confluence of compliance and carbon imperatives elevates specialized 3PLs armed with customs expertise and green facility credentials across the apparel logistics market[4].European Commission, “Digital Product Passport Framework for Textiles,” europa.eu
Mordor Intelligence provides coverage of the apparel logistics market across other key regional markets. Detailed country-level analysis extends to Italy and United States incorporating local coverage and market participation, as required.

Competitive Landscape
The apparel logistics market remains moderately concentrated, with Deutsche Post DHL Group, Kuehne + Nagel, and Bleckmann controlling the highest global revenue. DHL’s acquisition of Inmar Supply Chain Solutions deepens its reverse logistics capabilities, enabling large-scale refurbishment and recommerce flows. Kuehne + Nagel retains a leadership position in Gartner’s 3PL Magic Quadrant after sustained digital investment and automation pilots. Bleckmann leverages fashion-only specialization, opening a 156,000 ft² Ohio site to court United States brands demanding high-speed fulfillment.
Strategic focus has shifted to automation, ESG credentials, and end-to-end visibility. JD Logistics is targeting two-day cross-border parcel delivery through proprietary air charters and overseas warehouse grids. DHL and Envision are co-creating net-zero logistics hubs fueled partly by sustainable aviation fuel, aligning services with brand decarbonization targets. ISO 28000 and C-TPAT certifications now serve as credibility badges, especially for premium labels requiring validated security chains in the apparel logistics market.
Venture-backed disruptors complicate the competitive field. Shein’s Supply-Chain-as-a-Service (SCaaS) model offers turnkey freight, fulfillment, and data analytics to peer brands, eroding incumbent price premiums. United States platform Stord blends cloud software with asset-light warehousing, enabling mid-size merchants to access elastic logistics networks. Rising capital intensity in robotics and ESG retrofits prompts mid-tier 3PLs to merge or specialize, indicating continued consolidation pressure in the apparel logistics market.
Apparel Logistics Industry Leaders
Deutsche Post DHL Group
DSV
Hellmann Worldwide Logistics
Kuehne + Nagel
CMA CGM
- *Disclaimer: Major Players sorted in no particular order

Recent Industry Developments
- February 2026: Logwin AG launched Logwin Logistics US Inc., marking entry into the U.S. market with plans to expand air and ocean freight services and strengthen its global service footprint.
- February 2026: FedEx, along with Advent International, A&R Investments, and PPF Group, agreed to buy all of InPost’s shares for EUR 15.60 (USD 18.50) each in a deal where they would pay cash.
- February 2026: Logistics provider Bleckmann renewed its partnership with omnichannel beauty retailer Douglas, continuing to deliver 3PL services, including warehousing, fulfillment, and returns management, relevant to fashion/apparel e-commerce logistics.
- April 2025: DSV A/S completed its multi-billioneuro acquisition of DB Schenker (formerly part of Deutsche Bahn), forming one of the world’s largest logistics service providers by revenue and network scale.


Global Apparel Logistics Market Report Scope
| Transportation | Road |
| Rail | |
| Air | |
| Sea and Inland Waterways | |
| Warehousing and Distribution Services | |
| Value-added Services |
| Clothing |
| Footwear |
| Accessories |
| North America | United States |
| Canada | |
| Mexico | |
| South America | Brazil |
| Peru | |
| Chile | |
| Argentina | |
| Rest of South America | |
| Asia-Pacific | India |
| China | |
| Japan | |
| Australia | |
| South Korea | |
| South East Asia (Singapore, Malaysia, Thailand, Indonesia, Vietnam, and Philippines) | |
| Rest of Asia-Pacific | |
| Europe | United Kingdom |
| Germany | |
| France | |
| Spain | |
| Italy | |
| BENELUX (Belgium, Netherlands, and Luxembourg) | |
| NORDICS (Denmark, Finland, Iceland, Norway, and Sweden) | |
| Rest of Europe | |
| Middle East and Africa | United Arab Emirates |
| Saudi Arabia | |
| South Africa | |
| Nigeria | |
| Rest of Middle East And Africa |
| By Service (Value) | Transportation | Road |
| Rail | ||
| Air | ||
| Sea and Inland Waterways | ||
| Warehousing and Distribution Services | ||
| Value-added Services | ||
| By Product Type | Clothing | |
| Footwear | ||
| Accessories | ||
| By Geography (Value) | North America | United States |
| Canada | ||
| Mexico | ||
| South America | Brazil | |
| Peru | ||
| Chile | ||
| Argentina | ||
| Rest of South America | ||
| Asia-Pacific | India | |
| China | ||
| Japan | ||
| Australia | ||
| South Korea | ||
| South East Asia (Singapore, Malaysia, Thailand, Indonesia, Vietnam, and Philippines) | ||
| Rest of Asia-Pacific | ||
| Europe | United Kingdom | |
| Germany | ||
| France | ||
| Spain | ||
| Italy | ||
| BENELUX (Belgium, Netherlands, and Luxembourg) | ||
| NORDICS (Denmark, Finland, Iceland, Norway, and Sweden) | ||
| Rest of Europe | ||
| Middle East and Africa | United Arab Emirates | |
| Saudi Arabia | ||
| South Africa | ||
| Nigeria | ||
| Rest of Middle East And Africa | ||


Key Questions Answered in the Report
What will the apparel logistics market be worth by 2031?
The sector is projected to reach USD 217.72 billion by 2031, expanding at a 6.60% CAGR from 2026 to 2031.
Which service line is growing fastest inside the sector?
Value-added services, including returns processing and Digital Product Passport compliance, are forecast to post a 6.70% CAGR through 2031.
Which service category generates the most revenue?
Transportation contributes 68.5% of 2025 revenue owing to the ongoing need for global goods movement.
Why does Asia-Pacific dominate global apparel flows?
The region blends large-scale manufacturing capacity with booming e-commerce demand, capturing 41.8% revenue and leading growth at 6.8% CAGR to 2031.
How are new EU regulations influencing logistics investment?
Digital Product Passport rules drive RFID and blockchain implementations, pushing operators to expand traceability and compliance capabilities.
Which firms are ramping up circular logistics capabilities?
Deutsche Post DHL Group’s Inmar deal and Bleckmann’s recommerce expansions illustrate early large-scale moves into garment reuse and repair logistics.
Page last updated on:


