Market Overview
| Study Period | 2020 - 2031 |
|---|---|
| Forecast Data Period | 2026 - 2031 |
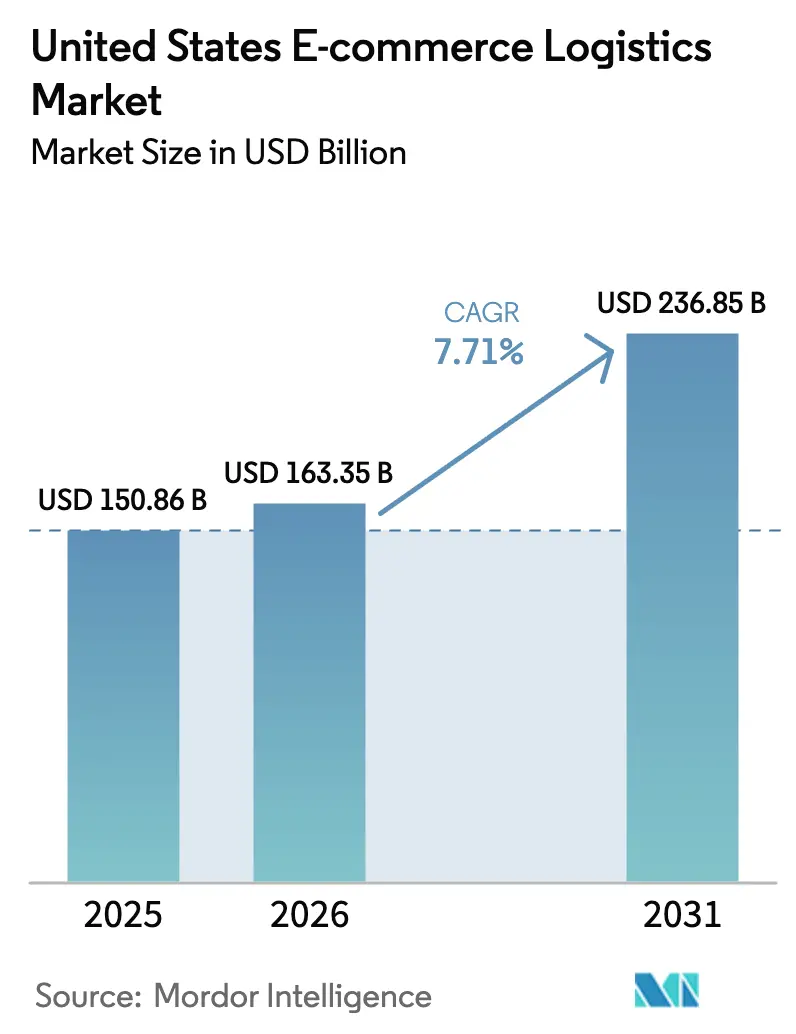
| Base Year Market Size (2025) | USD 150.86 Billion |
| Market Size (2026) | USD 163.35 Billion |
| Market Size (2031) | USD 236.85 Billion |
| Growth Rate (2026 - 2031) | 7.71% CAGR |
| Market Concentration | High |
Major Players *Disclaimer: Major Players sorted in no particular order Image © Mordor Intelligence. Reuse requires attribution under CC BY 4.0. | |
United States E-commerce Logistics Market Analysis by Mordor Intelligence
The United States e-commerce logistics market size is projected to be USD 150.86 billion in 2025, USD 163.35 billion in 2026, and reach USD 236.85 billion by 2031, growing at a CAGR of 7.71% from 2026 to 2031.
Regulatory momentum that now allows autonomous middle-mile convoys, generous federal tax credits for electric vans, and state incentives for urban micro-fulfillment remodel network economics. Locker networks that cut failed first-attempt deliveries by one-quarter lift carrier margins, while Section 321 de minimis alignment with Mexico accelerates cross-border parcel flow. Together, policy and technology widen profit pools that were previously constrained by labor costs, empty miles, and missed deliveries. Competitive pressure intensifies as ship-from-store adoption, crowdsourced delivery models, and specialized oversized-item carriers challenge the legacy hub-and-spoke paradigm.
Key Report Takeaways
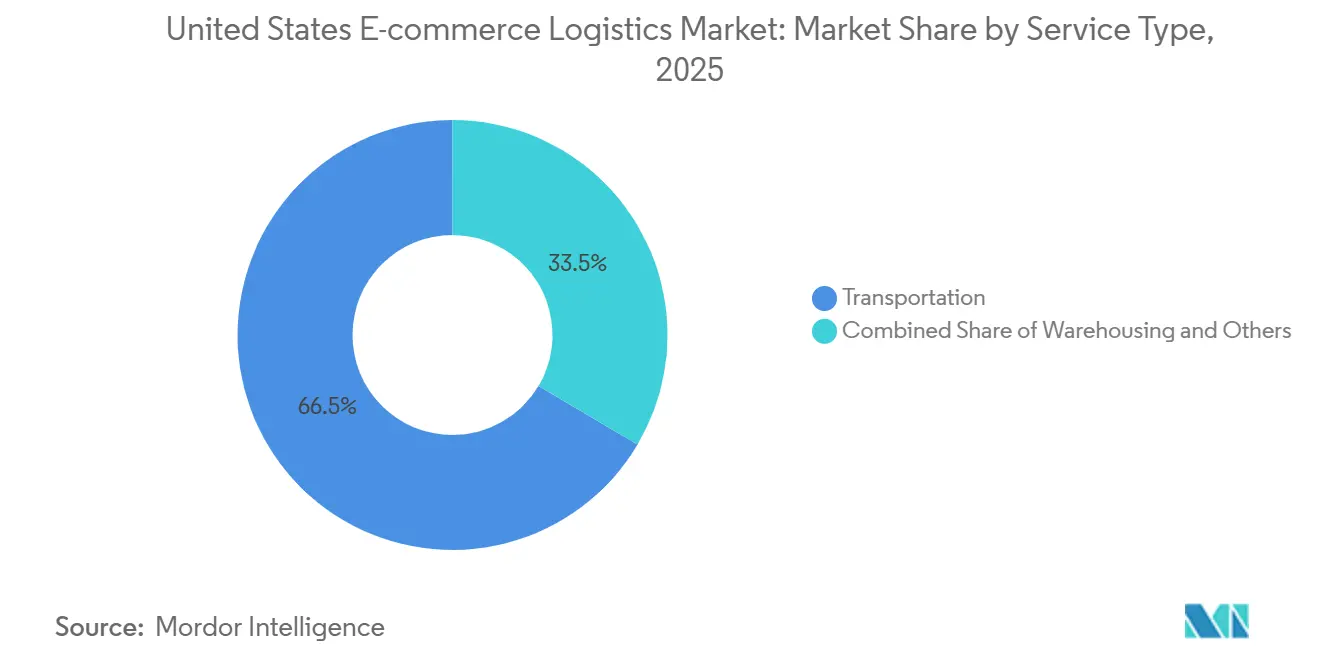
- By service, transportation held 66.5% of the United States e-commerce logistics market share in 2025, while warehousing and fulfillment is forecast to expand at a 7.9% CAGR through 2031.
- By business model, the B2C segment commanded 73.3% share of the United States e-commerce logistics market size in 2025, whereas C2C platforms are projected to grow at 7.84% CAGR between 2026-2031.
- By destination, domestic shipments accounted for 89.3% share in 2025, and cross-border parcels are advancing at an 8.3% CAGR to 2031.
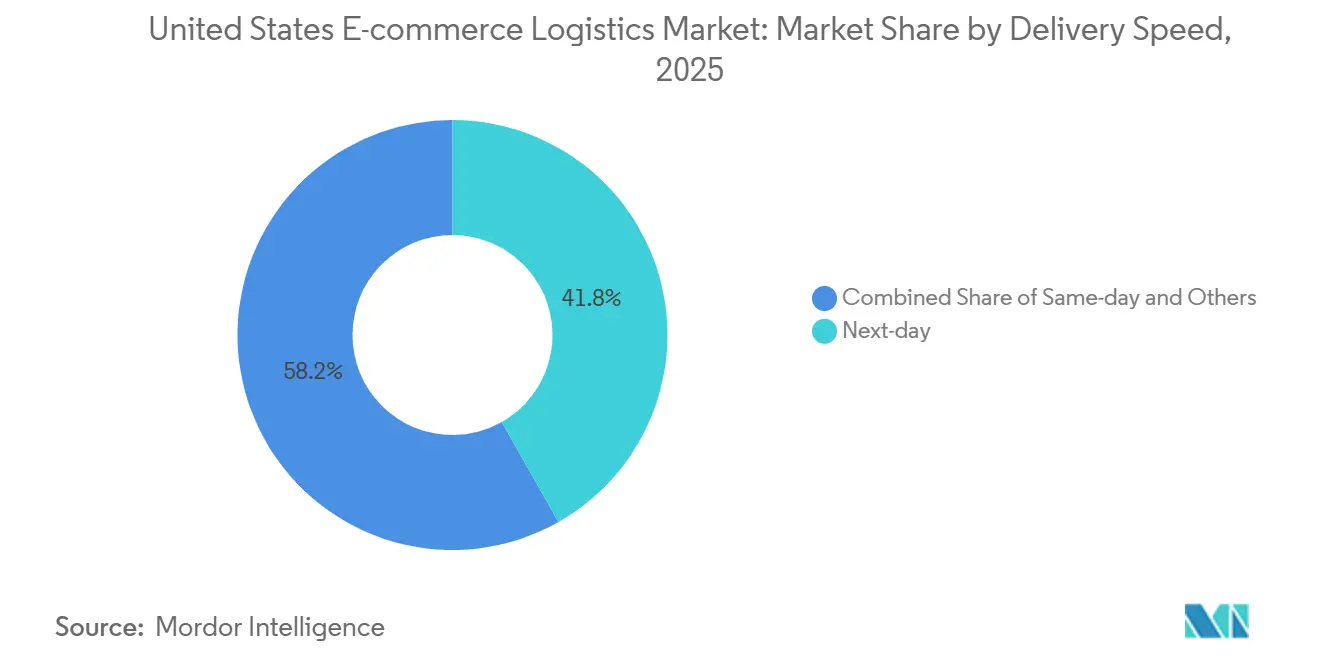
- By delivery speed, next-day services led with 41.8% revenue share in 2025; same-day delivery is expected to register an 8.1% CAGR to 2031.
- By product category, fashion and lifestyle retained 21.2% share in 2025, whereas foods and beverages are set to grow at 8.4% CAGR through 2031.
- By geography, the South captured 32.2% of the United States e-commerce logistics market share in 2025 and is poised for a 7.88% CAGR over 2026-2031.
Note: Market size and forecast figures in this report are generated using Mordor Intelligence’s proprietary estimation framework, updated with the latest available data and insights as of 2026.
United States E-commerce Logistics Market Trends and Insights
Drivers Impact Analysis*
| Driver | (~) (%) Impact on CAGR Forecast | Geographic Relevance | Impact Timeline |
|---|---|---|---|
| DOT approval of autonomous middle-mile trucking convoys | +1.9% | Interstate corridors linking major hubs | Medium term (2-4 years) |
| Nationwide open-standard parcel-locker network | +1.6% | Urban and suburban markets | Short term (≤ 2 years) |
| State micro-fulfillment tax credits | +1.3% | High-density metropolitan areas | Medium term (2-4 years) |
| United States–Mexico Section 321 de minimis harmonization | +1.1% | Border states and customs centers | Short term (≤ 2 years) |
| Federal investment tax credit for electric vans | +0.9% | National urban routes | Long term (≥ 4 years) |
| Large-scale retailer ship-from-store adoption | +0.8% | Metropolitan retail clusters | Medium term (2-4 years) |
| Source: Mordor Intelligence | |||
DOT Approval of Autonomous Middle-Mile Trucking Convoys on Major Freight Corridor
The Department of Transportation now permits truck platoons with autonomous control on selected interstates. Carriers reduce line-haul driver hours while keeping human oversight for pickup and final-mile portions, saving on fuel through drafting and cutting labor costs on overnight hauls[1] FreightWaves Staff, “DOT Autonomous Vehicle Policy Framework 2024,” freightwaves.com . UPS and FedEx pilot these convoys between sortation hubs that face the worst driver shortages. Federal clarity replaces the patchwork of state permits that had stalled rollouts. Upfront spending on sensors, connectivity, and control software favors well-capitalized incumbents. As freight corridors digitize, mid-tier carriers may partner or risk margin erosion in the United States e-commerce logistics market.
Nationwide Open-Standard Parcel-Locker Network Reducing Failed First-Attempt Deliveries by 25%
Carriers and landlords standardize locker specifications so that any courier can use the same infrastructure, improving operational efficiency and encouraging broader consumer adoption in metropolitan areas. Each failed delivery used to cost USD 15-20 in re-delivery and service calls, so lockers rapidly repay the fixed investment. Retail centers and transit hubs host the systems, cutting porch theft and supporting 24/7 pickup. Shared infrastructure prevents the proliferation of single-carrier silos that under-utilize capital. Better first-attempt success improves gross margin on fast-delivery promises in the United States e-commerce logistics market.
State Micro-Fulfillment Tax Credits Spurring Sub-50k ft² Urban Warehouse Boom
Illinois, Ohio, and Texas offer property and investment tax breaks that offset steep urban rents, unlocking micro-fulfillment projects. Robotic picking and vertical storage lifts increase inventory density by threefold, so operators meet same-day cut-offs without massive facilities. Credits require job commitments that anchor new logistics roles in city cores. Regional retailers and 3PLs, once priced out of prime space, now gain proximity to demand nodes. The policy strengthens same-day economics and diversifies fulfillment real estate inside the United States e-commerce logistics market.
United States–Mexico Section 321 De Minimis Harmonization Fueling Cross-Border Parcel Volumes
Raising the duty-free threshold to USD 800 on both sides eliminates brokerage paperwork for low-value shipments, reducing clearance time from days to hours[2]International Trade Administration, “U.S.–Mexico Trade Facts,” trade.gov. Nearshored factories in Mexico connect directly with United States consumers, enhancing cross-border parcel flows and supporting faster, more reliable e-commerce deliveries. Fashion and electronics see the greatest benefit, since quick trend response beats ocean lead times. Logistics providers invest in bonded hubs along Texas crossings, bundling de minimis and commercial flows. Harmonization thus enlarges the United States e-commerce logistics market beyond domestic boundaries.
Restraints Impact Analysis*
| Restraint | (%) Impact on CAGR Forecast | Geographic Relevance | Impact Timeline |
|---|---|---|---|
| Carrier general rate increases above CPI in 2025-2027 | -1.6% | Nationwide | Short term (≤ 2 years) |
| Prolonged Panama Canal draft restrictions | -1.1% | West and Gulf Coast corridors | Medium term (2-4 years) |
| Stricter lithium-ion battery shipping rules | -0.8% | National electronics hubs | Long term (≥ 4 years) |
| Peak-season embargoes on oversized items | -0.6% | Nationwide | Short term (≤ 2 years) |
| Source: Mordor Intelligence | |||
Carrier General Rate Increases above CPI in 2025-2027
UPS and FedEx raised base parcel prices roughly 6% per year in 2025-2027, far outpacing the CPI, which hovered near 3%. Dimensional weight formulas amplify costs for bulky e-commerce packaging. Shippers negotiate hybrid portfolios that mix tier-1 for premium lanes with regional carriers for cost control. Packaging automation that shrinks box size gains urgency. Persistent price hikes compress merchant margins and temper growth within the United States e-commerce logistics market.
Prolonged Panama Canal Draft Restrictions Delaying Coastal Inventory Repositionin
Drought lowered allowable drafts to 44 feet through 2026, compelling carriers to offload 30-40% of containers or detour via Suez, which adds nearly two weeks to East Coast arrivals[3]Bloomberg News, “Panama Canal Drought Shipping Delays 2024,” bloomberg.com . Retailers shift to Gulf ports and rail land-bridges, but both options cost more. Furniture and seasonal imports feel the sting because timing determines markdown risk. Network redesign expenses weigh on working capital across the United States e-commerce logistics market.
*Our forecasts treat driver/restraint impacts as directional, not additive. The impact forecasts reflect baseline growth, mix effects, and variable interactions.
Segment Analysis
By Service: Warehousing Density Offsets Urban Rent Pressure
Transportation accounted for 66.5% of the United States e-commerce logistics market share in 2025, reflecting the need to cover vast domestic distances. Warehousing and fulfillment are projected to grow at a 7.9% CAGR to 2031 as micro-fulfillment centers pivot inventory closer to customers. Autonomous routing and electric line-haul temper transportation expansion, yet the segment remains indispensable. Cloud-based warehouse management, robotic picking, and vertical racking increase cubic utilization, enabling operators to earn acceptable returns within compact footprints. Incentive programs that rebate property taxes accelerate the conversion of light-industrial sites into automated hubs. Growing demand for kitting, labeling, and returns processing is turning fulfillment centers into revenue generators that bolster the overall United States E-Commerce Logistics market.
Operators outfit micro-fulfillment nodes with automated storage and retrieval systems that increase inventory density by 3x compared with legacy layouts. Labor requirements are halved, mitigating urban wage premiums. Downstream, transportation managers use API-driven platforms to stitch together regional carriers, crowdsourced couriers, and in-house fleets, optimizing for cost and promised delivery windows. Integration of middle-mile autonomy trims overnight transit times, expanding the one-day ground service radius. Collectively, service-level innovation sustains balanced growth in the United States E-Commerce Logistics market.


By Business Model: Platform-Enabled Peer Commerce Gains Momentum
The B2C model held 73.3 % of the United States e-commerce logistics market share in 2025 due to entrenched retail networks and negotiated carrier contracts. C2C transactions, however, will post a 7.84% CAGR through 2031 as social platforms, resale apps, and marketplace tools simplify peer-to-peer trade. Integrated label printing and doorstep pickup reduce seller effort, widening participation. Variability in parcel size and pick-up points challenges route density, so platforms bundle shipments at drop-off kiosks or retail counters. Professional packaging kits safeguard fragile items and reduce claims. Hybrid store-drop solutions also create foot traffic that retailers monetize.
B2B logistics remains stable, centered on bulk restocking and scheduled replenishment for corporate buyers. Yet as businesses emulate consumer checkout experiences, expectations for faster fulfillment spill over. Third-party logistics firms expand small-parcel divisions and embed real-time tracking. Across models, flexible APIs and modular services allow clients to shift volumes quickly, underpinning resilience within the United States e-commerce logistics market.
By Destination: Harmonized Rules Unleash Cross-Border Potential
Domestic flows accounted for 89.3% of the market share in 2025, but cross-border consignments to and from Mexico will expand at an 8.3% CAGR through 2031. Harmonization of Section 321 allows parcels valued at USD 800 or less to clear with minimal paperwork. Nearshored production hubs south of the border shorten lead times relative to Asia. Logistics providers build bonded warehouses and secure truck lanes to accelerate clearance. Consumers near the frontier enjoy delivery speeds that rival domestic benchmarks, reinforcing loyalty.
In the United States e-commerce logistics market, domestic networks continue to shoulder peak-season surges. Yet tariff risk, port congestion, and longer ocean legs motivate merchants to diversify sourcing. Cross-border success depends on bilingual customer service, compliant packaging, and advanced visibility tools that reassure shoppers about duties and timing.
By Delivery Speed: Density Economics Dictate Feasibility
Next-day delivery captured 41.8 % of the United States e-commerce logistics market share in 2025, thanks to its balance of cost and convenience. Same-day shipments are forecast to grow at 8.1% CAGR as urban lockers, micro-fulfillment, and electric vans converge. High-value discretionary goods, grocery replenishment, and urgent replacements drive uptake. Algorithms batch stops within tight radii, lifting courier productivity. Locker usage removes wasted trips when recipients are absent.
Standard three-to-five-day offerings persist for low-urgency categories and rural addresses. Retailers tier shipping fees to nudge consumers toward economically favorable speeds. Autonomous middle-mile assets shrink transit between regional sort centers, stretching the geography reachable within one day. Speed variety thus remains a strategic lever across the United States e-commerce logistics market.
By Product Category: Temperature Control Differentiates Food Logistics
Fashion and lifestyle maintained a 21.2% share in 2025 on the back of sophisticated return workflows that tackle apparel’s 30% reverse rate. Yet the food and beverage market size will rise at an 8.4% CAGR to 2031, forcing investment in refrigerated storage, insulated packaging, and validated cold-chain monitoring. IoT sensors log temperature and send alerts that enable proactive intervention. Subscription meal kits and rapid grocery restock anchor consistent high-density routes that justify premium handling.
Consumer electronics face lithium battery constraints, so providers with hazardous-materials certification win contracts[4].International Air Transport Association, “Lithium Batteries Dangerous Goods Regulations,” iata.org Furniture and appliances face seasonal embargoes, pushing retailers toward niche white-glove firms. Across all categories, value-added services such as assembly, installation, or eco-friendly packaging open new revenue pockets within the United States e-commerce logistics industry.
Geography Analysis
The South accounted for 32.2% of the market share in 2025, driven by port proximity, warehouse land priced at approximately USD 70 per ft², and scalable nearshoring corridors. A projected CAGR of 7.88% through 2031 is supported by growing cross-border traffic through Texas and Gulf Coast gateways. Fulfillment campuses are expanding along Interstate 35, connecting Monterrey factories with consumers in Dallas and Chicago.
West Coast corridors remain vital for Asia imports but battle disruption from Panama Canal draft limits and congested terminals. Some ocean freight shifts to East Coast ports or uses rail-and-bridge land routes, diluting regional dominance. The Northeast leverages a dense population to command premium same-day fees, yet zoning hurdles slow warehouse permit approvals. Repurposed malls and dark stores close the gap.
The Midwest sits at the population-weighted center, allowing a two-day ground reach to most households. Tax credits draw micro-fulfillment builds in Chicago, Detroit, and Columbus. Regional carriers offer affordable next-day links, reinforcing balanced growth across the United States E-Commerce Logistics market.
Competitive Landscape
The United States e-commerce logistics market exhibits high concentration. UPS and FedEx control around 60% of parcel flows, supported by nationwide hubs and integrated air fleets. To defend margins, both firms imposed rate hikes and invested in autonomous truck pilots, electric vans, and AI route planning. DHL, XPO, and GEODIS chase share through cold-chain buys, robotics deployments, and flexible capacity models. Crowdsourced platforms like Roadie and gig fleets fill same-day gaps for retailers that prefer asset-light contracts.
Regional carriers such as OnTrac and LaserShip expand footprints via mergers, offering shippers lower prices on high-volume lanes. Technology-enabled 3PLs ShipBob, Flexe, and ShipMonk scale micro-fulfillment without heavy real estate exposure by leasing on-demand space and sharing robotics. Value-added niches grow quickly: hazardous materials expertise wins electronics contracts, while white-glove teams capture oversized furniture deliveries during peak.
Regulatory compliance capacity becomes a barrier to entry as lithium battery rules, labor mandates, and environmental reporting stiffen. Carriers that automate paperwork and audit trails reduce shipper risk. Autonomous middle-mile approvals favor capital-rich players able to buy sensor-laden tractors. Electric van tax incentives reorder cost curves and spur fleet refresh cycles that smaller rivals may struggle to match, reshaping future competitive balance in the United States e-commerce logistics market.
United States E-commerce Logistics Industry Leaders
UPS Supply Chain Solutions
FedEx
USPS
Amazon Logistics
DHL E-commerce
- *Disclaimer: Major Players sorted in no particular order

Recent Industry Developments
- February 2026: A United States federal judge ruled UPS can offer USD 150,000 buyouts to unionized drivers, as part of workforce restructuring linked to slowing package volumes (especially e‑commerce / low‑margin deliveries).
- February 2026: FedEx and Advent International announced a definitive agreement to acquire European parcel locker pioneer InPost S.A. for approximately USD 9.2 billion.
- May 2025: DHL’s UK parcel business moved forward with a merger with Evri, significantly expanding combined parcel handling capacity and international delivery reach.
- March 2025: DHL acquired Packfleet, a UK‑based carbon‑neutral parcel delivery company, aligning with trends toward sustainability and last‑mile technology (important for e‑commerce deliveries).


United States E-commerce Logistics Market Report Scope
By Service
| Transportation | Road |
| Rail | |
| Air | |
| Sea | |
| Warehousing and Fulfilment | |
| Value-Added Services (Labelling, Packaging, Kitting) |
By Business Model
| B2C |
| B2B |
| C2C |
By Destination
| Domestic |
| Cross-border (international) |
By Delivery Speed
| Same-day (less than 24 h) |
| Next-day (24-48 h) |
| Standard (3-5 days) |
| Others (more than 5 days) |
By Product Category
| Foods and Beverages |
| Personal and Household Care |
| Fashion and Lifestyle (accessories, apparel, footwear) |
| Furniture |
| Consumer Electronics and Household Appliances |
| Other Products |
By US Region
| Northeast |
| Midwest |
| South |
| West |
| By Service | Transportation | Road |
| Rail | ||
| Air | ||
| Sea | ||
| Warehousing and Fulfilment | ||
| Value-Added Services (Labelling, Packaging, Kitting) | ||
| By Business Model | B2C | |
| B2B | ||
| C2C | ||
| By Destination | Domestic | |
| Cross-border (international) | ||
| By Delivery Speed | Same-day (less than 24 h) | |
| Next-day (24-48 h) | ||
| Standard (3-5 days) | ||
| Others (more than 5 days) | ||
| By Product Category | Foods and Beverages | |
| Personal and Household Care | ||
| Fashion and Lifestyle (accessories, apparel, footwear) | ||
| Furniture | ||
| Consumer Electronics and Household Appliances | ||
| Other Products | ||
| By US Region | Northeast | |
| Midwest | ||
| South | ||
| West |


Key Questions Answered in the Report
What CAGR is forecast for the United States E-Commerce Logistics market between 2026 and 2031?
The market is projected to grow at a 7.71% CAGR over 2026-2031, moving from USD 163.35 billion in 2026 to USD 236.85 billion by 2031.
How large is the South region’s share of US e-commerce logistics?
The South captured 32.2% of 2025 revenue and is anticipated to see a 7.88% CAGR to 2031, supported by port access and nearshoring flows.
Which segment shows the fastest growth by service type?
Warehousing and fulfillment services are expected to grow at a 7.9% CAGR through 2031, driven by investments in automated micro-fulfillment.
Why are parcel lockers important for same-day delivery economics?
Shared locker networks cut failed first-attempt deliveries by 25%, turning variable redelivery expense into a scalable fixed cost that supports profitable same-day services.
What impact do lithium-ion battery regulations have on electronics shipping?
Class 9 hazardous-goods rules limit air cargo capacity and add packaging complexity, so electronics sellers must hold more regional inventory to meet next-day promises.
How are Federal tax credits influencing last-mile fleet choices?
A 30% investment credit under the Inflation Reduction Act helps electric vans achieve cost parity within four years, lowering per-stop delivery costs by up to 20% in dense urban routes.
Page last updated on:


