Department Stores Market Size and Share
Market Overview
| Study Period | 2021 - 2031 |
|---|---|
| Forecast Data Period | 2026 - 2031 |
| Historical Data Period | 2021 - 2024 |
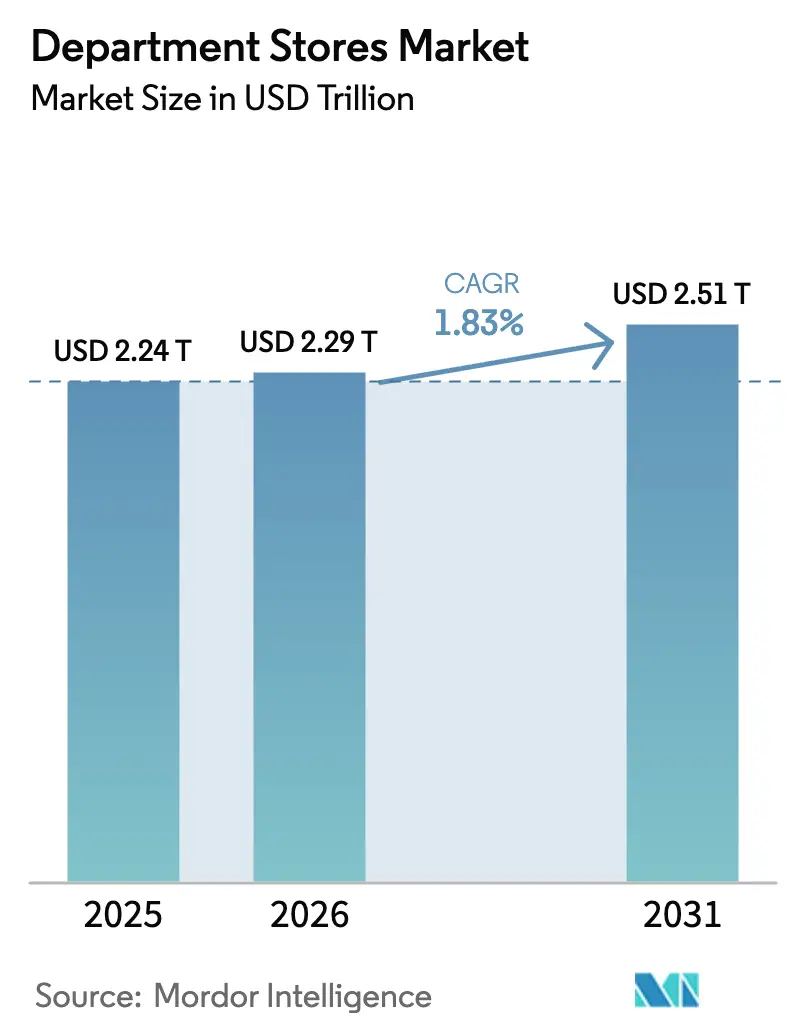
| Market Size (2026) | USD 2.29 Trillion |
| Market Size (2031) | USD 2.51 Trillion |
| Growth Rate (2026 - 2031) | 1.83% CAGR |
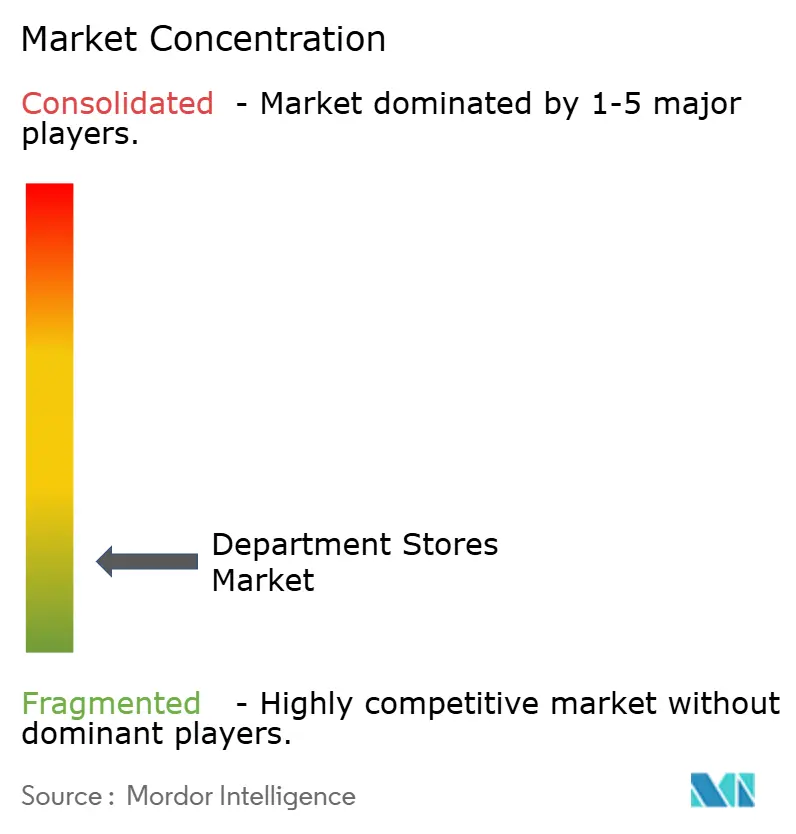
| Market Concentration | Low |
Major Players *Disclaimer: Major Players sorted in no particular order Image © Mordor Intelligence. Reuse requires attribution under CC BY 4.0. | |
Department Stores Market Analysis by Mordor Intelligence
The department stores market size stood at USD 2.24 trillion in 2025, is projected to reach USD 2.29 trillion in 2026, and is expected to expand to USD 2.51 trillion by 2031, reflecting a 1.83% CAGR during 2026–2031. Store strategies in 2026 focus on experience-led floor plans, curated assortments, and service intensity that improves conversion and attachment rates, supported by renewed investment in store labor and visual standards. The share of U.S. retail transactions conducted online reached 16.4% in Q3 2025, reinforcing the role of stores as the primary venue for discovery, service, and immediate fulfillment in the department stores market.[1]U.S. Census Bureau, “Quarterly Retail E-Commerce Sales, 3rd Quarter 2025,” U.S. Census Bureau, census.gov. Operators are deepening omnichannel features such as store fulfillment for digital orders, buy online, pickup in store, and localized delivery windows to reduce shipping costs and improve speed. Off-price leaders continue to scale store fleets to capture value-seeking demand, while full-line banners focus on remodeling high-potential locations and upgrading supply chain nodes that serve unified commerce flows.
Key Report Takeaways
- By product type, Apparel & Accessories accounted for 40.22% of the department stores' market revenue in 2025, while Softline is the fastest-growing category with a 7.86% CAGR through 2031.
- By store format, Full-line stores commanded 32.84% of the department stores market in 2025 revenue, while Off-price is growing fastest at a 9.45% CAGR through 2031 as consumers prioritize value and immediacy.
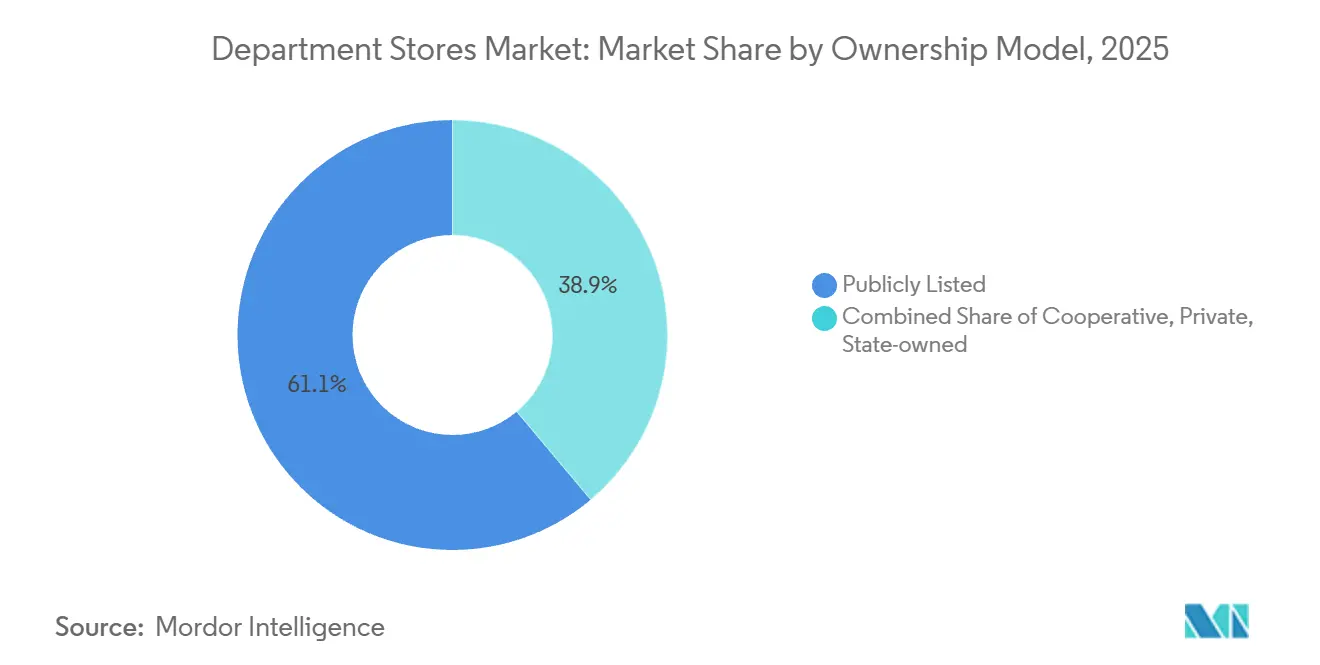
- By ownership structure, Publicly Listed operators captured 61.12% of the department stores market in 2025 revenue, while Private operators are expanding at a 7.44% CAGR through 2031 on the back of flexible capital structures.
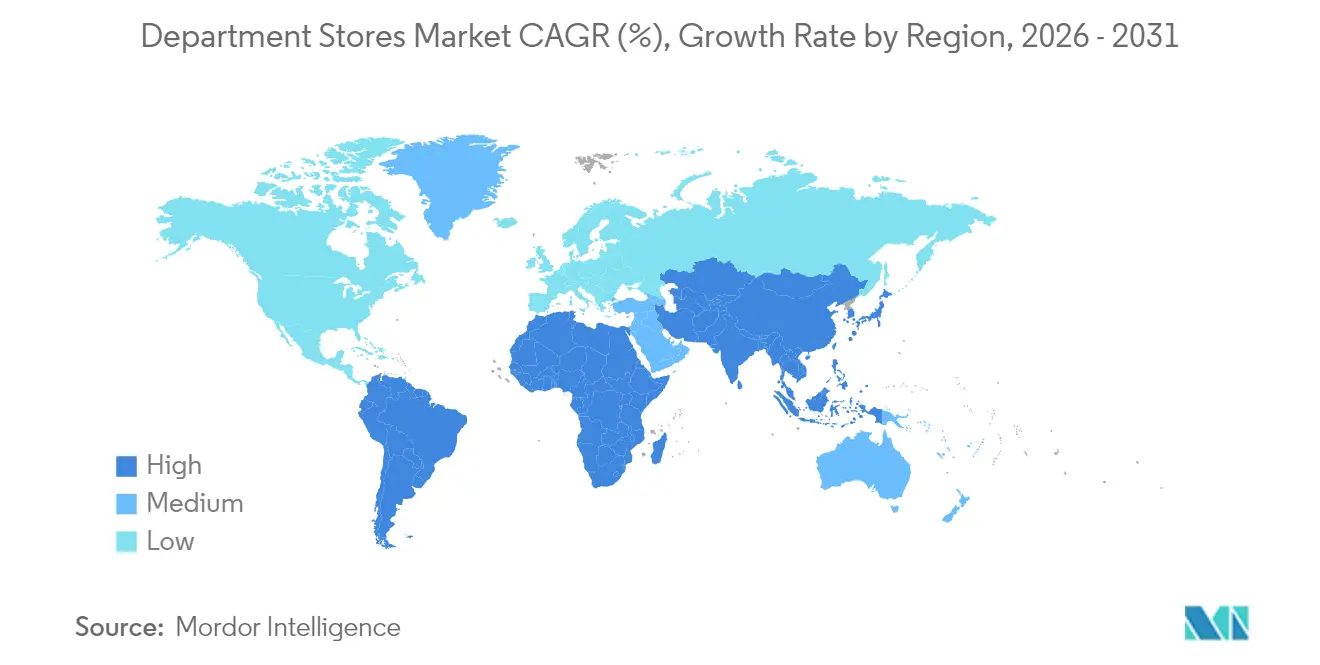
- By geography, North America held 42.31% of the department stores market in 2025 revenue, while Asia-Pacific is projected to grow fastest at a 6.86% CAGR to 2031, reflecting favorable demographics and store network investment.
Note: Market size and forecast figures in this report are generated using Mordor Intelligence’s proprietary estimation framework, updated with the latest available data and insights as of 2026.
Global Department Stores Market Trends and Insights
Drivers Impact Analysis*
| Driver | (~) % Impact on CAGR Forecast | Geographic Relevance | Impact Timeline |
|---|---|---|---|
| Accelerated Repeat Purchases Through Omnichannel Integration | +0.4% | Global, with the highest penetration in North America and the EU, and rapid uptake in APAC urban cores | Medium term (2-4 years) |
| Recovery of Destination Shopping Trips After the Pandemic | +0.3% | North America, EU flagship metros, APAC luxury corridors such as Seoul, Tokyo, Singapore | Short term (≤ 2 years) |
| Growing Middle-Class in APAC Driving Higher Discretionary Spending | +0.5% | APAC core with spill-over to MEA emerging markets | Long term (≥ 4 years) |
| Off-Price Spin-Offs Attract Value-Oriented Consumers | +0.3% | North America is dominant with expansion into Latin America and APAC suburban zones. | Medium term (2-4 years) |
| AI-Powered In-Store Personalization Enhances Conversion Rates | +0.2% | North America and EU early adopters with APAC following via mobile-first rollouts | Medium term (2-4 years) |
| Revenue Generation From Micro-Fulfillment Using Store Back-End Assets | +0.1% | Global with a concentration in dense urban markets with high online penetration | Long term (≥ 4 years) |
| Source: Mordor Intelligence | |||
Accelerated Repeat Purchases Through Omnichannel Integration
Department stores are connecting digital discovery with store-based services to streamline shopping journeys and drive repeat visits. Operators continue to prioritize buy online, pickup in store, and ship from store to reduce delivery times and increase conversion rates for high-intent baskets. Nordstrom enabled store fulfillment for Rack digital orders across more than 100 Rack locations in 2024, improving inventory turns while lowering last-mile expenses in dense trade areas.[2]Nordstrom, Inc., “Nordstrom Reports Fourth Quarter 2024 Earnings,” Nordstrom, Inc., nordstrom.com. John Lewis expanded its delivery-from-store capabilities during FY2024/25 to maintain availability, reduce reliance on distribution centers, and enhance the in-store proposition through better service allocation. Macy’s broadened its “Reimagine 125” program to elevate merchandising and staffing at a defined store cohort, and these locations outperformed the fleet on comparable sales in late 2025. As online’s share of United States retail sales reached 16.4% in Q3 2025, integrated fulfillment and service continue to help the department stores market convert hybrid shoppers who expect speed, convenience, and consistent assortments across channels.[3]U.S. Census Bureau, “Quarterly Retail E-Commerce Sales, 3rd Quarter 2025,” U.S. Census Bureau, census.gov.
Recovery of Destination Shopping Trips After the Pandemic
Premium department stores are repositioning flagships as service-centric destinations to reinforce in-person visits and strengthen brand engagement. Selfridges completed a major beauty hall refurbishment that delivered higher appointment volumes and stronger category sales following reopening, which validated investment in clienteling and hands-on services. Macy’s reported that elevated staffing and visual standards at “Reimagine 125” locations supported better traffic conversion and relative comp sales in 2025, which supports a focus on targeted upgrades over broad footprint growth. [4]Investing.com, “Macy’s Q1 2025 Earnings Call,” investing.com. ICSC surveys in 2026 indicate that consumers continue to value in-store experiences in the post-pandemic period, which helps well-positioned centers maintain resilient performance relative to lower-tier venues. Department store operators are pairing service expansion with omnichannel features such as click-and-collect to improve trip productivity and support a balanced ticket mix. As a result, the department stores market benefits from a flight-to-quality pattern that concentrates traffic at top assets where experience, service, and brand curation are strongest.
Growing Middle-Class in APAC Driving Higher Discretionary Spending
Asia-Pacific operators are investing in large, service-rich stores and digital engagement to meet rising discretionary demand in urban cores. Isetan Mitsukoshi reported a record operating profit for the nine months ended December 31, 2025, supported by better performance at its domestic flagships and the onboarding of new digital users to its group app, indicating a healthy customer response to integrated retail experiences. The company’s app, launched in March 2025 and named MITSUKOSHI ISETAN JAPAN, reached hundreds of thousands of users within months, and this channel now supports personalization, multilingual services, and curated product pairing for cross-sell potential.[5]Isetan Mitsukoshi Holdings, “Explanatory Materials for the Nine Months Ended December 31, 2025,” Isetan Mitsukoshi Holdings, imhds.co.jp. Lotte Shopping has outlined a Southeast Asia strategy that includes establishing an international headquarters in Singapore in 2026, reflecting a long-term view of APAC consumption gains and cross-border retail flows.[6]EDB Singapore, “Lotte to Open HQ in Singapore,” edb.gov.sg. Central Retail continues to scale regional platforms in Thailand and Vietnam, with new mall openings and planned renovations that support anchor tenants and department store traffic in mixed-use complexes. These investments strengthen the department stores market in APAC by combining high-touch service with mobile-first engagement that aligns with regional shopper behavior.
Off-Price Spin-Offs Attract Value-Oriented Consumers
Off-price growth is anchored in everyday value, opportunistic buying, and a treasure-hunt experience that drives repeat transactions. TJX Companies reported USD 56.4 billion in FY2025 net sales, with comparable store sales up 4%, and plans continued fleet expansion across Marmaxx, HomeGoods, and Sierra in FY2026, underscoring the format's operating resilience.[7]The TJX Companies, Inc., “Form 10-K for FY2025,” The TJX Companies, Inc., investor.tjx.com. Ross Stores generated USD 21.129 billion in FY2024 sales with 3% comparable sales growth and expects to open about 90 new stores in FY2025, which advances off-price penetration in more suburban and secondary trade areas. [8]Ross Stores, Inc., “Form 10-K for FY2024,” Ross Stores, Inc., investors.rossstores.com. Macy’s Backstage shop-in-shop concepts outperformed full-line stores in 2025, indicating demand for value adjacency within legacy banners. These moves collectively expand the department stores market by bringing value-oriented consumers into the channel with convenient locations and curated price discovery.
Restraints Impact Analysis*
| Restraint | (~) % Impact on CAGR Forecast | Geographic Relevance | Impact Timeline |
|---|---|---|---|
| Competitive Pressure From E-Commerce Pure-Play Retailers | -0.3% | Global, most acute in North America and China, where pure-plays hold a high share | Short term (≤ 2 years) |
| Declining Mall Foot Traffic in Mature Western Markets | -0.2% | North America and the EU, especially at lower-tier malls | Medium term (2-4 years) |
| Margin Compression Due to Inflation in Merchandise Mix | -0.2% | Global with sharper effects in import-dependent Latin America and APAC | Short term (≤ 2 years) |
| Rising Scope-3 Sustainability Compliance Costs | -0.1% | EU-led, expanding in North America and select APAC markets such as Japan and Australia | Long term (≥ 4 years) |
| Source: Mordor Intelligence | |||
Competitive Pressure From E-Commerce Pure-Play Retailers
Pure-play e-commerce retailers continue to drive pricing transparency and higher convenience expectations, putting pressure on margins for large-format department stores. With online sales representing a growing share of total retail activity, department stores are responding through omnichannel strategies, including same-day pickup, curated fittings, and personalized in-store service. Off-price banners and marketplace models help maintain value perception while managing inventory and markdown risks. Investments in unified merchandising, digital tools, and supply chain enhancements allow operators to sustain conversion amid rising online competition. Premium categories such as beauty and luxury services remain resilient, as experiential offerings and personalized clienteling drive a higher willingness to pay than for commoditized goods.
Declining Mall Foot Traffic in Mature Western Markets
Traffic trends remain uneven across centers, with premium malls faring better than secondary assets as retailers consolidate store fleets into more productive locations. Macy’s closed underperforming locations during 2024–2025 and prioritized capital toward a defined cohort of reimagined stores and a new automated fulfillment center, aligning footprint with demand contours. ICSC data from 2026 shows that shoppers maintain interest in in-store experiences, yet value sensitivity influences trip frequency and basket composition, encouraging retailers to focus on top properties and differentiated formats. John Lewis refreshed its stores and supply chain capabilities to improve service consistency and assortment relevance across its estate, helping mitigate traffic volatility at mid-tier centers. Operators that concentrate investment on class-leading venues and embed omnichannel convenience are better positioned to preserve share in the department stores market amid uneven center footfall.
*Our forecasts treat driver/restraint impacts as directional, not additive. The impact forecasts reflect baseline growth, mix effects, and variable interactions.
Segment Analysis
By Product Type: Softline Scales as Consumers Reimagine Home Environments
Apparel & Accessories accounted for 40.22% of 2025 revenue, while Softline is projected as the fastest-growing category with a 7.86% CAGR during 2026–2031 in the department stores market. The department stores market has leaned on home textiles, décor, and furnishings to capture at-home lifestyle upgrades that remain relevant in 2026. TJX’s HomeGoods banner continues to add stores across the U.S., and fleet expansion is supported by opportunistic buying and high repeat intent among value-focused decorators. John Lewis reported outperformance in home-related categories alongside new brand partnerships, which signals durable demand for practical, design-forward products that are easy to maintain. Grocery-led banners in broader retail ecosystems reinforce multi-trip behaviors that benefit adjacent home lines, and food halls inside premium department stores can support visit frequency and incremental cross-category sales.
The department stores market also adapts to changing fashion dynamics through more flexible merchandising and service-led selling. Selfridges invested in immersive brand activations and enhanced beauty services during 2024–2025, which supported higher appointments and healthy category sell-through after the renovation. Department stores are broadening their circular and resale offerings in accessories, watches, and handbags to serve value- and sustainability-minded shoppers, complementing full-price newness with lifecycle options. Operators are also deepening private label where relevant to manage margin pressure and retain design control, especially in basics and seasonal accents within the department stores industry. Compliance frameworks for packaging, product safety, and environmental reporting are now embedded in buying and sourcing, and these requirements influence costs, lead times, and on-shelf claims across soft goods.


By Store Format: Off-Price Formats Steal Share from Full-Line Flagships
Full-line stores represented 32.84% of 2025 revenue, while Off-price is forecast to grow fastest at a 9.45% CAGR through 2031 in the department stores market. Major operators like TJX and Ross are pursuing long-term store growth, reflecting the broad appeal of discounted shopping. Nordstrom’s off-price banner has strengthened digital order fulfillment, improving inventory productivity and delivery speed. Macy’s Backstage has outperformed its full-line stores, prompting investments to enhance the premium store experience in high-traffic locations. Together, these strategies support the department stores market by offering a mix of value-driven and elevated service experiences that cater to diverse shopper preferences.
Smaller urban and neighborhood formats also attract investment where convenience and curation can drive high repeat intent. Convenience expansion within multi-banner groups aligns with omnichannel trips that include pickup and rapid replenishment, supporting stable traffic outside destination malls. Luxury departments continue to prioritize experiential retail, concierge services, and exclusive brand programs, which sustain price premiums and attract tourism-linked demand in cosmopolitan centers. Format choices increasingly reflect local real estate economics, labor availability, and fulfillment density rather than a one-size-fits-all footprint, and this mix helps stabilize returns through the cycles of the department store industry. As operators adjust their store portfolios, capital shifts from marginal boxes to high-productivity sites, with omnichannel capabilities embedded to improve cash conversion and reduce volatility in the department stores market.
By Ownership Structure: Private Operators Gain Agility as Public Peers Face Quarterly Pressures
Publicly listed operators accounted for 61.12% of 2025 revenue, while Private operators are projected to grow fastest at a 7.44% CAGR during 2026–2031 in the department stores market. Nordstrom’s go-private transaction, announced in late 2024, outlines a path to operate as a private, wholly owned subsidiary following closing in 2025, which is designed to support long-horizon investments without quarter-to-quarter earnings constraints. John Lewis, an employee-owned cooperative, prioritized wage investments and store and supply chain modernization in FY2024/25, which aligns incentives with service delivery and estate upgrade goals. Macy’s raised USD 500 million in senior notes in 2025 to manage near-term maturities and continue its transformation, which reflects how public issuers actively optimize balance sheets to fund store and digital programs. These governance models shape capital access, risk appetite, and the cadence of portfolio change, which in turn influence competitive positioning in the department stores market.
Private groups and cooperatives can often test small-format and experiential concepts more freely, while publicly listed peers bring scale, supplier relationships, and access to capital markets. El Corte Inglés advanced multi-year store upgrades across several locations in early 2025, which shows how sizable private organizations commit capital to modernize large footprints. Nordstrom’s private transaction structure with a strategic partner is notable for aligning merchandise ecosystems across borders while simplifying governance, though it will still operate under rigorous reporting and control regimes. Publicly listed peers continue to rationalize lower-productivity stores while investing in digital and supply chain projects at scale, which can accelerate unified commerce maturity in the department stores market. Over the forecast period, ownership structures that support clean data foundations, agile pilots, and sustained capex are likely to outperform in the department stores market.
Geography Analysis
North America accounted for 42.31% of 2025 revenue, and its growth profile remains steady as operators close underperforming stores and invest in omnichannel assets that drive conversion and speed in the department stores market. Macy’s closed weaker locations and concentrated capex on a defined cohort of reimagined stores and a new automated fulfillment center that together back unified service promises across selling channels. Nordstrom expanded store fulfillment across Rack stores and reported stabilization in select subcategories as service, speed, and breadth converged. The online share of retail in the United States rose to 16.4% in Q3 2025, which keeps pressure on prices and logistics while reinforcing stores as the locus of experience in the department store market.
Asia-Pacific is projected to grow at a 6.86% CAGR through 2031, supported by urbanization, higher discretionary budgets, and service innovation anchored by leading domestic groups in Japan, Korea, and Southeast Asia. Isetan Mitsukoshi posted record operating profit for the nine months ended December 31, 2025, and expanded its app-based engagement to serve both domestic and inbound shoppers with culturally relevant content and support. Lotte Shopping is establishing an international headquarters in Singapore in 2026 and pursuing premium retail projects in Southeast Asia aligned with regional consumption growth. Central Retail reported new mall openings in Vietnam and planned renovations in Thailand for 2025, which strengthen anchor-tenant draw and footfall for department store banners in mixed-use projects. These efforts reflect integrated strategies that blend flagship experience with mobile-first engagement to grow the department stores market in APAC.
Europe remains a large and mature region with a focus on store refurbishments, digital capability upgrades, and category curation that aligns with local preferences in the department stores market. John Lewis reported improved profitability in FY2024/25 and outlined a plan to invest in stores, technology, and supply chain in FY2025/26 to reinforce service and assortment depth. Marks & Spencer delivered a strong FY2024/25 performance and continued to optimize its store network and product mix across food and general merchandise to meet changing shopper needs. El Corte Inglés continued multi-site upgrades in early 2025, with investments to modernize stores that support premium brands and service-led selling. Across EMEA, off-price and value channels also expand, including partnerships that extend store networks into the Middle East, such as TJX’s strategic stake in Brands for Less, which adds to the region’s accessible fashion and home offer.

Competitive Landscape
The department stores market demonstrates moderate concentration, with global leaders leaving opportunities for regional and specialty operators to expand. In North America, major chains are closing underperforming locations while investing in reimagined stores and upgraded supply chains to enable faster, more reliable omnichannel service. Off-price banners and niche operators complement full-line stores by offering differentiated experiences for value-seeking consumers. In Europe, retailers are modernizing stores and back-end systems while emphasizing service and experiential offerings to reinforce destination appeal. These approaches combine service enhancement, data-driven operations, and selective footprint adjustments to compete on speed, relevance, and curated offerings.
Off-price specialists continue to strengthen their position through disciplined expansion and strategic inventory management that preserves margins despite promotional pressures. Leading operators are broadening geographic reach through local partnerships, supporting growth in new markets while maintaining operational efficiency. Value-focused stores are expanding offerings to meet diverse shopper needs, enhancing supply chain effectiveness and market density. In the Asia-Pacific region, retailers are leveraging digital platforms alongside high-touch service to meet rising urban consumption and tourism-driven demand. Together, these strategies reinforce local brand portfolios and delivery networks that underpin sustainable growth in the department stores market.
Technology and supply chain modernization remain critical to competitive advantage as omnichannel demand stabilizes after pandemic-era surges. Retailers are investing in automation, fulfillment capabilities, and store refurbishments to improve conversion, customer satisfaction, and lifetime value. Integrating technology with curated brand experiences allows operators to maintain speed, reliability, and service quality across all channels. By aligning physical and digital offerings, department stores can meet evolving consumer expectations while protecting margins. The market favors operators who deliver a seamless combination of curated experiences, fast fulfillment, and meaningful service as part of a unified value proposition.
Department Stores Industry Leaders
Macy’s Inc.
Lotte Shopping Co.
El Corte Inglés
Marks & Spencer Group
Falabella S.A.
- *Disclaimer: Major Players sorted in no particular order

Recent Industry Developments
- July 2025: Macy’s Retail Holdings, LLC issued USD 500 million of 7.375% senior notes due 2033 and used proceeds for tenders and redemptions of near-term maturities, while amending its asset-based facility in April 2025 to extend maturity and reduce commitments.
- March 2025: John Lewis Partnership reported FY2024/25 results with improved profitability and announced a planned FY2025/26 investment program of £600 million for store refurbishments, technology, and supply chain modernization, while opening a new Waitrose convenience location as part of a growth pipeline.
- February 2025: Macy’s expanded its “Reimagine 125 Locations” program to a total of 125 stores and opened a new fulfillment center with automation, robotics, and AI to support omnichannel service.
- April 2025: TJX Companies completed equity investments in a 49% stake in Multibrand Outlet Stores in Mexico and a 35% stake in Brands for Less in the Middle East, broadening its reach in fast-growing off-price markets.


Global Department Stores Market Report Scope
The department stores industry comprises companies that run establishments primarily catering/ retailing various products to the general consumer. There are different types of products sold in any department store; products such as pharmaceuticals, appliances, footwear, personal care products, apparel, toys, sports-related products, cosmetics, home furnishing-related products, automotive-related products, jewelry, hardware, garden-related products, and many more.. Department Stores Market is segmented by product type (Apparel and Accessories, FMCG, Hardline and Softline), by geography (North America, Europe, Asia-Pacific, Middle-East and Africa, and South America). The report offers market size and forecasts for the Global Department Stores Market in value (USD Billion) for all the above segments.
| Apparel & Accessories |
| FMCG |
| Hardline |
| Softline |
| Full-line |
| Off-price |
| Discount |
| Luxury |
| Online Department Stores |
| Small-format / Neighborhood |
| Publicly Listed |
| Private |
| Cooperative |
| State-owned |
| North America | United States |
| Canada | |
| Mexico | |
| South America | Brazil |
| Peru | |
| Chile | |
| Argentina | |
| Rest of South America | |
| Europe | United Kingdom |
| Germany | |
| France | |
| Spain | |
| Italy | |
| BENELUX | |
| NORDICS | |
| Rest of Europe | |
| Asia-Pacific | India |
| China | |
| Japan | |
| Australia | |
| South Korea | |
| South-East Asia | |
| Rest of Asia-Pacific | |
| Middle East and Africa | United Arab Emirates |
| Saudi Arabia | |
| South Africa | |
| Nigeria | |
| Rest of Middle East and Africa |
| By Product Type | Apparel & Accessories | |
| FMCG | ||
| Hardline | ||
| Softline | ||
| By Store Format | Full-line | |
| Off-price | ||
| Discount | ||
| Luxury | ||
| Online Department Stores | ||
| Small-format / Neighborhood | ||
| By Ownership Model | Publicly Listed | |
| Private | ||
| Cooperative | ||
| State-owned | ||
| By Geography | North America | United States |
| Canada | ||
| Mexico | ||
| South America | Brazil | |
| Peru | ||
| Chile | ||
| Argentina | ||
| Rest of South America | ||
| Europe | United Kingdom | |
| Germany | ||
| France | ||
| Spain | ||
| Italy | ||
| BENELUX | ||
| NORDICS | ||
| Rest of Europe | ||
| Asia-Pacific | India | |
| China | ||
| Japan | ||
| Australia | ||
| South Korea | ||
| South-East Asia | ||
| Rest of Asia-Pacific | ||
| Middle East and Africa | United Arab Emirates | |
| Saudi Arabia | ||
| South Africa | ||
| Nigeria | ||
| Rest of Middle East and Africa | ||


Key Questions Answered in the Report
What is the current size and growth outlook for the department stores market?
The department stores market size is USD 2.24 trillion in 2025, projected at USD 2.29 trillion in 2026, and expected to reach USD 2.51 trillion by 2031 at a 1.83% CAGR during 2026–2031.
Which product categories and formats are leading in performance through 2031?
Apparel & Accessories leads by share at 40.22% in 2025, while Softline is the fastest-growing category at a 7.86% CAGR; Full-line stores hold 32.84% share, and Off-price grows fastest at a 9.45% CAGR.
How are leading operators improving omnichannel economics?
Operators are expanding ship-from-store, buy-online-pickup-in-store, and store fulfillment, upgrading supply chains with automation, and investing in reimagined store cohorts that lift conversion and speed.
Which regions are set to grow fastest and why?
Asia-Pacific is forecast to grow at a 6.86% CAGR through 2031, driven by urbanization, rising discretionary income, and service-led investments by local leaders and international groups.
How are AI and store technology shaping competitive advantage?
AI-enabled personalization, clienteling, and marketplace curation are being combined with in-store service upgrades and micro-fulfillment to raise conversion, speed, and attachment while managing returns.
What is the role of off-price banners in the broader channel?
Off-price banners extend the department stores market by capturing value-seeking trips with opportunistic buying and treasure-hunt discovery, supported by ongoing fleet expansion from TJX and Ross.
Page last updated on:


