Market Overview
| Study Period | 2020 - 2031 |
|---|---|
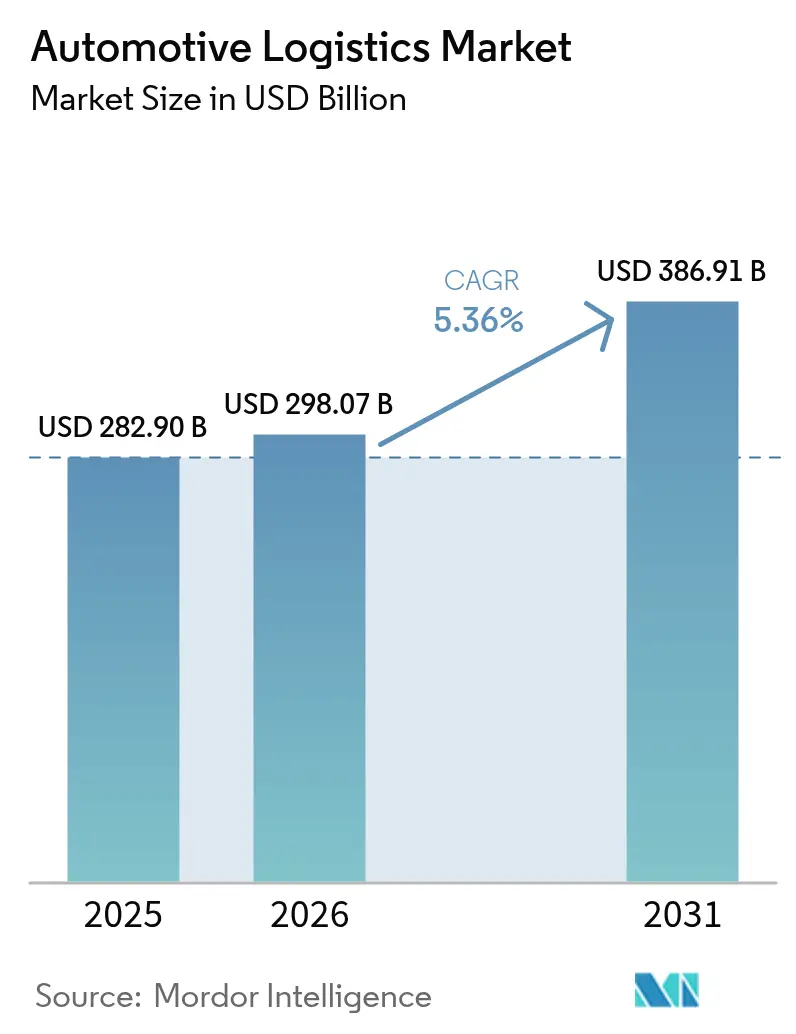
| Market Size (2026) | USD 298.07 Billion |
| Market Size (2031) | USD 386.91 Billion |
| Growth Rate (2026 - 2031) | 5.36% CAGR |
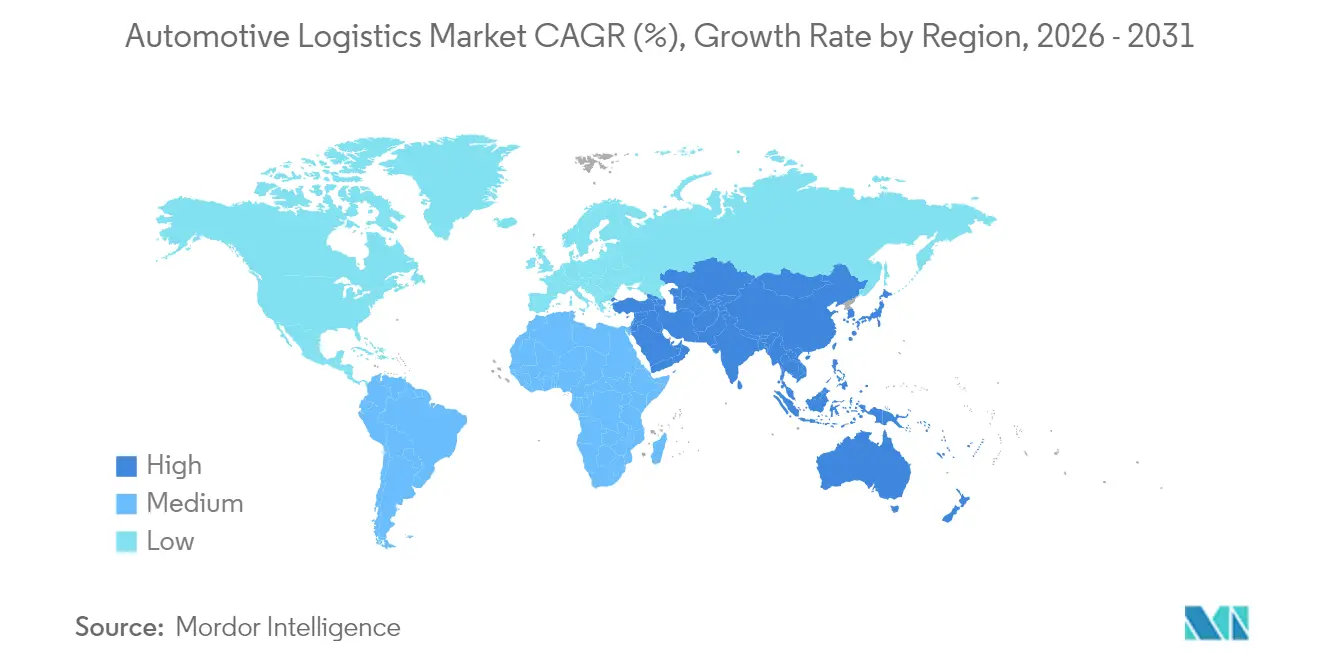
| Fastest Growing Market | Asia-Pacific |
| Largest Market | Asia-Pacific |
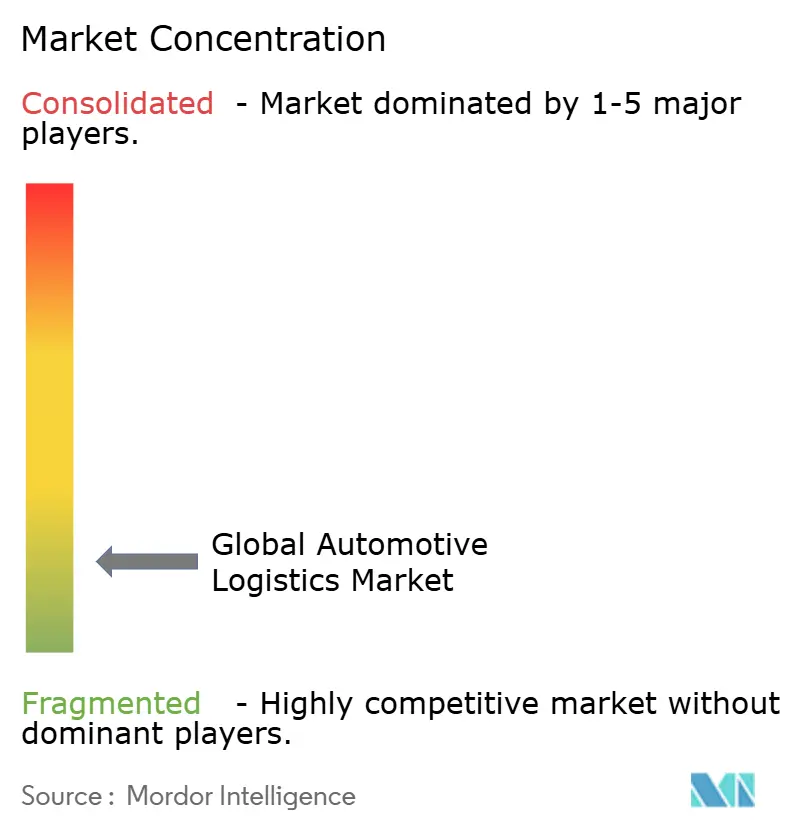
| Market Concentration | Low |
Major Players *Disclaimer: Major Players sorted in no particular order Image © Mordor Intelligence. Reuse requires attribution under CC BY 4.0. | |
Automotive Logistics Market Analysis by Mordor Intelligence
The Automotive Logistics Market size is expected to grow from USD 282.90 billion in 2025 to USD 298.07 billion in 2026 and is forecast to reach USD 386.91 billion by 2031 at 5.36% CAGR over 2026-2031.
Continued electrification of passenger and commercial fleets, the rapid digitalization of aftermarket fulfillment, and the spread of mobility-as-a-service programs are expanding contract scope and shipment complexity for logistics providers[1]Frank Appel, “Strategy 2030,” DHL Group, dhl.com. Modal shifts from road to rail and sea are accelerating as corporate sustainability targets tighten, while mergers among global 3PLs are creating scale advantages that reshape competitive dynamics. At the same time, same-day and next-day delivery expectations in e-commerce are pushing automation investments in micro-fulfillment, and integrated visibility platforms are becoming a prerequisite for winning long-term automotive contracts.
Key Report Takeaways
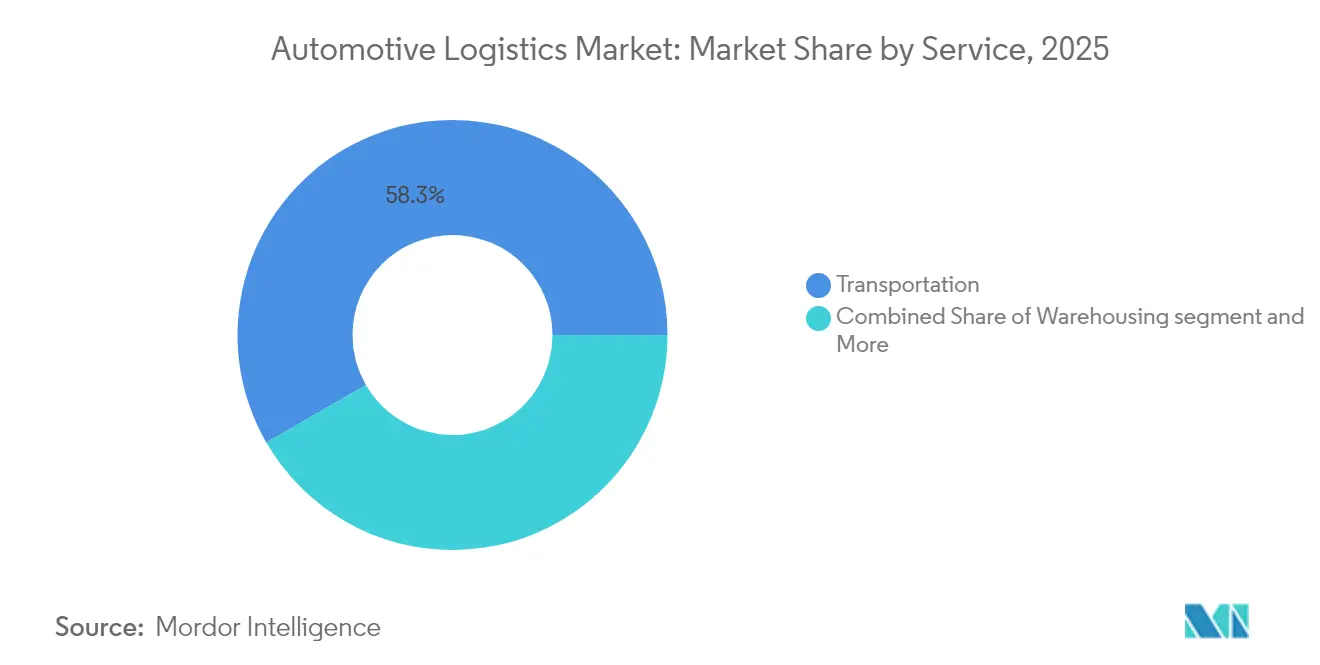
- By service, transportation led with 58.34% of the global automotive logistics market share in 2025; value-added services are projected to expand at a 6.94% CAGR to 2031.
- By type, the OEM segment accounted for 72.55% share of the global automotive logistics market size in 2025, while aftermarket logistics records the highest projected CAGR at 6.28% through 2031.
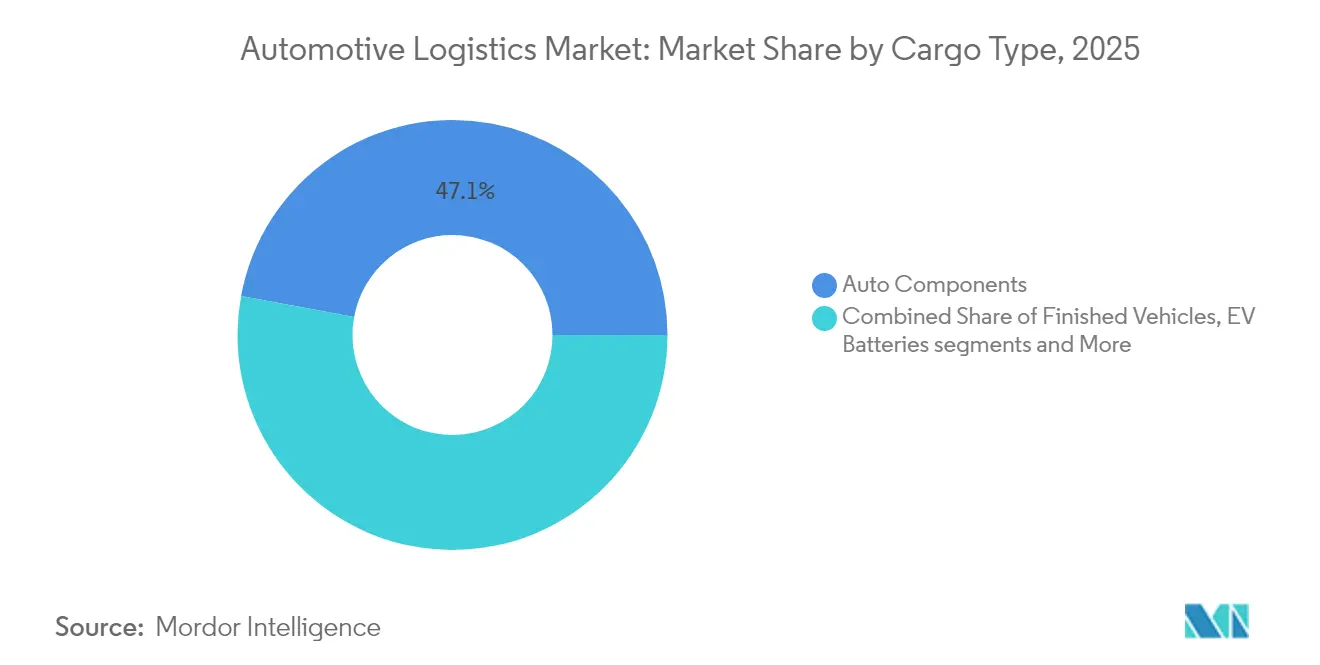
- By cargo type, auto components captured a 47.10% share of the global automotive logistics market in 2025; EV batteries and power electronics are advancing at an 11.25% CAGR to 2031.
- By delivery time, standard services commanded 80.75% share of the global automotive logistics market size in 2025; express and critical services are set to grow at a 7.62% CAGR during 2026-2031.
- By geography, Asia-Pacific held 47.35% revenue share in 2025 and is expected to post the fastest 6.55% CAGR, reflecting its concentration of vehicle and battery production.
Note: Market size and forecast figures in this report are generated using Mordor Intelligence’s proprietary estimation framework, updated with the latest available data and insights as of 2026.
Global Automotive Logistics Market Trends and Insights
Drivers Impact Analysis*
| Driver | ( ~ ) % Impact on CAGR Forecast | Geographic Relevance | Impact Timeline |
|---|---|---|---|
| Battery-electric vehicle adoption lifts finished-vehicle flows | +1.2% | Global (Asia-Pacific, Europe lead) | Medium term (2-4 years) |
| E-commerce demand for aftermarket parts accelerates same-day delivery | +0.8% | North America, Europe | Short term (≤ 2 years) |
| Vehicle subscription and mobility-as-a-service intensify fleet turnover | +0.6% | North America, Europe, Asia-Pacific | Medium term (2-4 years) |
| End-to-end shipment visibility expectations spur platform-enabled 3PL contracts | +0.4% | Global | Short term (≤ 2 years) |
| Rising Global Average Vehicle Age Elevating Aftermarket Parts Replacement Frequency | +0.7% | Global, particularly emerging markets | Long term (≥ 4 years) |
| Corporate Sustainability Targets Steering Modal Shift Toward Rail & Sea Transport | +0.5% | Global, strongest in Europe and North America | Long term (≥ 4 years) |
| Source: Mordor Intelligence | |||


Acceleration of Battery-Electric Vehicle Adoption Raising Finished-Vehicle Flows
Global electric vehicle penetration is forecast to top 20% in 2025, driving demand for specialized battery supply chains and new finished-vehicle corridors. DHL has opened EV Centers of Excellence in Asia-Pacific and Europe, providing temperature-controlled storage, DG-compliant handling, and multimodal outbound solutions. Maersk’s EV Battery Flex Flow program halves warehouse footprints by using reusable containers and advanced fire-suppression, cutting logistics costs by 30% for cell manufacturers. Western 3PLs are also investing in Chinese corridor capacity as the country maintains 70% cathode and 85% anode output, making near-shoring of buffer stocks crucial for European and North American OEMs. The capital intensity of battery handling depots is prompting joint ventures between carriers and energy firms to pool infrastructure spending.
E-commerce Boom in Aftermarket Parts Creating Same-Day/Next-Day Delivery Expectations
Online parts revenue now accounts for double-digit share of global aftermarket sales, prompting a shift from regional distribution centers to micro-fulfillment nodes closer to urban drivers. AutoStore deployments at leading spare-parts distributors raise storage density by 300% and deliver 99.6% uptime, enabling two-hour cut-off times for 30,000 SKU assortments. Kia Israel’s hardware-less tracking reduced vehicle search time from hours to minutes, freeing 50% of labor and trimming processing time by up to 40%[2]Laurent Petizon, “Flexis SAS Joint Venture,” Renault Group, automotivelogistics.media. Logistics providers now bundle predictive inventory tools with last-mile networks to secure long-term contracts, while suburban cross-docks replenish rural routes overnight to meet weekend service guarantees.
Growth of Vehicle Subscription & Mobility-as-a-Service Increasing Fleet Turnover Logistics
Short-cycle fleet models require continual re-deployment, seasonal rotation, and rapid de-fleeting, demanding higher frequency transport and refurbishment. BMW’s Virtual Factory digital twin, covering 30 plants, lowers planning costs by 30% and synchronizes logistics for subscription fleets across Europe and Asia. Chinese OEMs such as BYD are integrating captive logistics subsidiaries that reposition vehicles every 3-6 months, challenging traditional 3PL share in intra-city relocation. The need for constant inspection and software update stations is spawning new value-added service revenue streams in port and rail hubs.
Consumer Demand for End-to-End Shipment Visibility Fostering Platform-Enabled 3PL Contracts
Automotive shippers increasingly require API-level data exchange. Union Pacific offers 65 live APIs and GPS on 90% of its intermodal fleet, feeding OEM control towers with container ETAs. DHL Supply Chain has introduced generative-AI tools that cleanse data, draft bids, and generate customized KPI dashboards, improving proposal accuracy and customer response time. Contracts now mandate system interoperability, limiting standalone 3PL platforms and encouraging open-architecture solutions that integrate supplier, carrier, and dealer data in a single UI.
Restraints Impact Analysis*
| Restraint | ( ~ ) % Impact on CAGR Forecast | Geographic Relevance | Impact Timeline |
|---|---|---|---|
| Macroeconomic uncertainty reduces discretionary vehicle shipments | -0.9% | North America, Europe | Short term (≤ 2 years) |
| Freight-rate volatility erodes budget predictability | -0.6% | Global (Asia-Europe acute) | Short term (≤ 2 years) |
| Carbon-emission caps elevate long-distance transport costs | -0.4% | Europe, North America | Medium term (2-4 years) |
| Global logistics talent shortage constrains peak capacity | -0.5% | Developed markets | Long term (≥ 4 years) |
| Source: Mordor Intelligence | |||
Macroeconomic Uncertainty Suppressing Discretionary Vehicle Purchases and Shipments
Global automotive output slowed to 0.8% growth in 2024 on tighter credit and weak consumer sentiment, reducing finished-vehicle port throughput by 9.4% in Europe. Ford is testing rail–short-sea alternatives from Mexico’s Guaymas port to cut costs while maintaining lead-times under demand volatility. Lower utilization presses margins at ro-ro terminals, yet operators must retain surge capacity for recovery, straining pricing discipline. Chinese EV exports add forecasting complexity, as new brands scale output regardless of Western macrocycles.
Freight-Rate Volatility Eroding Budget Predictability for Automotive Shippers
Red Sea disruptions have lengthened Asia-Europe transits and boosted insurance costs, forcing European OEMs to reroute 30% of finished-vehicle volumes via Cape Route sailings. Kuehne + Nagel’s 2024 results show revenue normalization as pandemic premiums unwind, but spot-rate swings of 40% within a quarter complicate annual contract negotiations. Automakers are diversifying carrier panels and adopting index-linked pricing, increasing administrative load while tempering savings.
*Our forecasts treat driver/restraint impacts as directional, not additive. The impact forecasts reflect baseline growth, mix effects, and variable interactions.
Segment Analysis
By Service: Transportation Dominance Amid Value-Added Growth
Transportation retained 58.34% share of the global automotive logistics market in 2025. Road haulage remains pivotal, yet rail and sea volumes are rising as shippers seek lower-carbon options. BMW’s hydrogen trucks on German lanes lower tank-to-wheel emissions and illustrate modal innovation. Value-added services are forecast to outpace with a 6.94% CAGR, buoyed by customization, software flashing, and pre-delivery inspection demands. Providers are converting brown-field warehouses into multi-client assembly hubs that embed robotics, enabling shorter program launches without legacy overhead.
Automation reshapes storage economics: AutoStore’s goods-to-person systems triple cubic utilization and cut pick errors below 0.1%, supporting two-hour aftermarket order windows. As OEMs migrate to modular EV platforms, sub-assembly kitting and battery-pack sequencing generate new margin pools for service specialists. The balance of contract revenue is therefore tilting from line-haul to high-touch add-ons, diversifying provider income and reinforcing sticky multiyear agreements.


By Type: OEM Stability Contrasts Aftermarket Acceleration
OEM logistics accounted for 72.55% of the global automotive logistics market size in 2025, driven by complex inbound component flows and finished-vehicle exports. Electrification increases capital expenditure on ADR-compliant battery depots, temperature-controlled trailers, and emergency response protocols. Tesla’s long-term charter with Hyundai Glovis to ship Model 3 from Shanghai to Rotterdam reflects new transcontinental EV corridors.
In the automotive logistics market, Aftermarket logistics is growing faster at 6.28% CAGR, underpinned by rising vehicle age and direct-to-consumer parts sales. DHL’s purchase of Inmar Supply Chain adds 14 return centers, positioning the company to capture escalating reverse-logistics volumes in North America. Latin American fleets averaging 18-20 years heighten regional demand for import parts, attracting 3PL investment in bonded free-trade hubs that bypass port congestion.
By Cargo Type: Components Lead While EV Batteries Surge
Auto components generated 47.10% revenue in 2025, reflecting continuous line-side replenishment across thousands of SKUs. The global automotive logistics market share for EV batteries and power-electronics is rising fastest, expanding at 11.25% CAGR as governments incentivize giga-factory output. Union Pacific promotes rail as the safest large-volume mode for cathode and recycled lithium flows, highlighting 75% lower CO₂ per ton-mile than truck.
Kuehne + Nagel’s KN BatteryChain tracks end-to-end state-of-charge and residual value, providing OEMs with verifiable ESG reporting. Finished-vehicle shipments face near-shoring headwinds, yet remain pivotal for premium brands that rely on centralized production. Specialized asset pools, including double-stack railcars for electric SUVs, are in short supply, prompting leasing rates to climb by double digits since 2024.
By Delivery Time: Standard Dominance Faces Express Pressure
In the automotive logistics market, standard delivery commanded 80.75% share in 2025, capitalizing on predictable production schedules and the move toward lower-carbon sea and rail. Express services are projected to rise at a 7.62% CAGR, supported by just-in-time assembly and critical aftermarket demand. XPO’s ExpressNow corridor between Antwerp and Istanbul trims transit by two days and cuts CO₂ by 80% versus exclusive trucking, illustrating blended service economics.
OEMs deploying build-to-order models rely on predictive analytics to reduce buffer stocks; when exceptions occur, premium air or dedicated van capacity is required. Nissan’s supply chain risk-sensing platform uses AI to reroute parts within hours, limiting expensive expedite calls. Providers are thus investing in 24/7 control towers and on-demand charter brokers to monetize critical freight opportunities.
Geography Analysis
Asia-Pacific held 47.35% share of the global automotive logistics market in 2025 and is forecast to grow at 6.55% CAGR to 2031. China’s dominance in EV output and battery material refining sustains high intra-regional lane density, while India’s production-linked incentives attract component manufacturing migrations. DHL added an EV Centre of Excellence in Australia in 2025, expanding its regional network for temperature-controlled battery flows. Japanese providers pioneer autonomous platooning on expressways, addressing driver shortages and lifting asset utilization. Major port operators are enlarging ro-ro berths, evidenced by Kaohsiung’s 370,000-TEU expansion that boosts vessel turnaround for finished vehicles.
North America remains a strategic hub in the automotive logistics market, but tariff hikes on imported vehicles and components are pressuring routing decisions. Analysts estimate potential reductions of 20,000 units per day if tariffs hold through 2026, compelling OEMs to deepen Mexico and Canada near-shoring. Georgia Ports will invest USD 262 million to upgrade Colonel’s Island, targeting top position in United States ro-ro throughput by 2026. Alternative Pacific gate entries such as Guaymas are under trial to limit west-coast congestion and balance drayage costs.
In the automotive logistics market, Europe grapples with geopolitical disruptions and stringent carbon regulation. Throughput at finished-vehicle terminals fell 9.4% in 2024, shifting the region to net-importer status as Asian EV exports surge. Yet the bloc leads in green logistics mandates: Audi deploys renewable-powered trains for battery modules, shaving 2,600 tonnes of annual CO₂. Peel Ports’ GBP 30 million ro-ro berth at Sheerness, operational in 2025, underscores continued investment despite softer volumes.
Note: Segments share of all individual segments available upon report purchase

Competitive Landscape
The global automotive logistics market is moderately fragmented but consolidating. DSV’s EUR 14.3 billion acquisition of DB Schenker closed in April 2025 and created a USD 45 billion revenue leader with 160,000 staff across 90 countries. CEVA Logistics earlier absorbed Bolloré Logistics and realigned GEFCO assets into a dedicated finished-vehicle unit, signalling a strategic focus on high-margin ro-ro flows.
Technology deployment differentiates incumbents. DHL Supply Chain’s generative-AI tools auto-clean client data and draft pricing, cutting bid cycle times by 25%. UPS installs autonomous yard tractors that operate 20 hours daily, raising parcel-to-auto cross-dock productivity. Chinese entrants integrate vertically; SAIC Logistics controls inland ports linked to Shanghai plants, challenging international 3PL penetration.
Strategic moves in the automotive logistics market target electric mobility. Maersk’s Flex Hub battery service bundles maritime, warehousing, and inland haulage for cell makers, providing temperature-controlled compliance and ESG dashboards. CEVA and BMW France pilot electric car carriers on 270 km daily loops, collecting telematics to certify CO₂ savings. Uber Freight partners with Aurora Innovation to commercialize driverless truck capacity on United States lanes, promising cost parity with human drivers by 2027.
Automotive Logistics Industry Leaders
Hellmann Worldwide Logistics SE & Co. KG
APL Logistics Ltd
BLG Logistics Group AG & Co. KG
CEVA Logistics
DHL Group
- *Disclaimer: Major Players sorted in no particular order

Recent Industry Developments
- June 2025: Toyota Motor Europe and VDL Groep deployed four 400 km-range hydrogen trucks across Belgium, France, Germany, and the Netherlands to decarbonize heavy-duty logistics.
- June 2025: Nippon Express Holdings, Japan Freight Railway, and T2 completed a 500 km autonomous truck-plus-rail pilot from Kanagawa to Kobe, addressing driver shortages.
- May 2025: DHL opened an EV Centre of Excellence in Australia to support regional battery supply chains.
- March 2025: XPO expanded ExpressNow across Europe, enhancing time-critical options for OEM and aftermarket customers.


Research Methodology Framework and Report Scope
Market Definitions and Key Coverage
Mordor Intelligence defines the automotive logistics market as the value of services devoted to moving, storing, and managing finished vehicles, production parts, EV batteries, and related aftermarket flows across road, rail, sea, and air networks, together with associated inventory-management and value-added activities that occur outside the factory gate.
Scope exclusion: our study omits courier parcels that are not traceable to an automotive bill of materials and any purely in-plant material-handling spend.
Segmentation Overview
- By Service
- Transportation
- Road
- Rail
- Sea / Ro-Ro / Short-Sea
- Air
- Warehousing, Distribution & Inventory Management
- Value-Added Services
- Transportation
- By Type
- OEM
- Aftermarket
- By Cargo Type
- Finished Vehicles
- Auto Components
- EV Batteries & Power-Electronics
- Other Cargo
- By Delivery Time
- Standard
- Express / Critical
- By Geography
- North America
- United States
- Canada
- Mexico
- South America
- Brazil
- Peru
- Chile
- Argentina
- Rest of South America
- Asia-Pacific
- India
- China
- Japan
- Australia
- South Korea
- South East Asia (Singapore, Malaysia, Thailand, Indonesia, Vietnam, and Philippines)
- Rest of Asia-Pacific
- Europe
- United Kingdom
- Germany
- France
- Spain
- Italy
- BENELUX (Belgium, Netherlands, and Luxembourg)
- NORDICS (Denmark, Finland, Iceland, Norway, and Sweden)
- Rest of Europe
- Middle East And Africa
- United Arab Emirates
- Saudi Arabia
- South Africa
- Nigeria
- Rest of Middle East And Africa
- North America
Detailed Research Methodology and Data Validation
Primary Research
Structured interviews with supply-chain directors at automakers, 3PL planners, port operators, and aftermarket distributors across Asia-Pacific, Europe, and the Americas verify lane volumes, typical contract rates, and emerging service needs (for example, critical battery return loops). Short surveys sent to regional road haulers and ro-ro carriers further stress test cost curves and utilization assumptions.
Desk Research
Our analysts first aggregate public domain datasets such as OICA production tallies, UN COMTRADE trade codes for HS 87 and lithium-ion batteries, World Bank Logistics Performance scores, and vehicle registration statistics from bodies like the US DOT and ACEA. Company filings and investor decks from leading OEMs and tier-ones help us benchmark plant footprints and sourcing splits, while reputable trade associations and peer-reviewed journals clarify modal-shift economics and battery-handling rules. Paid databases, D&B Hoovers for revenue splits, Marklines for model launch calendars, Volza for shipment-level flows, and Dow Jones Factiva for deal tracking, supply additional quantitative threads.
These inputs are illustrative rather than exhaustive; many other credible sources are tapped to cross-check facts, plug data gaps, and verify early findings.
Market-Sizing & Forecasting
A top-down model reconstructs global spending by aligning production, import-export, and parc data with average logistics cost per vehicle or component. Results are then tested against selective bottom-up checks such as sampled ro-ro throughput, tier-one shipping invoices, and warehouse lease benchmarks before fine-tuning totals. Key variables include vehicle build mix, cross-border shipment ratios, battery pack penetration, road-rail-sea modal shares, and spot freight indices, each projected by multivariate regression anchored to GDP, EV adoption curves, and bunker fuel trends. Where supplier roll-ups diverge materially from macro signals, gap factors are applied transparently.
Data Validation & Update Cycle
Initial outputs pass a three-layer review: model integrity check, variance scan against third-party signals, and senior analyst sign-off. We refresh every twelve months, with interim adjustments triggered by material events such as freight-rate shocks, major OEM capacity moves, or policy shifts. A final pre-publication sweep ensures clients always receive the latest figures.
Why Mordor's Automotive Logistics Baseline Is Dependable
Published estimates frequently differ because firms adopt unique scopes, currencies, and refresh cadences. Only after dissecting those levers can one understand the spread that readers observe.
Key gap drivers arise when others bundle infrastructure CAPEX, drop warehousing, or freeze exchange rates, whereas Mordor applies a service-only lens, retains full modal breadth, and rolls quarterly FX averages into every update, which together produce a balanced, decision-ready value.
Benchmark comparison
| Market Size | Anonymized source | Primary gap driver |
|---|---|---|
| USD 282.90 B (2025) | Mordor Intelligence | - |
| USD 472.90 B (2025) | Regional Consultancy A | Includes infrastructure build-out and packaging spend; uses cost-plus escalation without current FX rebasing |
| USD 294.73 B (2024) | Trade Journal B | Focuses mainly on road transport and handling, leaving warehousing and value-added services partially outside scope |
| USD 230.80 B (2024) | Global Consultancy C | Excludes EV battery logistics and several emerging markets, creating a narrower geographic footprint |
In sum, by selecting a clear service boundary, applying mixed economic and operational drivers, and validating through constant field feedback, Mordor Intelligence delivers a consistent, reproducible baseline that financial planners and strategy teams can rely on with confidence.


Key Questions Answered in the Report
What is the current size of the global automotive logistics market?
The global automotive logistics market stands at USD 298.07 billion in 2026 and is projected to reach USD 386.91 billion by 2031.
How fast is the automotive logistics market expected to grow?
The market is forecast to expand at a 5.36% compound annual growth rate between 2026 and 2031.
Which region leads the automotive logistics market and why?
Asia-Pacific holds 47.35% of global revenue because of its concentration of vehicle manufacturing, battery production, and rapid electric-vehicle adoption.
What service segment generates the most revenue in automotive logistics?
Transportation services account for 58.34% of market revenue in 2025, supported by road, rail, sea, and air movements across finished vehicles and components.
Where is the fastest growth occurring within cargo types?
EV batteries and power-electronics represent the fastest-growing cargo category, advancing at an 11.25% CAGR through 2031.
How are sustainability targets influencing logistics strategies?
Corporate carbon goals are driving modal shifts toward rail and sea, prompting providers to invest in low-emission assets such as hydrogen trucks and greener maritime solutions.
Page last updated on:


