Retail Display And POP/PDQ Pack-Out Services Market Size and Share
Market Overview
| Study Period | 2020 - 2031 |
|---|---|
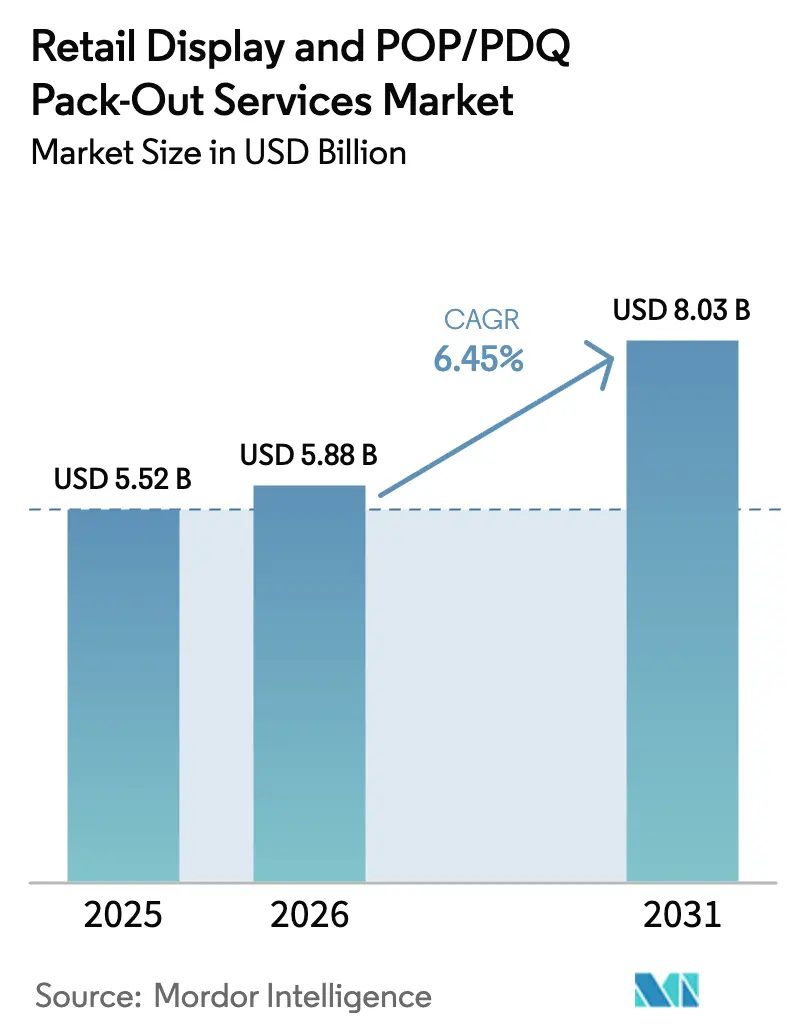
| Market Size (2026) | USD 5.88 Billion |
| Market Size (2031) | USD 8.03 Billion |
| Growth Rate (2026 - 2031) | 6.45% CAGR |
| Fastest Growing Market | Asia Pacific |
| Largest Market | North America |
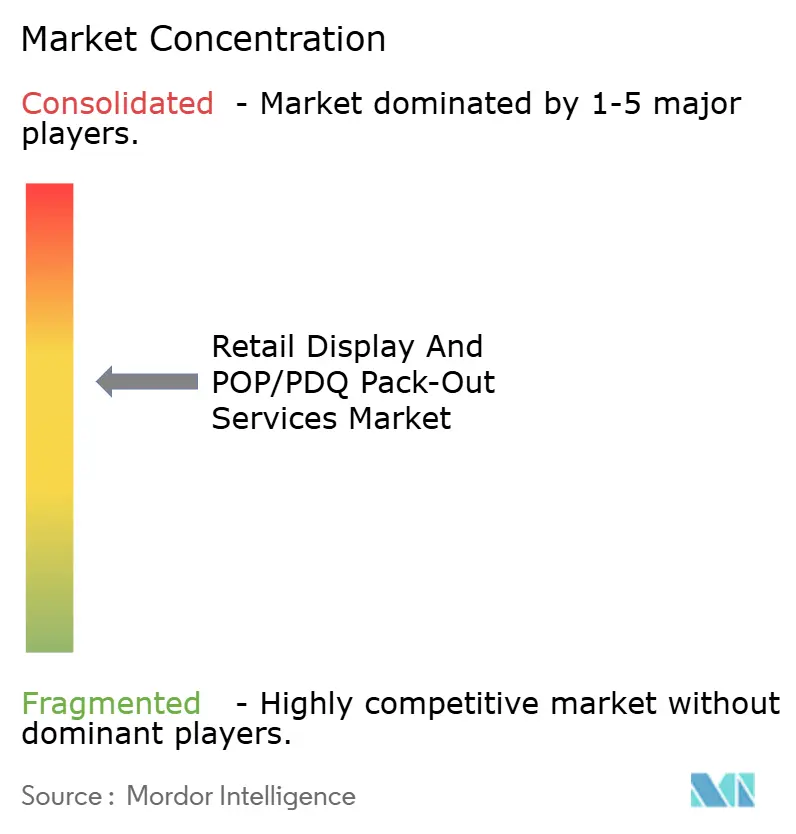
| Market Concentration | Medium |
Major Players *Disclaimer: Major Players sorted in no particular order Image © Mordor Intelligence. Reuse requires attribution under CC BY 4.0. | |
Retail Display And POP/PDQ Pack-Out Services Market Analysis by Mordor Intelligence
The retail display and POP/PDQ pack-out services market size in 2026 is estimated at USD 5.88 billion, growing from 2025 value of USD 5.52 billion with 2031 projections showing USD 8.03 billion, growing at 6.45% CAGR over 2026-2031. Steady growth stems from retailers outsourcing labor-intensive kitting, assembly, and in-store execution to specialized partners that guarantee predictable costs, faster roll-outs, and higher compliance rates. Demand also benefits from rapid omnichannel launches, SKU proliferation, and a renewed focus on experiential merchandising, all of which require agile, scalable display support. Sustainability regulations spur material shifts toward recyclable substrates, while automation and IoT integration push service providers to upgrade facilities and analytics capabilities. Competitive intensity remains moderate as a handful of global packaging majors consolidate capacity, yet regional specialists still capture niche opportunities through high-touch execution and category expertise.
Key Report Takeaways
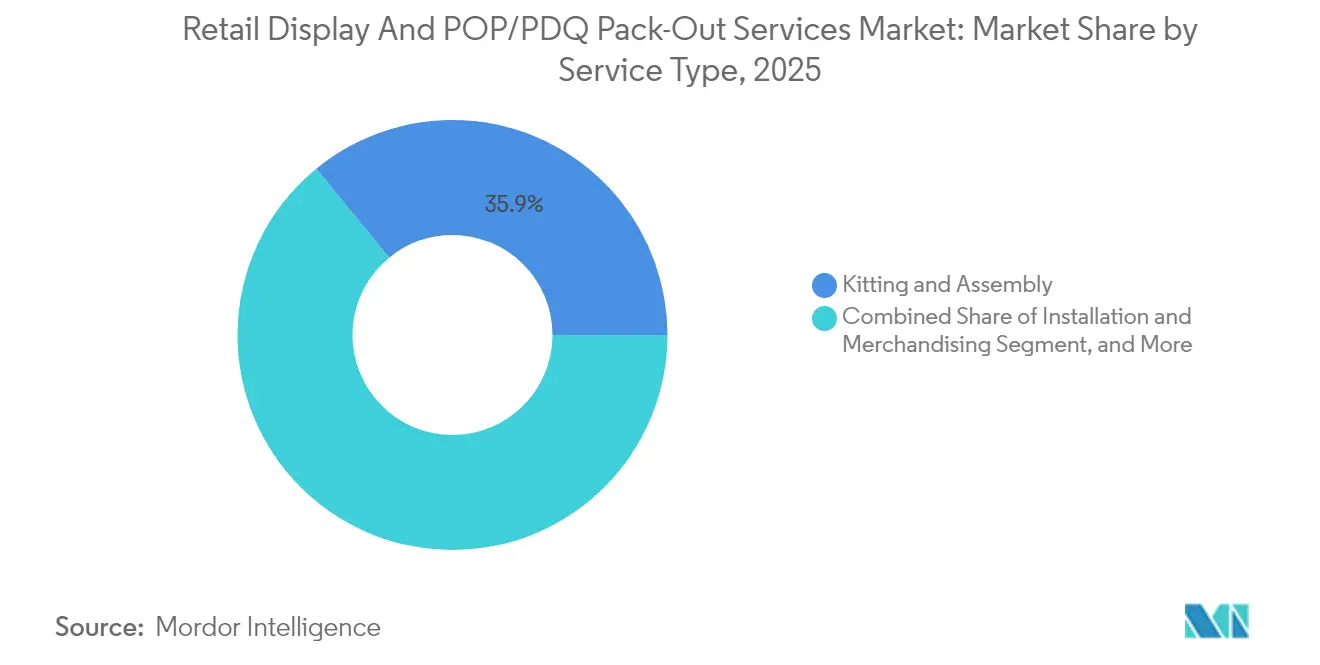
- By service type, kitting and assembly captured 35.92% of the retail display and POP/PDQ pack-out services market share in 2025.
- By material, the retail display and POP/PDQ pack-out services market size for the recycled plastic displays segment is forecast to advance at an 8.55% CAGR through 2031.
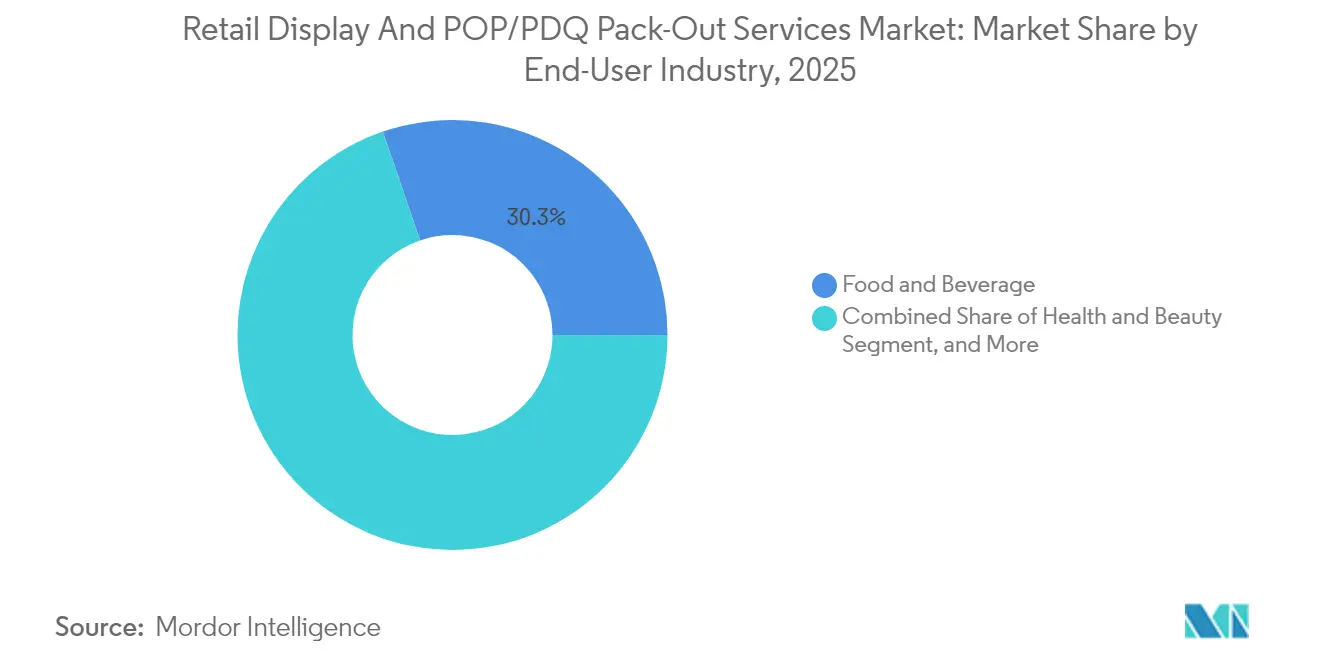
- By end-user, food and beverage captured 30.25% of the retail display and POP/PDQ pack-out services market share in 2025.
- By packaging format, the retail display and POP/PDQ pack-out services market size for the interactive and smart POP segment is forecast to advance at a 6.95% CAGR through 2031.
- By geography, North America captured 40.05% of the retail display and POP/PDQ pack-out services market share in 2025.
Note: Market size and forecast figures in this report are generated using Mordor Intelligence’s proprietary estimation framework, updated with the latest available data and insights as of 2026.
Global Retail Display And POP/PDQ Pack-Out Services Market Trends and Insights
Drivers Impact Analysis*
| Driver | (~) % Impact on CAGR Forecast | Geographic Relevance | Impact Timeline |
|---|---|---|---|
| Retailers Outsourcing Display Kitting to Reduce Labour Costs | +1.8% | Global, strongest in North America and Europe | Medium term (2-4 years) |
| Surge in Omnichannel Product Launches Requiring Rapid Store Roll-Outs | +1.5% | Global, concentrated in developed markets | Short term (≤ 2 years) |
| Automation in Pack-Out Lines Improving ROI for Brand Owners | +1.2% | North America and Asia-Pacific core, expanding to Europe | Long term (≥ 4 years) |
| Sustainability Mandates Favouring Corrugated and Returnable POP Displays | +1.0% | Europe leading, spreading to North America and APAC | Medium term (2-4 years) |
| SKU Proliferation in FMCG Driving Demand for Agile PDQ Programmes | +0.8% | Global, particularly strong in emerging markets | Short term (≤ 2 years) |
| Post-Pandemic Resurgence of Experiential In-Store Marketing Spend | +0.7% | Developed markets primarily, gradual emerging market adoption | Medium term (2-4 years) |
| Source: Mordor Intelligence | |||
Retailers Outsourcing Display Kitting to Reduce Labor Costs
Escalating store wages and turnover convince major retailers to shift kitting and assembly to third-party specialists that run dedicated facilities at scale. Labor accounts for close to 70% of in-store execution budgets, so outsourcing converts variable costs into fixed contracts and frees internal staff for customer-facing tasks.[1]National Retail Federation, “Retail Workforce Challenges 2024,” nrf.com Providers typically guarantee service-level agreements that cut direct display labor expenses by one-quarter, shorten deployment cycles, and deliver consistent brand compliance across thousands of locations. The model is especially attractive for seasonal promotions where short lead times and high volumes overwhelm store teams.
Surge in Omnichannel Product Launches Requiring Rapid Store Roll-Outs
Brands now time physical, online, and social launches within two- to three-week windows, compressing traditional six-week display cycles. Fast roll-outs demand hub-and-spoke logistics, pre-kitted PDQ units, and same-day installation in metro clusters. Specialist pack-out partners preload inventory at regional nodes and then dispatch synchronized crews to ensure identical messaging across formats. Consistency safeguards campaign ROI, limits shrinkage, and feeds real-time sell-through dashboards that support dynamic allocation.
Automation in Pack-Out Lines Improving ROI for Brand Owners
Robotic case erectors, vision-guided labelers, and cobot gluing stations increase line speeds while reducing headcount by half. Best-practice plants recover capital within 12 months as labor savings stack with lower rework and 24/7 uptime. Tightly integrated WMS modules track every SKU to pallet, enabling traceable replenishment while mitigating retailer chargebacks for incomplete kits. The gains encourage multinationals to negotiate multi-year supply agreements with providers that invest in full lights-out lines.[2]International Paper Company, “IP Announces Sustainability Targets,” internationalpaper.com
Sustainability Mandates Favoring Corrugated and Returnable POP Displays
The European Union aims to achieve 90% recycling of corrugated packaging by 2030, prompting brands to switch from rigid plastics to fiber-based or reusable alternatives that reduce landfill waste. Corrugated offers 95% recyclability and lighter shipping weight, yielding total cost of ownership benefits in high-velocity categories.[3]FEFCO, “Corrugated Sustainability Report 2024,” fefco.org Grocery chains extending closed-loop, returnable programs report 60% savings over three-year cycles once reverse logistics stabilize. Service providers win bids when they demonstrate life-cycle metrics, FSC sourcing, and ISO 14001 credentials.
Restraints Impact Analysis*
| Restraint | (~) % Impact on CAGR Forecast | Geographic Relevance | Impact Timeline |
|---|---|---|---|
| Store Labour Shortages Limiting In-Store Execution Quality | -1.5% | Global, most severe in developed markets | Short term (≤ 2 years) |
| Volatility in Recycled Paperboard Prices Pressuring Margins | -1.2% | Global, particularly impacting cost-sensitive segments | Medium term (2-4 years) |
| Rising E-Commerce Share Reducing Reliance on Physical POP Displays | -0.8% | Developed markets primarily, gradual emerging market impact | Long term (≥ 4 years) |
| Brand Compliance Risks due to Fragmented Global Supply Chain | -0.6% | Global, concentrated in multinational brand operations | Medium term (2-4 years) |
| Source: Mordor Intelligence | |||
Store Labor Shortages Limiting In-Store Execution Quality
More than three-quarters of U.S. stores lacked sufficient floor staff in 2024, resulting in displays that were either uninstalled or poorly maintained. High turnover erodes installation expertise and increases error rates, particularly for electronics and health and beauty fixtures that require precise alignment and secure hardware. Suppliers simplify instruction kits, offer augmented reality training, and dispatch roving quality crews, yet results remain uneven during peak seasons. Brands risk missed sales when launches are delayed or visual standards slip.
Volatility in Recycled Paperboard Prices Pressuring Margins
Recycled board costs fluctuated by 15-20% in 2024 due to shifting waste streams and freight constraints, squeezing providers whose material inputs account for 40% of project budgets. Quoting multi-month programs becomes hazardous, prompting the use of contingency clauses or index-linked pricing that can strain retailer relations. Larger converters hedge with forward contracts and mix recycled and virgin fiber, but smaller firms often absorb spikes, reducing cash for capex. Continuous design-for-material-efficiency and real-time cost dashboards help stabilize margins.
*Our forecasts treat driver/restraint impacts as directional, not additive. The impact forecasts reflect baseline growth, mix effects, and variable interactions.
Segment Analysis
By Service Type: Experience-Focused Services Outpace Basic Kitting
Kitting and assembly accounted for 35.92% of the retail display and POP/PDQ pack-out services market in 2025, underscoring their role as the backbone for national rollouts. The segment’s scale enables volume discounts on substrates and freight. Yet installation and merchandising will post the fastest 8.11% CAGR to 2031 as retailers pivot toward immersive in-store storytelling that requires on-site expertise. Service providers expand their offerings to include planogram compliance audits, sensor-based performance tracking, and refresh programs to secure more durable contracts. The shift dilutes price pressure on basic kitting and promotes bundled service deals, which elevate the average order value. Specialists with certified field teams secure contracts in luxury and technology verticals, where flawless execution drives conversions.
Expanding design and prototyping pipelines fuel brand experiments with new shapes, lighting, and digital modules. Automated quoting portals and 3D virtual proofs shrink turnaround from weeks to days, boosting win rates on limited-edition programs. Pick-and-pack integration with e-commerce fulfillment enables retailers to adopt ship-from-store models. Warehousing services gain relevance as omnichannel players centralize inventory for both online and store campaigns, improving turns and freeing back-room space.


By Display Material: Recycled Content Gains Share Without Dislodging Corrugated
Corrugated cardboard retained a 46.98% share in 2025, driven by its low cost and extensiv converter networks. The retail display and POP/PDQ pack-out services market size for corrugated formats will still increase, but the 8.55% CAGR for recycled plastic points to rising demand for durable, moisture-resistant fixtures that can withstand multi-week promotions. Brands in the chilled food, beverage, and personal care sectors are testing polypropylene blends that combine 30% recycled resin with digital print surfaces that rival litho-lam rates. Major chains are trialing reusable plastic frames with interchangeable graphic sleeves, reducing landfill waste and freight costs.
Rigid plastic and wood remain the preferred materials for prestige cosmetics, electronics, and liquor, where high-gloss finishes and weight-bearing strength are crucial. Metal and wire racks support heavy DIY and automotive products. Hybrid builds mixing corrugated cores with plastic edging balance sustainability and aesthetics in value channels. Suppliers differentiate by offering life-cycle assessments and closed-loop take-back programs that certify carbon savings, aligning with retailer ESG scorecards.
By End-User Industry: Health and Beauty Surges on Premium Storytelling
Food and beverage commanded a 30.25% share in 2025, thanks to ongoing product rotations, multi-pack deals, and high store penetration. Growth, however, moderates as price-sensitive categories prioritize simple PDQ trays. In contrast, health and beauty will compound at 8.02% through 2031 as prestige and masstige brands deploy sensorial displays with lighting, testers, and data-capture modules. The retail display and POP/PDQ pack-out services market size tied to health and beauty merchandising is set to expand as influencer collaborations and limited runs require frequent refreshes.
Electronics stay volatile, syncing with new device cycles and Black Friday peaks. Home and garden benefit from DIY trends that spike seasonal fixture demand for tools, seeds, and decor. Apparel brands test collapsible cardboard wardrobes that streamline floor resets, while pet care lines experiment with low-height dump bins to improve impulse lifts. Providers specializing in fragrance, skincare, or craft beverages enjoy repeat business due to category-specific compliance rules and handling protocols.
By Packaging Format: Interactive and Smart POP Displays Gain Momentum
PDQ trays led with a 33.10% market share in 2025, owing to their low cost and ready-stack format. Floor-standing and pallet units remain go-to for high-impact promotions in hypermarkets and warehouse clubs. Countertop displays excel where the footprint is limited yet impulse conversion rates are high, such as in convenience stores.
Interactive and smart POP formats, although nascent, are expected to chart a 6.95% CAGR. Touchscreens, NFC tags, and computer vision modules capture dwell time, demographics, and pick-up events, feeding analytics loops that optimize SKU mix and replenishment. Early adopters report 25% shorter display deployment cycles and better sell-through forecasting. The retail display and POP/PDQ pack-out services industry is responding with cloud dashboards, remote firmware updates, and managed data services layered on standard pack-out contracts.
Geography Analysis
North America held 40.05% of the global revenue in 2025, driven by mature retail chains that require nationwide rollouts with strict planogram compliance. Providers here invest heavily in robotics, RFID tagging, and paperless proof-of-performance apps. Sustainability adoption is market-driven rather than regulatory, with voluntary commitments guiding the shift toward 100% fiber-based or returnable substrates. Growth slows compared with emerging regions, so suppliers focus on premium services, analytics add-ons, and turnkey omnichannel support to sustain margins.
The Asia-Pacific region is expected to record the fastest growth, with an 8.51% CAGR through 2031, as China, India, and Southeast Asia upgrade their retail formats. Rising middle-income cohorts, mall expansions, and growing multinational presence raise in-store execution standards. Local converters leverage proximity to corrugated mills and labor cost advantages to bid aggressively, while global groups partner for brand consistency. Urban congestion enhances the value of regional micro-fulfillment hubs, which shorten delivery windows and accommodate omnichannel surges. Sustainability traction lags Europe but accelerates as municipal waste regulations tighten.
Europe’s trajectory is steadier, underpinned by strict packaging and waste legislation that compels retailers to favor recyclable or returnable solutions. Providers differentiate via eco-design, lightweighting, and closed-loop logistics. Certifications such as FSC and ISO 14001 become tender prerequisites. South America, the Middle East, and Africa contribute smaller shares, yet deliver pockets of double-digit growth in modern retail corridors, where brand owners seek external expertise to bypass fragmented local supply chains. Currency swings and import duties can complicate pricing, encouraging near-shoring of display production in Brazil, Mexico, and the Gulf states.


Competitive Landscape
The retail display and POP/PDQ pack-out services market features moderate fragmentation. The top five players capture roughly 45-50% of global revenue through integrated packaging footprints, automated pack-out lines, and multinational client rosters. Recent consolidation, most visibly the USD 20.8 billion Smurfit WestRock merger, underscores the race for scale synergies and global reach. Such combinations offer broader substrate access, shared R&D, and centralized procurement, which lower input costs.
Sonoco Products, Georgia-Pacific, Menasha, and Pratt Industries intensify their automation spending, rolling out cobots, AI-driven vision inspection, and digital twins that enhance efficiency and secure long-term contracts for high-volume launches. Mid-tier specialists carve out niches in premium cosmetics, electronics, and sustainable displays by combining design studios with flexible, short-run production lines. Local champions in Germany, Japan, and Australia counter by touting agile lead times, custom engineering, and deep relationships with retailers.
Technology disruption blurs traditional boundaries. Data analytics vendors partner with converters to offer IoT-enabled fixtures that stream inventory signals. Software platforms that track field installations in real-time become the standard, allowing brand owners to verify compliance and correlate sales uplift. Environmental credentials are emerging as bid differentiators; suppliers highlight closed-loop fiber sourcing, renewable energy plants, and guarantees of recycled content to satisfy retailer ESG audits.
Retail Display And POP/PDQ Pack-Out Services Industry Leaders
Menasha Packaging Company, LLC
Smurfit Westrock plc
Sonoco Products Company
Pratt Industries, Inc.
Georgia-Pacific LLC
- *Disclaimer: Major Players sorted in no particular order

Recent Industry Developments
- October 2024: Smurfit WestRock completed its USD 20.8 billion merger, creating the largest integrated packaging and display provider worldwide.
- September 2024: Sonoco Products announced a USD 150 million automation investment across three North American display facilities.
- August 2024: Pratt Industries opened a USD 120 million Ohio corrugated plant that runs on 100% recycled fiber and carbon-neutral power.
- July 2024: Georgia-Pacific teamed with Microsoft to deploy AI demand forecasting tools that target a 25% gain in pack-out efficiency.


Global Retail Display And POP/PDQ Pack-Out Services Market Report Scope
| Design and Prototyping |
| Pick and Pack Services |
| Kitting and Assembly |
| Warehousing and Fulfilment |
| Installation and Merchandising |
| Corrugated Cardboard |
| Rigid Plastic |
| Recycled Plastic |
| Wood and MDF |
| Metal and Wire |
| Food and Beverage |
| Health and Beauty |
| Electronics |
| Home and Garden |
| Fashion and Apparel |
| Other End-User Industries |
| PDQ Trays |
| Floor-Standing Displays |
| Countertop Displays |
| Pallet Displays |
| Interactive and Smart POP |
| North America | United States | |
| Canada | ||
| Mexico | ||
| South America | Brazil | |
| Argentina | ||
| Rest of South America | ||
| Europe | Germany | |
| United Kingdom | ||
| France | ||
| Italy | ||
| Spain | ||
| Russia | ||
| Rest of Europe | ||
| Asia-Pacific | China | |
| Japan | ||
| India | ||
| South Korea | ||
| South-East Asia | ||
| Rest of Asia-Pacific | ||
| Middle East and Africa | Middle East | Saudi Arabia |
| United Arab Emirates | ||
| Turkey | ||
| Rest of Middle East | ||
| Africa | South Africa | |
| Nigeria | ||
| Rest of Africa | ||
| By Service Type | Design and Prototyping | ||
| Pick and Pack Services | |||
| Kitting and Assembly | |||
| Warehousing and Fulfilment | |||
| Installation and Merchandising | |||
| By Display Material | Corrugated Cardboard | ||
| Rigid Plastic | |||
| Recycled Plastic | |||
| Wood and MDF | |||
| Metal and Wire | |||
| By End-User Industry | Food and Beverage | ||
| Health and Beauty | |||
| Electronics | |||
| Home and Garden | |||
| Fashion and Apparel | |||
| Other End-User Industries | |||
| By Packaging Format | PDQ Trays | ||
| Floor-Standing Displays | |||
| Countertop Displays | |||
| Pallet Displays | |||
| Interactive and Smart POP | |||
| By Geography | North America | United States | |
| Canada | |||
| Mexico | |||
| South America | Brazil | ||
| Argentina | |||
| Rest of South America | |||
| Europe | Germany | ||
| United Kingdom | |||
| France | |||
| Italy | |||
| Spain | |||
| Russia | |||
| Rest of Europe | |||
| Asia-Pacific | China | ||
| Japan | |||
| India | |||
| South Korea | |||
| South-East Asia | |||
| Rest of Asia-Pacific | |||
| Middle East and Africa | Middle East | Saudi Arabia | |
| United Arab Emirates | |||
| Turkey | |||
| Rest of Middle East | |||
| Africa | South Africa | ||
| Nigeria | |||
| Rest of Africa | |||


Key Questions Answered in the Report
How large is the retail display and POP/PDQ pack-out services market in 2026?
The market stands at USD 5.88 billion in 2026 and is forecast to grow at a 6.45% CAGR to USD 8.03 billion by 2031.
Which region grows fastest through 2031?
Asia-Pacific records the highest 8.51% CAGR thanks to retail modernization in China, India, and Southeast Asia.
What service type is expanding quickest?
Installation and merchandising services show the strongest 8.11% CAGR as brands prioritize in-store experience quality.
Which material segment is gaining traction beyond corrugated?
Recycled plastic displays exhibit an 8.55% CAGR due to durability and retailer sustainability targets.
How are automation investments affecting providers?
Robotic pack-out lines reduce labor by up to 50% and often repay capital in under 12 months, lifting competitiveness.
What sustainability standards shape the European market?
The EU Packaging and Packaging Waste Regulation sets ambitious recycling targets, guiding material choices toward corrugated and returnable systems.
Page last updated on:


