
Consumer Electronics Packaging Market Size and Share
Market Overview
| Study Period | 2020 - 2031 |
|---|---|
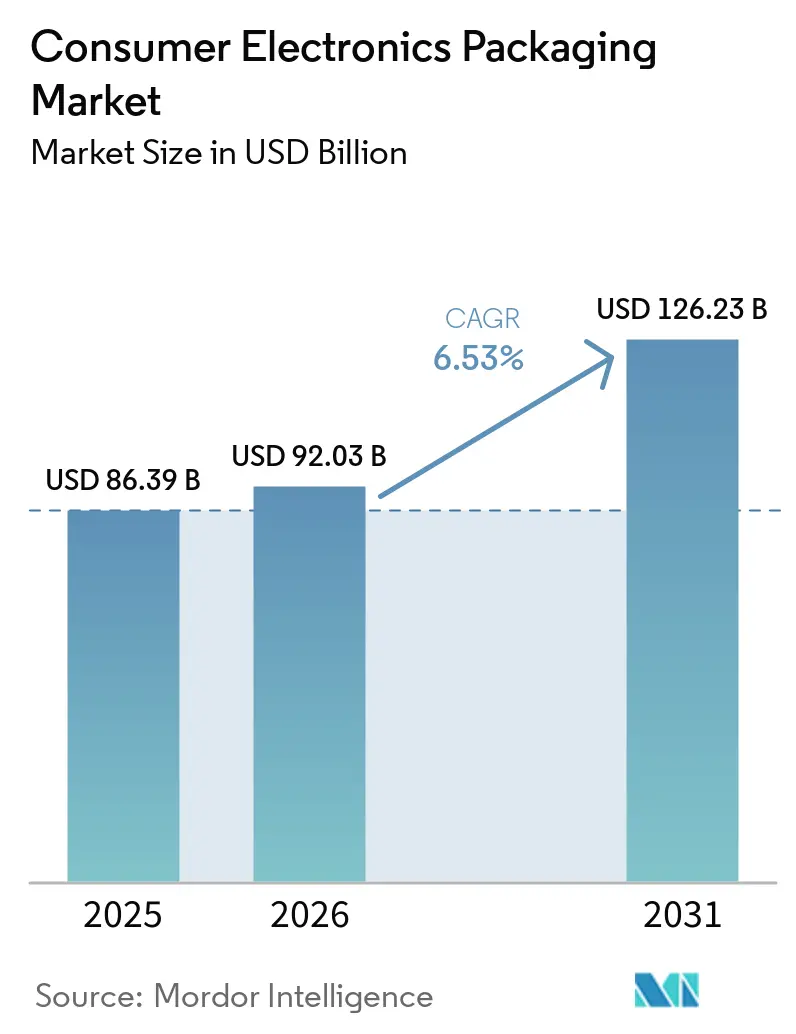
| Market Size (2026) | USD 92.03 Billion |
| Market Size (2031) | USD 126.23 Billion |
| Growth Rate (2026 - 2031) | 6.53 % |
| Fastest Growing Market | Asia Pacific |
| Largest Market | Asia Pacific |
| Market Concentration | Low |
Major Players *Disclaimer: Major Players sorted in no particular order Image © Mordor Intelligence. Reuse requires attribution under CC BY 4.0. | |
Consumer Electronics Packaging Market Analysis by Mordor Intelligence
The consumer electronic packaging market size in 2026 is estimated at USD 92.03 billion, growing from 2025 value of USD 86.39 billion with 2031 projections showing USD 126.23 billion, growing at 6.53% CAGR over 2026-2031. Robust demand for protective, transit-ready designs, combined with material shifts toward recyclable paper solutions, underpins this growth trajectory. E-commerce volume increases, smartphone replacement cycles, and the rollout of connected home devices reinforce volume expansion across every major region. Consolidation among large integrated converters brings scale benefits and accelerates technology transfer, while smaller specialists capture white-space opportunities in ultra-compact packs and bio-based substrates. The consumer electronic packaging market benefits from the sector’s heightened sensitivity to product damage, counterfeiting, and sustainability scrutiny, placing packaging performance at the core of brand value and regulatory compliance.
Key Report Takeaways
- By consumer electronics category, smartphones led with 40.02% revenue share of the consumer electronic packaging market in 2025, while smart home and IoT devices are projected to expand at a 10.12% CAGR through 2031.
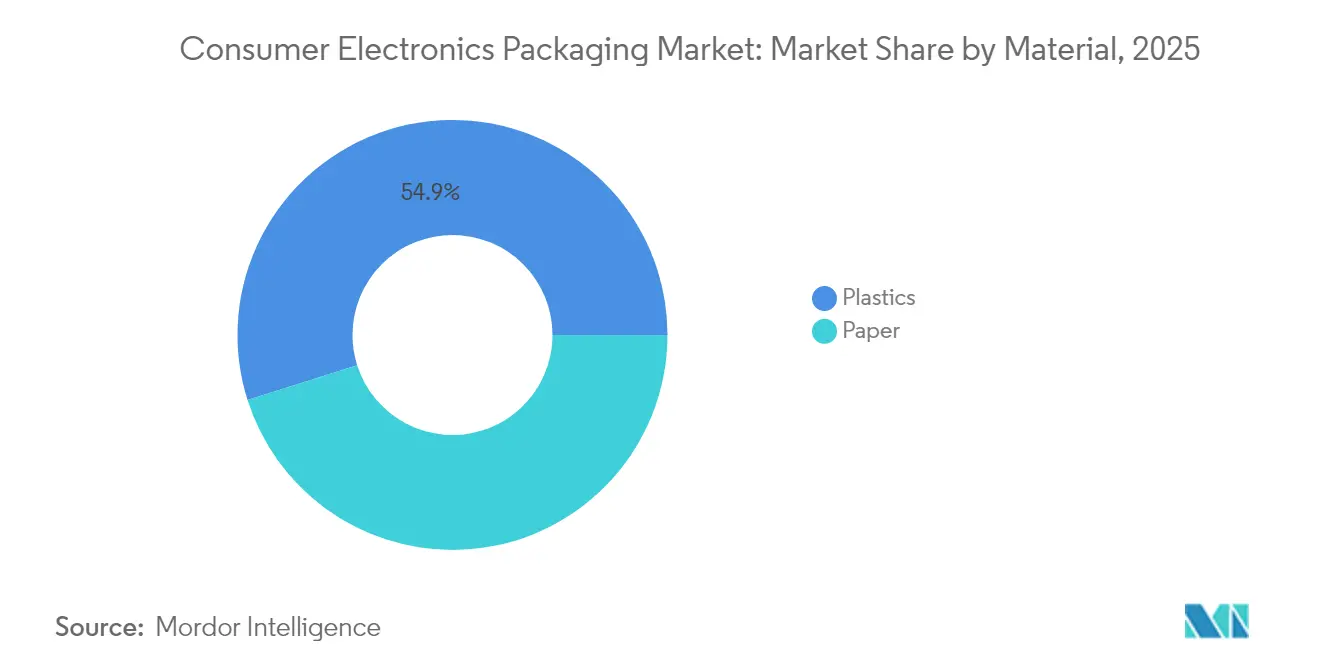
- By material, plastics held 54.88% of the consumer electronic packaging market share in 2025, whereas paper-based solutions are forecast to grow at 7.36% CAGR to 2031.
- By packaging format, corrugated boxes and pallets commanded 30.31% share of the consumer electronic packaging market size in 2025, while protective mailers and bubble wrap solutions are advancing at a 9.27% CAGR through 2031.
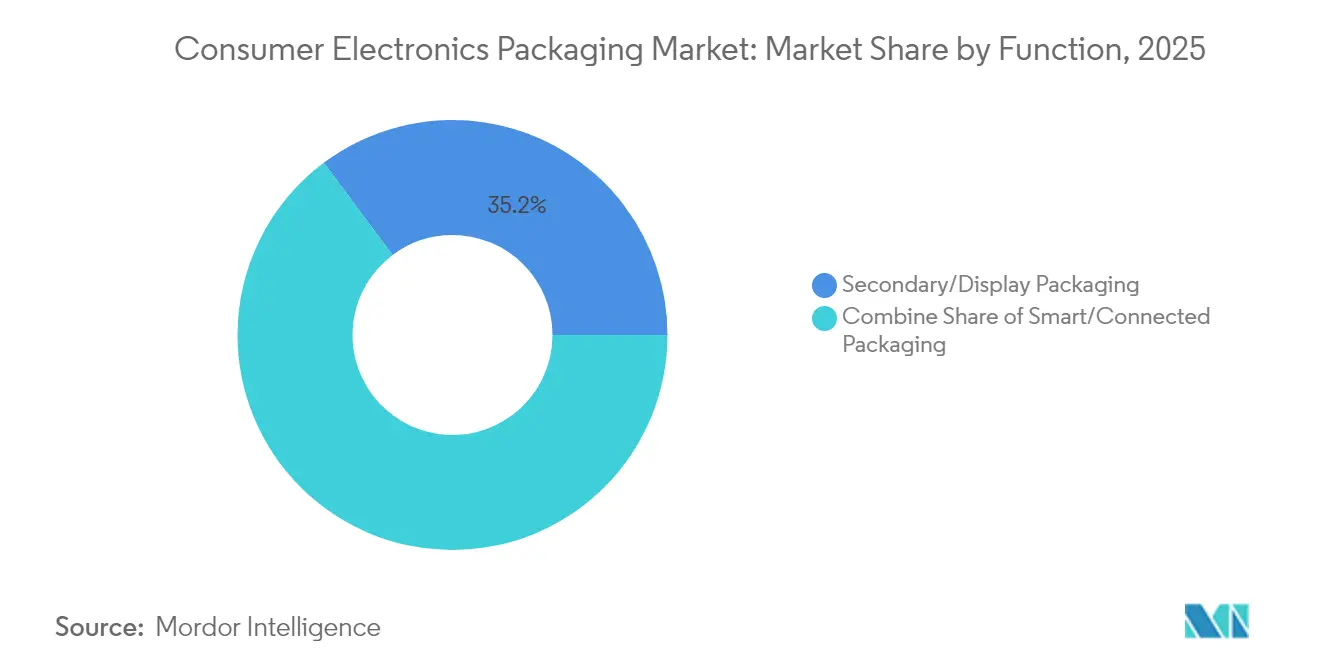
- By function, secondary and display packaging accounted for 35.22% of the consumer electronic packaging market size in 2025 and smart, connected packaging is growing at an 8.19% CAGR to 2031.
- By geography, Asia-Pacific captured 39.74% of the consumer electronic packaging market in 2025, and the region is on track to post a 9.75% CAGR to 2031
Note: Market size and forecast figures in this report are generated using Mordor Intelligence’s proprietary estimation framework, updated with the latest available data and insights as of 2026.
Market Trends and Insights
Drivers Impact Analysis of Consumer Electronics Packaging Market*
| Driver | (~) % Impact on CAGR Forecast | Geographic Relevance | Impact Timeline |
|---|---|---|---|
| E-commerce boom driving protective and transit-ready formats | +1.8% | Global, with concentration in North America & APAC | Short term (≤ 2 years) |
| Eco-friendly substrates mandated by EPR and plastics bans | +1.2% | Europe & North America core, expanding to APAC | Medium term (2-4 years) |
| Anti-counterfeit and tamper-evident features for brand protection | +0.9% | Global, particularly Asia-Pacific and emerging markets | Medium term (2-4 years) |
| Rising smartphone and wearable shipments in emerging Asia | +0.7% | APAC core, with spill-over to MEA and Latin America | Short term (≤ 2 years) |
| RFID-enabled reverse-logistics packaging for circular economy | +0.6% | Europe & North America, pilot programs in APAC | Long term (≥ 4 years) |
| Miniaturized modular packs lowering freight cube and costs | +0.5% | Global, with early adoption in developed markets | Medium term (2-4 years) |
| Source: Mordor Intelligence | |||
E-commerce boom driving protective and transit-ready formats
Holiday-season online sales of consumer electronics reached USD 55.3 billion in 2024, an 8.8% year-over-year increase. The shift from shelf-ready displays to transit-optimised packs raises the demand for engineered cushioning, tamper evidence, and right-size automation. Ranpak’s Cut’it EVO Multi-Lid system reduces void space and freight costs while boosting sustainability metrics. Brand owners view packaging as an extension of the product experience, integrating quick-response codes for post-purchase engagement. As parcel networks grow denser and more fragmented, the consumer electronic packaging market expands with specifications tailored to multi-touch handling and variable climates.
Eco-friendly substrates mandated by EPR and plastics bans
The EU Packaging and Packaging Waste Regulation enforces a 65% recycling rate for all consumer packaging by 2025. Brands shift rapidly to recyclable fibre and bio-plastic blends to secure market access. Logitech eliminated 660 tons of plastic annually by converting mice packaging to paper-based formats, cutting carbon emissions by 6,000 tons. Paptic and Woodly commercialise barrier-coated papers delivering moisture protection once reserved for polymers. The consumer electronic packaging market gains incremental volume as converters retrofit lines for fibre substrates, though lead times for regulatory certification remain a bottleneck.
Anti-counterfeit and tamper-evident features for brand protection
Counterfeit electronics generate USD 169 billion in annual losses, pressuring brands to embed multi-layer authentication directly into packs. [1]World Customs Organization, “Illicit Trade Report,” wcoomd.org Digital watermarks such as Digimarc’s imperceptible codes allow smartphone verification without compromising artwork. NFC tags linked to blockchain registries add second-factor validation and enable grey-market detection. By integrating security during structural design, converters cut secondary processes and boost line speeds. Heightened enforcement by customs authorities sustains steady demand, reinforcing the consumer electronic packaging market.
Rising smartphone and wearable shipments in emerging Asia
China shipped 171 million smartphones in Q1 2025, and India’s electronics market targets USD 180 billion in 2025. Volume growth requires localised packaging supply to support just-in-time assembly. Wearables pack delicate sensors and cradles, calling for custom inserts and conductive static barriers. Samsung’s three-layer Galaxy boxes combine wood-fibre accents with molded pulp to elevate premium positioning. The consumer electronic packaging market in Asia-Pacific maintains a growth outperformance as OEM clusters extend into Vietnam and Indonesia.
Restraints Impact Analysis of Consumer Electronics Packaging Market*
| Restraint | (~) % Impact on CAGR Forecast | Geographic Relevance | Impact Timeline |
|---|---|---|---|
| Volatile pulp, paper and polymer feedstock prices | -0.8% | Global, with particular impact on cost-sensitive markets | Short term (≤ 2 years) |
| Single-use-plastic restrictions tightening worldwide | -0.6% | Europe & North America leading, expanding globally | Medium term (2-4 years) |
| Device-as-a-Service model curbing packaged unit volumes | -0.5% | North America & Europe core, expanding to APAC | Medium term (2-4 years) |
| Semiconductor supply shocks dampening electronics output | -0.4% | Global, with concentration in Asia-Pacific manufacturing hubs | Short term (≤ 2 years) |
| Source: Mordor Intelligence | |||
Volatile pulp, paper and polymer feedstock prices
Pulp prices fluctuated 25–40% from 2024 to 2025, reflecting climatic disruptions and logistics bottlenecks.[2]Financial Times, “Global Commodity Prices and Market Analysis,” ft.comPolymer pricing remains tied to crude oil swings, squeezing converter margins in the consumer electronic packaging market. Large players hedge inputs, but small and mid-sized firms often accept shorter quoting cycles, raising cost visibility concerns for OEMs.
Single-use-plastic restrictions tightening worldwide
More than 60 countries impose bans or levies on selected plastic formats, creating a patchwork of compliance obligations. [3]UN Environment Programme, “Global Plastic Waste and Regulations,” unep.orgMaintaining multi-spec inventories elevates working capital. Transition costs to paper or compostable films reach 15–25% above incumbent solutions, weighing on near-term profitability across the consumer electronic packaging market.
*Our forecasts treat driver/restraint impacts as directional, not additive. The impact forecasts reflect baseline growth, mix effects, and variable interactions.
Consumer Electronics Packaging Market Segment Analysis
By Material:
Paper gains momentum despite plastic dominancePlastic solutions retained 54.88% of total revenue in 2025 thanks to their moisture barrier and puncture resistance properties that safeguard complex electronics. Foam inserts and thermoformed trays remain the baseline for flagship smartphones and computing hardware. The consumer electronic packaging market size for paper substrates, however, is expanding at a 7.36% CAGR through 2031 as brands align with EPR thresholds and carbon targets. Folding cartons and molded fibre cushionings now integrate water-based coatings that provide antistatic and grease resistance previously achievable only with polymers.
Technological advances such as Stora Enso’s Papira cellulose foam deliver comparable drop-test performance to expanded PE while offering fibre recyclability. Hybrid packs that combine paper exteriors with thin internal polymer films gain traction, balancing compliance with performance across the electronic packaging market. Converters marketing life-cycle assessment data win bidding rounds, reinforcing paper momentum inside the consumer electronic packaging market.



By Packaging Format:
E-commerce drives protective innovationCorrugated master cartons and pallets accounted for 30.31% of revenue in 2025 because they underpin every logistics move from factory to retailer. Growth accelerates most in protective mailers and bubble wraps, which post a 9.27% CAGR to 2031 on the back of direct-to-consumer fulfilment. The consumer electronic packaging market size for mailers rises as lightweight wearables and accessories ship individually.
Format innovation blends cushioning with brand storytelling. Textile-based pouches provide premium aesthetics and reusability, appealing to eco-centric consumers. Air-filled chambers formed in line reduce materials, and molded fibre clamshells extend retail display life while enabling curbside recycling. Multi-function formats that support both auto-packing and shelf visibility receive the highest RFP scores in OEM tenders.
By Function:
Smart packaging transforms traditional rolesSecondary and display packs retained 35.22% of value in 2025, stressing the visual impact factor in brick-and-mortar channels. Yet smart and connected variants accelerate at 8.19% CAGR, adding data-collection capabilities. The consumer electronic packaging market accommodates sensors, NFC chips, and blockchain-linked QR codes that verify authenticity and unlock after-sales services.
Primary packs miniaturise alongside component densification. Resonant cavities maintain acoustic integrity for earbuds while slim walls lower material use. Anti-counterfeit features migrate from tamper labels to embedded inks and watermarks detectable by standard smartphones. Smart functions compress supply-chain dwell times by automating receiving and warranty registration, thus raising switching barriers and embedding packaging deeper into product ecosystems.
By Consumer Electronics:
IoT devices drive next-generation requirementsSmartphones delivered 40.02% of the consumer electronic packaging market in 2025, resting on high unit volumes and premium pricing tiers. The next growth pulse lies in smart home hubs, sensors, and IoT peripherals, advancing at 10.12% CAGR to 2031. Packs must host multiple SKUs within cohesive unboxing sequences, combining cables, adapters, and printed collateral.
Ultra-compact devices such as the 3-inch NanoPhone force converters to design precision inserts that keep sensors aligned during drop impacts. Wearables require ESD-safe cushioning molded to the shape of lithium battery housings. Gaming peripherals adopt modular trays to accommodate optional accessories. As edge-AI devices proliferate, the consumer electronic packaging market gains from differentiated protection solutions tuned to thermal and static-control needs.
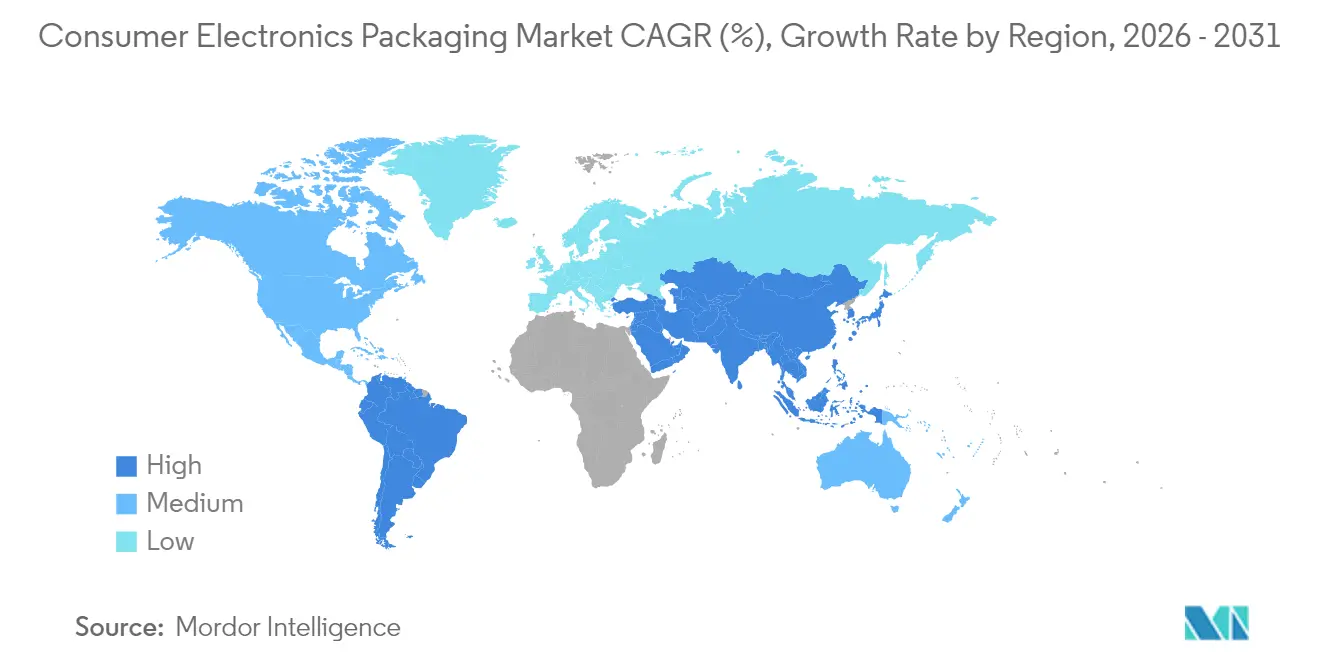
Geography Analysis
APAC Consumer Electronics Packaging Market
Asia-Pacific captured 39.74% of the consumer electronic packaging market in 2025, underpinned by its deep manufacturing bases and surging domestic consumption of smartphones and wearables. Regional CAGR stands at 9.75% through 2031, aided by policy incentives in Vietnam, India, and Malaysia that localise converter capacity and shorten lead times. Chinese converters leverage robotics to manage diverse SKU portfolios, while India’s corrugated producers add digital presses for variable print.
North America Consumer Electronics Packaging Market
North America retains strength in premium electronics and subscription models that favour recyclable fibre and smart pack integration. Brands place pilot programs for RFID-enabled circular frameworks in the US and Canada, driving early-adopter demand inside the consumer electronic packaging market. Regional logistics providers co-develop automation cells that seal on demand, aligning with parcel carrier dimension requirements.
EMEA and the Americas Consumer Electronics Packaging Market
Europe leads regulatory momentum, setting global precedents on recyclability and recycled-content thresholds. OEMs headquartered in Germany, Sweden, and France validate innovations such as cellulose foams and mono-material flexibles before global rollout. Middle East and Africa see rising smartphone penetration paired with infrastructure build-outs, generating incremental demand for moisture-resistant packs in hot climates. South America benefits from near-shoring of North American supply chains, especially as Mexican electronics production eclipses imports from China in certain categories.

Regulatory Landscape
Regulation-driven packaging redesign and claims governance are central to consumer electronics packaging, given the category's heavy use of protective plastics and frequent cross-border shipments. In the European Union, Regulation (EU) 2025/40 (Packaging and Packaging Waste Regulation, PPWR) entered into force on 11 February 2025 and applies starting 12 August 2026, tightening requirements around packaging sustainability and information presented on-pack. The same PPWR framework also sets near-term milestones for harmonization, including an Article 12(6) obligation for the European Commission to adopt implementing acts establishing harmonized labels and digital labeling specifications for packaging by 12 August 2026.
Beyond Europe, regulators and standards bodies influence how electronics brands substantiate recyclability and other environmental claims on packaging. In the United States, the Federal Trade Commission's Guides for the Use of Environmental Marketing Claims (16 CFR Part 260, the Green Guides) remain a core reference point for packaging-related marketing claims, with the timing of any update still pending per official FTC materials as of July 2026. EU design and labeling requirements, combined with US marketing-claims governance, raise the compliance burden for global OEMs and converters, increasing the need for standardized labeling, traceable material specifications, and documentation that supports circularity and recyclability assertions.
Competitive Landscape
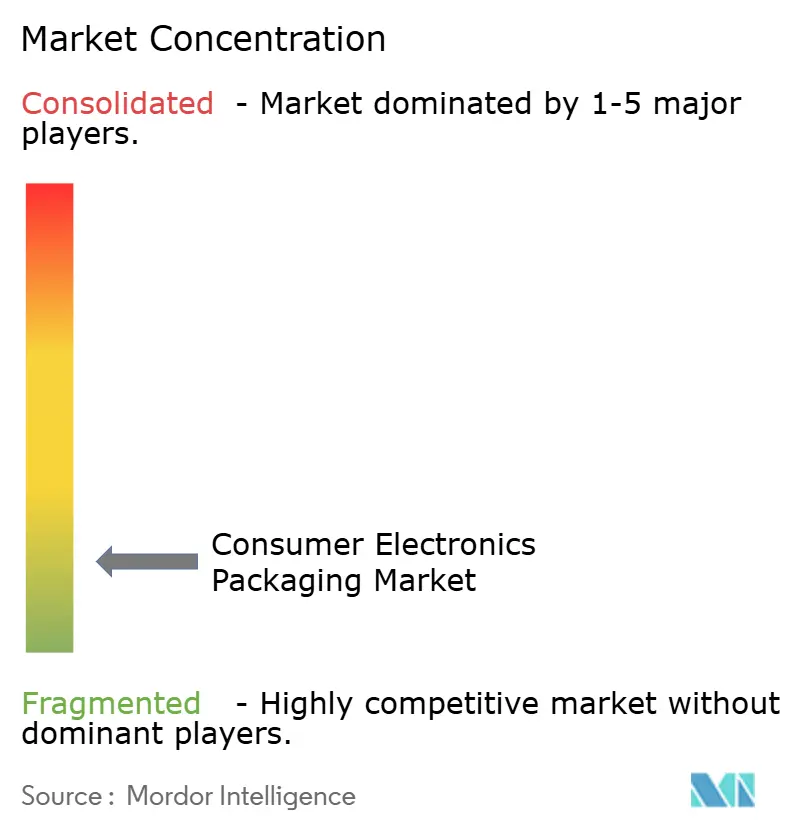
Mergers and acquisitions shape a fragmented field. The July 2024 merger of Smurfit Kappa and WestRock created a global leader with fortified R&D pipelines in renewable substrates. International Paper finalised its DS Smith purchase in January 2025, boosting European box capacity and closed-loop recycling infrastructure. Scale advantages allow top players to hedge commodity swings and invest in AI-driven converting lines, elevating service standards across the consumer electronic packaging market.
Strategic themes include vertical integration from pulp to finished box, investment in bio-based barrier chemistry, and digital workflows that tailor artwork per region. Ranpak, Sonoco, and Stora Enso push fibre-based cushioning that rivals polymer foams, expanding addressable share. Niche innovators gain contracts through textile pouches and molded fibre electronics trays with zero plastic. Technology firms enter via smart-label platforms, bundling data analytics with physical packs and blurring category lines.
Intellectual-property portfolios focused on authentication, right-size algorithms, and cellulose foams become bargaining chips in licensing and joint venture talks. OEM sourcing teams favor partners offering cradle-to-gate emissions dashboards, intensifying competition on environmental performance rather than price alone. The consumer electronic packaging market thus evolves toward solution ecosystems where hardware, software, and data converge.
Consumer Electronics Packaging Industry Leaders
Sonoco Products Company
Sealed Air Corporation
Mondi Group
Amcor plc
Huhtamaki Oyj
- *Disclaimer: Major Players sorted in no particular order
Consumer Electronics Packaging Market Companies Covered in this Report
- Sealed Air Corporation
- Smurfit WestRock
- International Paper Co.
- Pregis LLC
- Sonoco Products Co.
- Stora Enso Oyj
- Dordan Manufacturing
- Mondi Group
- Amcor plc
- Nefab AB
- UFP Technologies Inc.
- ProAmpac LLC
- Huhtamaki Oyj
- DunaPack Packaging Group
- Clondalkin Group
- Johns Byrne Co.
- Ball Corp. (Aerosol & Transit)
- Molded Fiber Glass Co.

Market Opportunities and Future Outlook
Named regulatory milestones and corporate programs are creating whitespace for fiber-based protective formats, right-sized packs, and packaging that reduces material intensity without compromising drop and ESD performance. The EU PPWR application date of 12 August 2026, along with the move toward harmonized labels and digital labeling specifications, is driving demand for converters that can deliver compliant artwork workflows, traceability, and documented recyclability across multi-country SKUs. This is especially relevant for e-commerce-heavy electronics categories where void fill, cushioning, and tamper evidence are engineered into packs, and where minimization and labeling requirements affect both structural design and line operations.
Material substitution and protective-performance innovation are also opening opportunities at scale, anchored by supplier actions in 2026. In April 2026, Murata Manufacturing announced its bulk case packaging for MLCC components, citing up to a 99% reduction in packaging material weight versus conventional taping, underscoring the value of packaging redesign for high-volume electronics supply chains. In July 2026, Jabil announced large-scale production availability for molded fiber packaging intended to replace single-use plastic trays, bags, and foam, supporting consumer-electronics brands that are shifting away from plastic-dominant protective packaging while maintaining transit robustness. These steps align with ongoing adoption of molded fiber and barrier papers for electronics applications, including higher-spec wet-press molded fiber solutions positioned as alternatives to PET blister trays and EPE foam where surface protection and anti-static performance are required.
Recent Industry Developments in Consumer Electronics Packaging Market
- July 2026: Jabil announced large-scale production availability for molded fiber packaging solutions designed to replace single-use plastic trays, bags, and foam used by global brands. This expands the industrial base for fiber protective formats and supports electronics packaging conversions where transit protection and consistent cosmetic quality are required. Scaling availability at a major manufacturing partner reduces qualification friction for brand owners seeking multi-region rollouts.
- November 2025: Sonoco integrated its metal and paper packaging businesses into a unified Sonoco Consumer Packaging EMEA/APAC division. The restructuring broadens the materials toolkit available under a single commercial organization, which fits electronics OEM demand for harmonized global sourcing across fiber-based formats and complementary rigid packaging needs. It also streamlines cross-regional support as sustainability-driven redesigns accelerate.
- October 2024: Smurfit WestRock invested USD 40 million to add a fully automated large-format line in Warwick, Quebec. The capacity and automation upgrade strengthens throughput and consistency for corrugated and transit-ready formats used in consumer electronics distribution. It also supports right-sizing and high-mix operations that are increasingly important for e-commerce fulfillment.


Consumer Electronics Packaging Market Report Scope and Research Methodology
Market Definition and Coverage
This market covers packaging used to protect, ship, and present consumer electronics products, from factory packing through retail and e-commerce delivery. The sizing is captured in value terms and includes the packaging materials and formats typically purchased for these electronics.
Scope exclusions: Packaging for industrial electronics, semiconductor wafer and chip-level packaging, and packaging used mainly for heavy electrical equipment is excluded.
Segments Covered in This Report
- By Material
- Plastics
- Foam
- Thermoformed Trays
- Other Plastics
- Paper
- Folding Cartons
- Corrugated Boxes
- Other Papers
- Plastics
- By Packaging Format
- Blister Packs
- Clamshells
- Protective Mailers and Bubble Wrap
- Trays and Inserts
- Corrugated Boxes and Pallets
- By Function
- Primary Packaging
- Secondary/Display Packaging
- Tertiary and Logistics Packaging
- Anti-counterfeit and Security Packaging
- Smart/Connected Packaging
- By Consumer Electronics
- Smartphones
- Computing Devices
- TV and Set-Top Boxes
- Wearables and Hearables
- Smart Home / IoT Devices
- Other Consumer Electronics
- By Geography
- North America
- United States
- Canada
- Mexico
- Europe
- Germany
- United Kingdom
- France
- Italy
- Spain
- Russia
- Rest of Europe
- Asia-Pacific
- China
- India
- Japan
- South Korea
- Australia and New Zealand
- Rest of Asia-Pacific
- Middle East and Africa
- Middle East
- United Arab Emirates
- Saudi Arabia
- Turkey
- Rest of Middle East
- Africa
- South Africa
- Nigeria
- Egypt
- Rest of Africa
- Middle East
- South America
- Brazil
- Argentina
- Rest of South America
- North America
Data Sources, Market Sizing, and Validation
Desk Research
Desk work starts by mapping the demand pool for consumer devices and the packaging materials that usually go with them, and then it is grounded using public statistics and standards. We refer to sources such as UN Comtrade for trade flows of relevant packaging materials, World Bank macro indicators, and national statistics offices for manufacturing and consumer spending signals that impact device shipments.
To keep packaging assumptions realistic, inputs are also checked using sources such as EPA recycling and packaging waste information, ISO and ASTM packaging test standards context, and academic or peer reviewed papers on protective packaging performance and material substitution. Company filings, investor presentations, and reputable press coverage are used to cross-check packaging mix shifts like plastics to paper and molded fiber.
Paid subscriptions are used selectively for company financials, patent landscapes, and shipment-level trade intelligence. The examples listed above are not exhaustive because we relied on other references during validation and research clarification.
Primary Interviews and Surveys
Primary work is used to confirm what the desk model cannot show cleanly, especially packaging intensity by device category and how pricing moves with materials and freight. We speak with packaging converters, raw material suppliers, contract manufacturers, brand-side packaging teams, and logistics stakeholders across APAC, EMEA, and the Americas so assumptions on mix, ASP ranges, and procurement cycles are checked from multiple sides.
Distribution of primary research fieldwork respondents
| Company type | Respondent position | Region |
|---|---|---|
| Top tier: 37% | CXOs: 13% | APAC: 38% |
| Mid tier: 44% | Functional/Unit leaders: 43% | EMEA: 35% |
| Smaller Players: 19% | Managers: 44% | Americas: 27% |
Market-Sizing & Forecasting
The core model is built using a top-down demand reconstruction where consumer electronics shipment and production signals are translated into packaging consumption, and then converted to value using realistic ASP ladders by material and format. Because the market is broad, we corroborate totals with selective bottom-up checks such as sampled converter revenue alignment, channel checks on packaging volumes, and price per unit ranges multiplied by device shipment bands, which are then used to adjust outliers.
A few practical inputs that shape the model include consumer device shipment trends, e-commerce share of electronics sales (which changes protective packaging needs), packaging weight per shipped unit, recycled content and sustainability targets affecting material shifts, pulp and polymer price movement, and freight cost direction. Where direct datapoints are thin for a format or country, gaps are handled by using nearby market analogs with similar device mix and packaging regulations, followed by expert review to keep assumptions conservative.
For forecasting, we use scenario analysis supported by multivariate regression, where growth is linked to device volumes, packaging mix shifts, and material price outlooks. The forward view is stress-tested with what interviewees expect for refresh cycles, product launches, and procurement timing, and the final CAGR path is kept consistent with these real-world constraints.
Data Validation & Update Cycle
Outputs are validated through triangulation across independent signals such as device shipment direction, packaging material pricing, and trade or production indicators, and then checked for variance by region and year. When a number looks off, we revisit the conversion factors, redo currency conversions, and re-check the ASP build so the drivers match what suppliers and buyers describe.
Before sign-off, the model is reviewed in steps by another analyst, and follow-up calls are triggered when new public results, policy changes, or material price moves could shift the market meaningfully. Reports are refreshed annually, and interim updates are added for material events. Right before delivery, a final pass is completed so clients receive the latest updated view.
Mordor Intelligence's Consumer Electronics Packaging Market Size Versus Other Published Estimates
Published market sizes for consumer electronics packaging often differ because the timing of currency conversion, the way ASPs are updated with pulp and polymer swings, and how device shipment revisions are handled can change the total meaningfully. Another frequent reason is scope, where some figures blend broader consumer packaging or adjacent electronics supply chain packaging into the same number.
When the estimate is refreshed around major device launch cycles and the latest material price indices are carried into the ASP ladder before converting to USD, the value tends to land differently, which is how the 2026 sizing was finalized in Mordor Intelligence. Differences also show up when a publisher uses a single blended price for packaging across devices, or when older trade and production baselines are carried forward without re-checking region splits with current demand signals.
Benchmark comparison
| Source | Market Size | Gaps in Research Methodology |
|---|---|---|
| Mordor Intelligence | USD 92.03 B (2026) | |
| Global Consultancy A | USD 67.22 B (2025) | Uses an earlier base year and a longer forecast window, which can dampen near-term device-cycle volatility, and the pricing build can differ if packaging ASPs are not re-rated frequently with material inputs. |
| Industry Data Publisher B | USD 52.07 B (2024) | Often framed as consumer packaging tied to electronics end-use, which can apply a narrower packaging scope and rely on aggregated pricing assumptions, with less emphasis on device-level packaging intensity shifts from e-commerce and protection needs. |
The spread across these figures mainly comes from scope edges and the year used for pricing and conversion, followed by how frequently packaging ASPs are updated as materials and freight move. By keeping the value build traceable to device demand signals, packaging intensity assumptions, and a repeatable pricing logic, the final market number stays easier to audit and update.


Key Questions Answered in the Report
What is the current size of the consumer electronic packaging market?
The consumer electronic packaging market size is USD 92.03 billion in 2026 and is projected to reach USD 126.23 billion by 2031 at a 6.53% CAGR.
Which region holds the largest share of the consumer electronic packaging market?
Asia-Pacific leads with 39.74% of global revenue in 2025 and is also the fastest-growing region at a 9.75% CAGR to 2031.
Which material segment is growing fastest?
Paper-based solutions are advancing at a 7.36% CAGR because EPR rules and plastic-reduction mandates encourage fibre adoption.
How are e-commerce trends influencing packaging formats?
E-commerce drives demand for protective mailers and bubble wrap solutions, which are growing at a 9.27% CAGR due to parcel-shipping requirements.
What role does smart packaging play in the market?
Smart and connected packaging, growing at an 8.19% CAGR, integrates authentication, data capture, and consumer engagement features, redefining traditional packaging functions.
Who are the major players shaping the competitive landscape?
Following recent consolidation, Smurfit WestRock and International Paper lead on scale, while Ranpak, Sonoco, and Stora Enso push innovation in fibre-based cushioning and smart packaging.
Page last updated on:





