POP Display Market Size and Share
Market Overview
| Study Period | 2020 - 2031 |
|---|---|
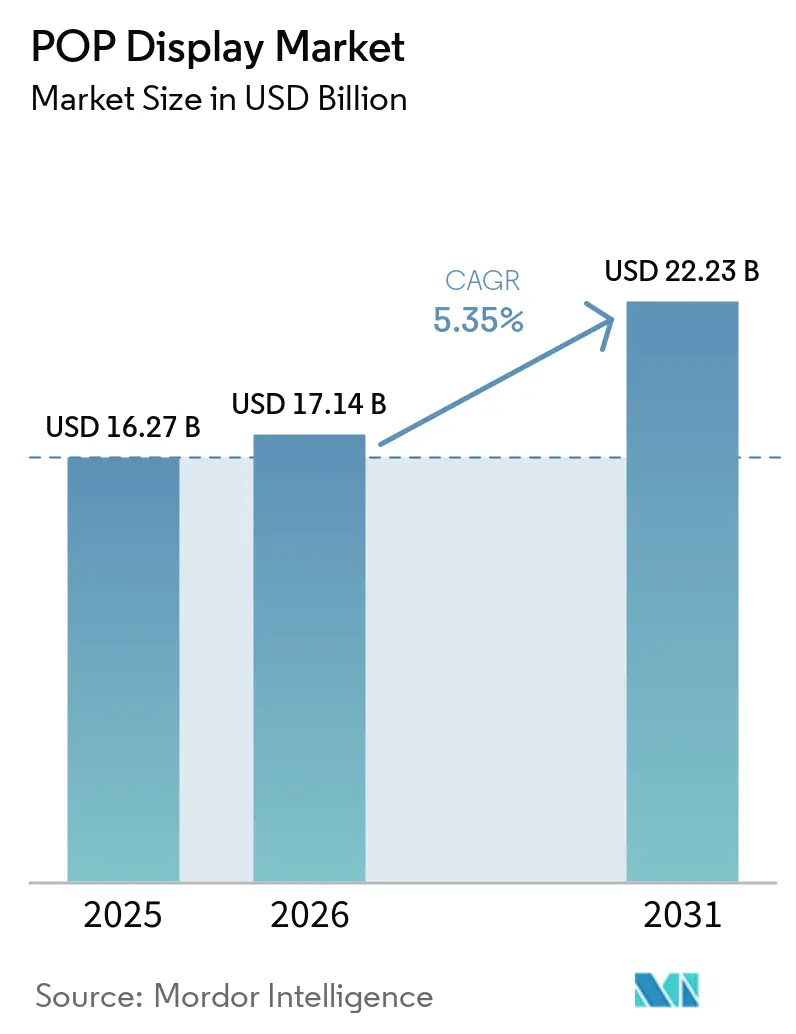
| Market Size (2026) | USD 17.14 Billion |
| Market Size (2031) | USD 22.23 Billion |
| Growth Rate (2026 - 2031) | 5.35% CAGR |
| Fastest Growing Market | Asia Pacific |
| Largest Market | North America |
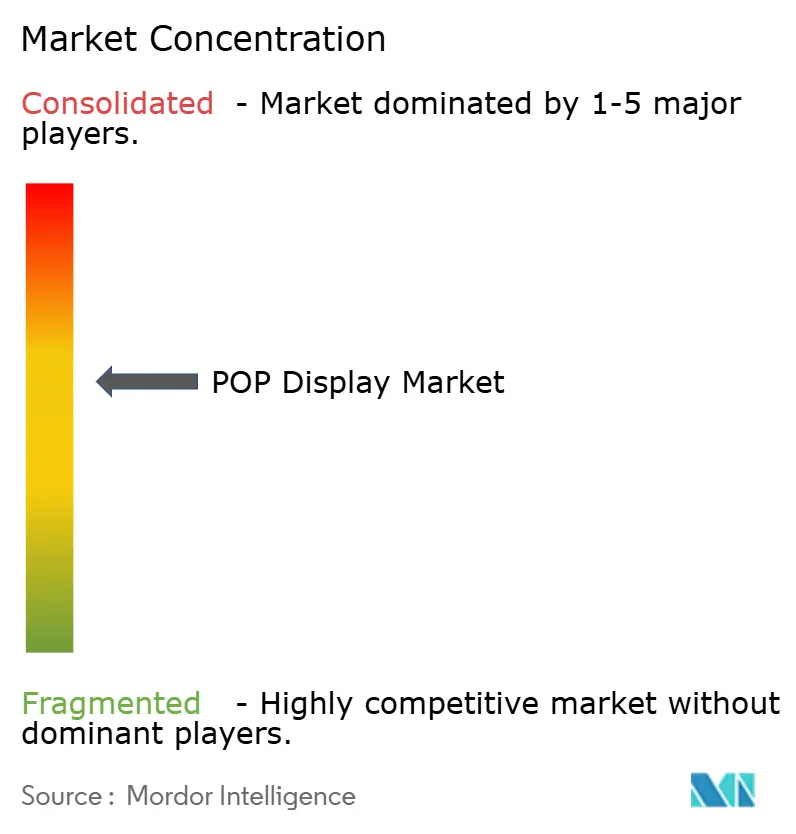
| Market Concentration | Medium |
Major Players *Disclaimer: Major Players sorted in no particular order Image © Mordor Intelligence. Reuse requires attribution under CC BY 4.0. | |
POP Display Market Analysis by Mordor Intelligence
The POP display market size in 2026 is estimated at USD 17.14 billion, growing from 2025 value of USD 16.27 billion with 2031 projections showing USD 22.23 billion, growing at 5.35% CAGR over 2026-2031. Retailers continue to invest in on-shelf theatre because impulse purchases still originate in stores even as e-commerce grows. Floor displays and corrugated cardboard solutions remain the backbone of merchandising programs, reflecting retailers’ need for cost-effective, recyclable materials that can be deployed quickly across national store networks. Heightened interest in retail media networks is driving the integration of sensors and digital screens into physical displays, allowing brands to measure engagement and optimize planograms in real time. At the same time, sustainability legislation and raw-material cost spikes are accelerating the shift toward fibre-based substrates and closed-loop supply chains.
Key Report Takeaways
- By product type, floor displays captured 43.15% of the POP display market share in 2025 while posting a 5.75% CAGR through 2031.
- By material, corrugated cardboard commanded 35.05% share of the POP display market size in 2025; foam board is projected to expand at 6.1% CAGR to 2031.
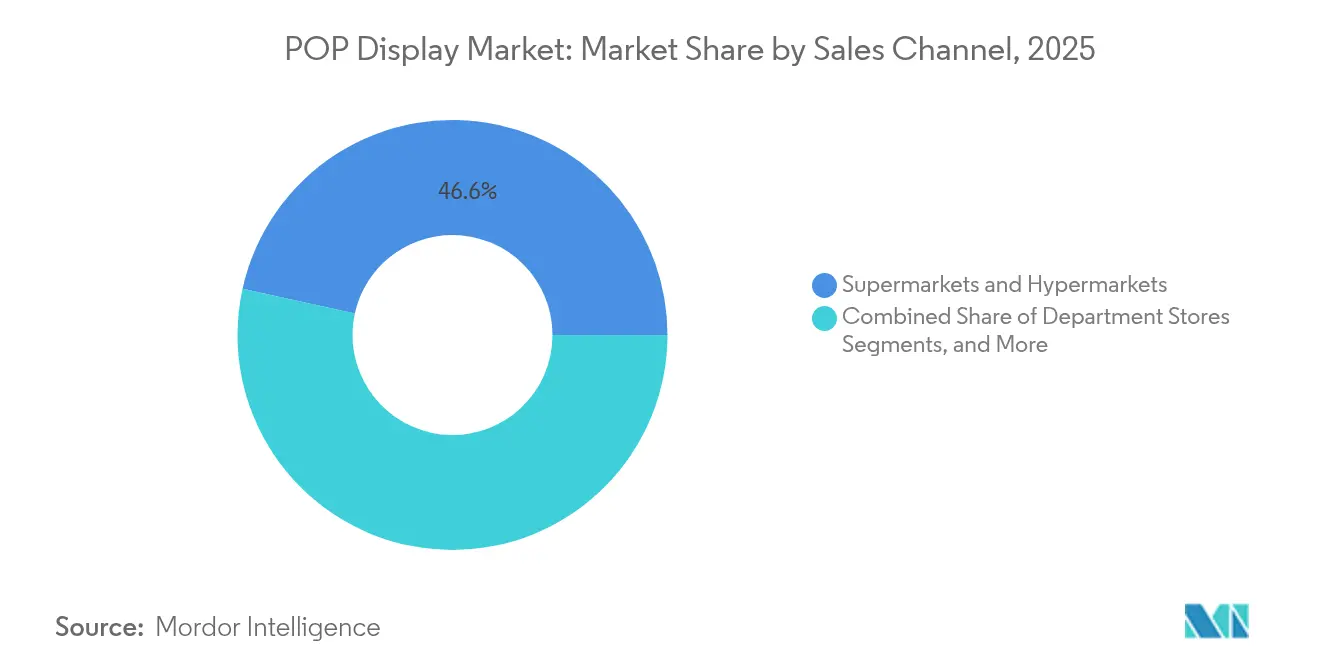
- By sales channel, supermarkets and hypermarkets held 46.55% revenue share in 2025, whereas department stores show the fastest trajectory at 6.05% CAGR through 2031.
- By end user, food and beverages accounted for 33.65% of the POP display market size in 2025; cosmetics and personal care is advancing at a 7.45% CAGR through 2031.
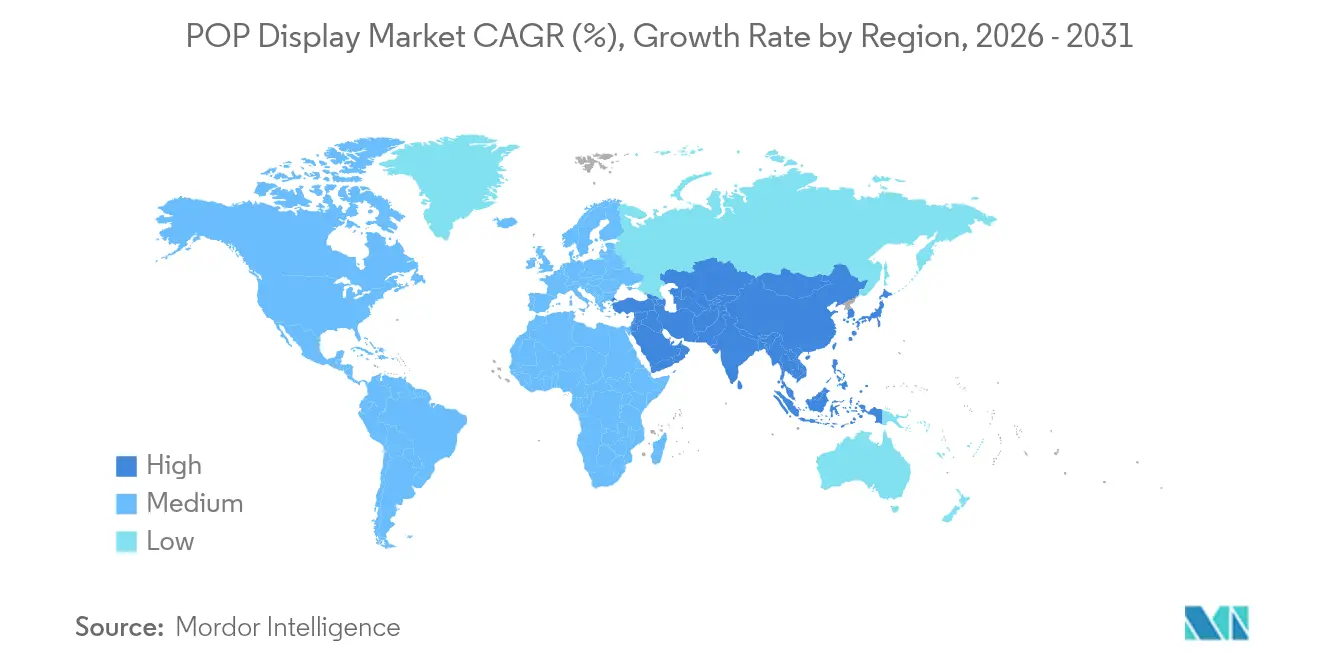
- By geography, North America led with 24.25% share of the POP display market in 2025, while Asia-Pacific is accelerating at 5.55% CAGR through 2031
Note: Market size and forecast figures in this report are generated using Mordor Intelligence’s proprietary estimation framework, updated with the latest available data and insights as of 2026.
Global POP Display Market Trends and Insights
Drivers Impact Analysis*
| Driver | (~) % Impact on CAGR Forecast | Geographic Relevance | Impact Timeline |
|---|---|---|---|
| Surging FMCG and convenience-store roll-outs | +1.20% | Asia-Pacific, Latin America, Middle East | Medium term (2-4 years) |
| Retailers’ demand for high-conversion in-store touchpoints | +0.90% | Global with focus on North America and Europe | Short term (≤ 2 years) |
| Fibre-based corrugated replacing plastics | +0.80% | Europe, North America, spillover to Asia-Pacific | Long term (≥ 4 years) |
| Smart sensor-equipped displays for real-time analytics | +0.70% | North America, Europe, urban Asia-Pacific | Medium term (2-4 years) |
| Modular display-as-a-service rental models | +0.50% | North America, Europe | Short term (≤ 2 years) |
| 3-D printing for ultra-short-run custom units | +0.40% | Global with early adoption in developed markets | Long term (≥ 4 years) |
| Source: Mordor Intelligence | |||
Surging FMCG and Convenience-Store Roll-outs in Emerging Economies
Aggressive store-opening campaigns by chains such as 7-Eleven and Lawson are fuelling localised demand for compact merchandising fixtures that can generate maximum impact within tight footprints. Small-format stores already represent 73% of modern grocery trade in Indonesia, compared with 47% in 2013, underscoring the need for vertical, modular solutions that fit limited floor space. [1]Retail Asia Editorial Desk, “Indonesia modern trade report 2024,” retailasia.com
Retailers’ Demand for High-conversion In-store Touchpoints
Brand owners now expect every square foot of selling space to deliver measurable returns. Ferrero’s 2025 Perfect Store programme illustrates this shift, with displays linked to analytics dashboards that reveal SKU-level performance in real time.[2]Wiser Solutions, “Ferrero Perfect Store case study 2025,” wiser.com Such data-rich installations allow category managers to tweak placement during a promotion cycle rather than after it.
Fibre-based Corrugated Replacing Plastics
Legislation such as the UK Plastic Packaging Tax at GBP 210.82 per tonne for packs with less than 30% recycled content is pushing retailers to “paperise” promotional displays. International Paper reports rising orders for kraft carry sacks that substitute traditional plastic units, positioning fibre as the default for short-life campaigns
Smart Sensor-equipped POP for Real-time Analytics
Retailers are installing lift-and-learn shelves and eye-tracking modules inside cardboard displays. Milesight’s VS133 AI ToF sensor network, deployed in more than 700 stores, captures dwell time and conversion metrics, enabling managers to redeploy labour and adjust planograms on the fly.[3]Milesight, “Retail people-counting deployment guide 2025,” milesight.comRaydiant notes sales uplifts of up to 180% when interactive screens replace static graphics
Restraints Impact Analysis*
| Restraint | (~) % Impact on CAGR Forecast | Geographic Relevance | Impact Timeline |
|---|---|---|---|
| E-commerce and digital ads siphoning in-store budgets | -1.10% | Global with peak effect in North America and Europe | Short term (≤ 2 years) |
| Volatile linerboard and resin pricing | -0.80% | Global with acute pressure in North America | Short term (≤ 2 years) |
| Strict landfill and plastics-tax regulations | -0.60% | Europe expanding to North America and Asia-Pacific | Medium term (2-4 years) |
| Shrink-floor retail concepts lowering display density | -0.40% | North America, Europe, urban Asia-Pacific | Long term (≥ 4 years) |
| Source: Mordor Intelligence | |||
E-commerce and Digital Ads Siphoning In-store Budgets
A tilt toward online advertising has curbed some physical merchandising spend as marketing chiefs chase attributable clicks. Research finds ROI uncertainty and store interference fears slowing adoption of in-store retail media, delaying budget migration back to fixtures. To compensate, retailers are piloting audio ads and shelf-edge screens that require minimal floor-space reconfiguration.
Volatile Linerboard and Resin Pricing Squeezes Margins
Containerboard rose by USD 70 per tonne in January 2025, compressing converter margins and forcing price pass-throughs to brand owners. Smaller fabricators face disproportionate pressure, prompting many to redesign structures to reduce flute weight while maintaining stacking strength.
*Our forecasts treat driver/restraint impacts as directional, not additive. The impact forecasts reflect baseline growth, mix effects, and variable interactions.
Segment Analysis
By Product Type: Floor Displays Drive Retail Transformation
Floor units held 43.15% share of the POP display market in 2025 and are expanding at 5.75% CAGR, confirming that large-format fixtures remain the anchor of experiential selling zones. Countertop and end-cap units target impulse moments near tills and aisle terminations. Pallet displays support warehouse clubs and discount retailers, enabling cross-docking straight to sales floors. The Look Company notes that grocers now fuse sampling stations with floor graphics to trigger recipe-led baskets, spurring demand for hybrid cardboard-and-screen constructions.Floor displays’ scale allows embedded sensors, QR codes and NFC tags, linking physical touchpoints to retail-media networks. As brands pay tenancy fees for prime floor real estate, store operators derive new income streams, further scaling the POP display market. End-cap upgrades mirror that trend, offering dynamic LED headers that switch creatives by daypart, improving SKU rotation without manual relabeling.


By Material: Corrugated Cardboard Leadership Faces Sustainable InnovationCorrugated cardboard represented 35.05% of the POP display market size in 2025, but foam board is advancing at 6.1% CAGR because its smooth surface delivers high-definition print crucial for cosmetics and tech gadgets. Fibre dominance stems from its light weight, recyclability and comparatively low unit cost. Plastic and metal remain vital for long-life gondolas in outdoor or high-humidity zones, yet taxes on virgin polymer intensify substitution pressure. Emergent bio-composite boards mix cellulose with crop residue, promising similar crush resistance at lower grammage. Retailers welcome such substrates because they simplify end-of-life recycling audits mandated by EPR regimes. Foam board’s rise is pronounced in premium skincare where structure, colour fidelity and edge-lit logos elevate shelf presence without heavy steel frames.
Corrugated cardboard represented 35.05% of the POP display market size in 2025, but foam board is advancing at 6.1% CAGR because its smooth surface delivers high-definition print crucial for cosmetics and tech gadgets. Fibre dominance stems from its light weight, recyclability and comparatively low unit cost. Plastic and metal remain vital for long-life gondolas in outdoor or high-humidity zones, yet taxes on virgin polymer intensify substitution pressure. Emergent bio-composite boards mix cellulose with crop residue, promising similar crush resistance at lower grammage. Retailers welcome such substrates because they simplify end-of-life recycling audits mandated by EPR regimes. Foam board’s rise is pronounced in premium skincare where structure, colour fidelity and edge-lit logos elevate shelf presence without heavy steel frames.
By Sales Channel: Supermarkets Dominate While Department Stores Accelerate Supermarkets and hypermarkets commanded 46.55% share of the POP display market in 2025, leveraging weekly traffic and broad aisles for promotional theatre. Department stores, however, are not standing still and will grow 6.05% CAGR to 2031 as beauty halls and luxury corners exploit storytelling fixtures with embedded RFID mirrors. Specialty chains adopt curated tablescapes to illustrate provenance narratives, whereas convenience formats prioritise slimline towers positioned near grab-and-go coolers. Analytics provider Sensalytics reports that department-store dwell time around fragrance displays climbs 18% when motion-triggered visuals replace static headers. Such metrics justify incremental capex, repositioning these legacy retailers as experience hubs rather than pure assortment aggregators.
Supermarkets and hypermarkets commanded 46.55% share of the POP display market in 2025, leveraging weekly traffic and broad aisles for promotional theatre. Department stores, however, are not standing still and will grow 6.05% CAGR to 2031 as beauty halls and luxury corners exploit storytelling fixtures with embedded RFID mirrors. Specialty chains adopt curated tablescapes to illustrate provenance narratives, whereas convenience formats prioritise slimline towers positioned near grab-and-go coolers. Analytics provider Sensalytics reports that department-store dwell time around fragrance displays climbs 18% when motion-triggered visuals replace static headers. Such metrics justify incremental capex, repositioning these legacy retailers as experience hubs rather than pure assortment aggregators.
By End User: Food and Beverages Lead While Cosmetics Surge
Food and beverages drove 33.65% of POP display market revenue in 2025 because high purchase frequency and cross-merchandising stimulate unplanned basket additions. Seasonal campaigns around sporting events or holidays continue to rely on large corrugated pallets fronting store entrances. Cosmetics and personal care will outpace all other sectors, growing 7.45% CAGR, as shoppers seek try-and-buy interaction that online channels cannot replicate.GCI Magazine highlights refillable lipstick casings and travel-size miniatures as 2025 packaging trends, each demanding bespoke organisers that emphasise sustainability cues. Pharmaceutical displays must satisfy strict leaflet accommodation rules, driving demand for tear-off literature pockets integrated into shelving wings. Electronics vendors keep using lift-and-learn pedestals that illuminate when a shopper picks up a device, creating tactile engagement while recording interaction data.
Geography Analysis
North America retained 24.25% share of the POP display market in 2025. Growth through 2030 stems from retail-media rollouts and capital investments such as WestRock’s automated Wisconsin “superplant,” which enhances corrugated capacity and shortens lead times. US grocers increasingly monetise end-cap inventory through programmatic booking systems that bundle digital kiosks with fibre kiosks. Canada’s EPR legislation spurs demand for displays certified for curbside recycling, while Mexico’s rising middle class drives adoption of branded shippers in convenience chains linked to cross-border supply hubs.
Asia-Pacific will record the fastest CAGR at 5.55% through 2031 as convenience chains plan 10,000 additional outlets by 2026. Chinese smart retail operators retrofit stores with AI-driven planogram optimisation, compressing refresh cycles from weeks to hours. India’s organised retail corridor adds malls in second-tier cities, where brands deploy bilingual graphics and QR-coded recipe demos to build category education. Southeast Asian formats, often under 200 sqm, rely on slim, fold-flat towers that ship in knock-down kits to minimise freight.Europe’s POP display market dynamics revolve around sustainability. The UK’s plastic-tax framework and Germany’s VerpackG law incentivise closed-loop substrates gov.uk. Retailers demand chain-of-custody certification, propelling interest in FSC-certified corrugated and water-based inks. French hypermarkets trial paper-based cooler claddings that resist condensation, extending fibre usage into refrigerated aisles. Digital adoption is growing as well, with grocery groups in the Netherlands linking ESL-equipped gondolas to mobile apps for instant promotions. Despite inflationary headwinds, premium positioning across cosmetics and gourmet food sustains unit values, offsetting volume softness in price-sensitive categories.

Competitive Landscape
The POP display market remains moderately fragmented. The top five converters hold roughly 35% combined revenue, leaving room for nimble specialists that focus on material science or rapid prototyping. DS Smith, Smurfit WestRock and International Paper leverage integrated mills and containerboard self-sufficiency to buffer input volatility and court large FMCG advertisers. The 2024 merger that formed Smurfit WestRock created a USD 34 billion packaging leader with expanded Americas-Europe coverage and deeper R&D muscle, prompting rivals to examine alliance possibilities .
Innovation themes revolve around sensor integration, subscription rental and recyclable coatings. Display-as-a-service models from providers such as Creative Displays Now! bundle design, install, analytics and end-of-life recovery into a single fee, appealing to brands wary of capex. Start-ups specialising in conductive inks and printed electronics offer plug-and-play modules that flash pricing or collect shopper count without external power packs. Corrugated producers invest in nano-liner R&D to slash grammage without damaging stacking strength, aligning with retailer zero-waste pledges.
ProMach’s fresh capital raise in February 2025 signals heightened automation spending across folding-carton and display lines, aiming at faster changeovers for short promotions. Meanwhile, Proto Labs’ on-demand 3-D printing gives agencies the ability to iterate display accessories overnight, compressing creative development timelines from weeks to days. Against this backdrop, smaller region-specific fabricators may face acquisition as larger groups seek last-mile fulfilment footprints near urban consumption centres.
POP Display Industry Leaders
DS Smith PLC
WestRock Company
Smurfit Kappa Group PLC
International Paper Company
Stora Enso Oyj
- *Disclaimer: Major Players sorted in no particular order

Recent Industry Developments
- June 2025: Green Bay Packaging committed USD 1 billion to expand its Arkansas kraft-liner facility, significantly boosting domestic board supply.
- May 2025: Hotpack Global opened a USD 100 million New Jersey plant for customised sustainable food containers.
- March 2025: Smurfit WestRock posted Q1 2025 revenue of USD 7.656 billion with adjusted EBITDA of USD 1.252 billion.
- February 2025: ProMach welcomed BDT Capital Partners as co-investor to accelerate automation rollouts.


Global POP Display Market Report Scope
Point-of-purchase (POP) displays are marketing materials or advertisements strategically placed next to merchandise to boost promotions. Typically, these displays are found in checkout areas or other spots where purchasing decisions are made.
The POP Display market is segmented by product type (countertop displays, floor displays, endcap displays, pallet displays, hanging displays, and other product types), material (corrugated cardboard, plastic, metal, and wood), sales channel (departmental stores, supermarkets and hypermarkets, specialty stores, convenience stores), end-user industry (food and beverages, cosmetics and personal care, pharmaceuticals, electronics, automotive, and other end users), and geography (North America, Europe, Asia Pacific (includes Australia and New Zealand), Latin America, Middle East and Africa). The market sizes and forecasts are provided in terms of value (USD) for all the above segments.
| Countertop Displays |
| Floor Displays |
| End-cap Displays |
| Pallet Displays |
| Others |
| Corrugated Cardboard |
| Plastic |
| Metal |
| Wood |
| Others |
| Department Stores |
| Supermarkets and Hypermarkets |
| Specialty Stores |
| Others |
| Food and Beverages |
| Cosmetics and Personal Care |
| Pharmaceuticals |
| Electronics and Appliances |
| Others |
| North America | United States | |
| Canada | ||
| Mexico | ||
| South America | Brazil | |
| Argentina | ||
| Rest of South America | ||
| Europe | Germany | |
| United Kingdom | ||
| France | ||
| Italy | ||
| Spain | ||
| Rest of Europe | ||
| Asia-Pacific | China | |
| Japan | ||
| India | ||
| South Korea | ||
| Southeast Asia | ||
| Rest of Asia-Pacific | ||
| Middle East and Africa | Middle East | Saudi Arabia |
| United Arab Emirates | ||
| Turkey | ||
| Rest of Middle East | ||
| Africa | South Africa | |
| Nigeria | ||
| Egypt | ||
| Egypt | ||
| Rest of Africa | ||
| By Product Type | Countertop Displays | ||
| Floor Displays | |||
| End-cap Displays | |||
| Pallet Displays | |||
| Others | |||
| By Material | Corrugated Cardboard | ||
| Plastic | |||
| Metal | |||
| Wood | |||
| Others | |||
| By Sales Channel | Department Stores | ||
| Supermarkets and Hypermarkets | |||
| Specialty Stores | |||
| Others | |||
| By End User | Food and Beverages | ||
| Cosmetics and Personal Care | |||
| Pharmaceuticals | |||
| Electronics and Appliances | |||
| Others | |||
| By Geography | North America | United States | |
| Canada | |||
| Mexico | |||
| South America | Brazil | ||
| Argentina | |||
| Rest of South America | |||
| Europe | Germany | ||
| United Kingdom | |||
| France | |||
| Italy | |||
| Spain | |||
| Rest of Europe | |||
| Asia-Pacific | China | ||
| Japan | |||
| India | |||
| South Korea | |||
| Southeast Asia | |||
| Rest of Asia-Pacific | |||
| Middle East and Africa | Middle East | Saudi Arabia | |
| United Arab Emirates | |||
| Turkey | |||
| Rest of Middle East | |||
| Africa | South Africa | ||
| Nigeria | |||
| Egypt | |||
| Egypt | |||
| Rest of Africa | |||


Key Questions Answered in the Report
What is the current size of the POP display market?
The POP display market stands at USD 17.14 billion in 2026 and is projected to reach USD 22.23 billion by 2031.
Which product type leads the POP display market?
Floor displays lead with 43.15% share in 2025 and continue to grow at 5.75% CAGR.
Which region is growing fastest in the POP display market?
Asia-Pacific records the highest growth, advancing at 5.55% CAGR through 2031.
How are sustainability regulations affecting POP display materials?
Taxes on virgin plastic and EPR laws push brands toward fibre-based corrugated and recyclable composites, reshaping material choices.
Page last updated on:


