3PL Value-Added Packaging Services Market Size and Share
Market Overview
| Study Period | 2020 - 2031 |
|---|---|
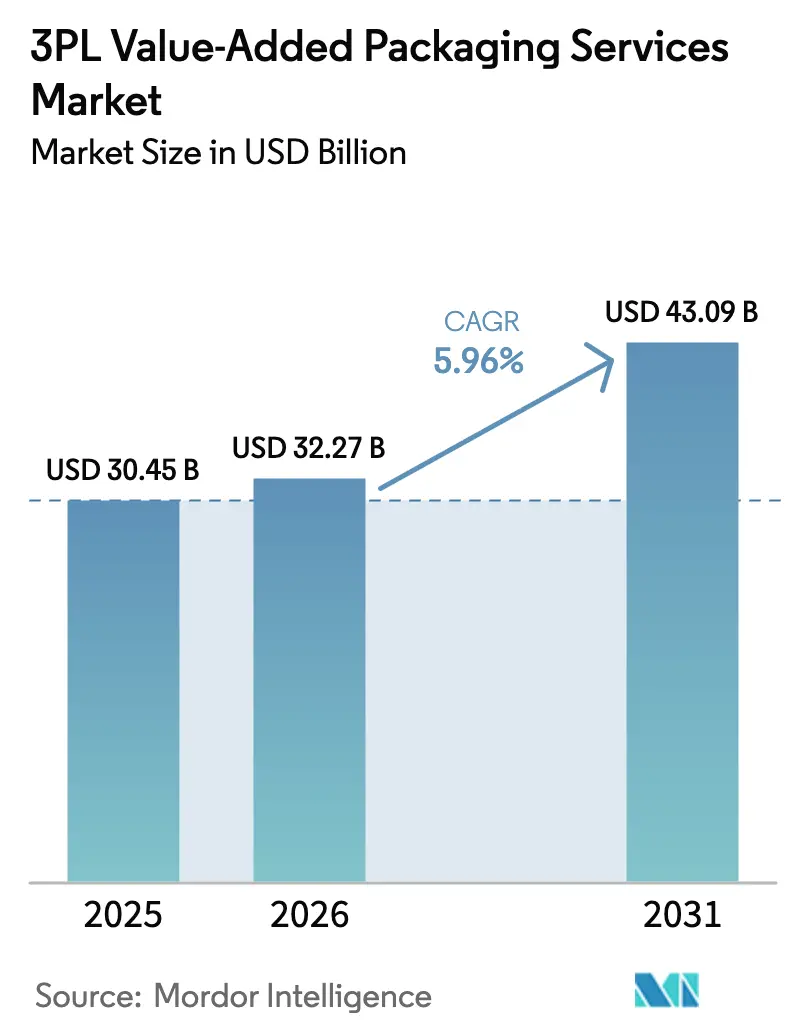
| Market Size (2026) | USD 32.27 Billion |
| Market Size (2031) | USD 43.09 Billion |
| Growth Rate (2026 - 2031) | 5.96% CAGR |
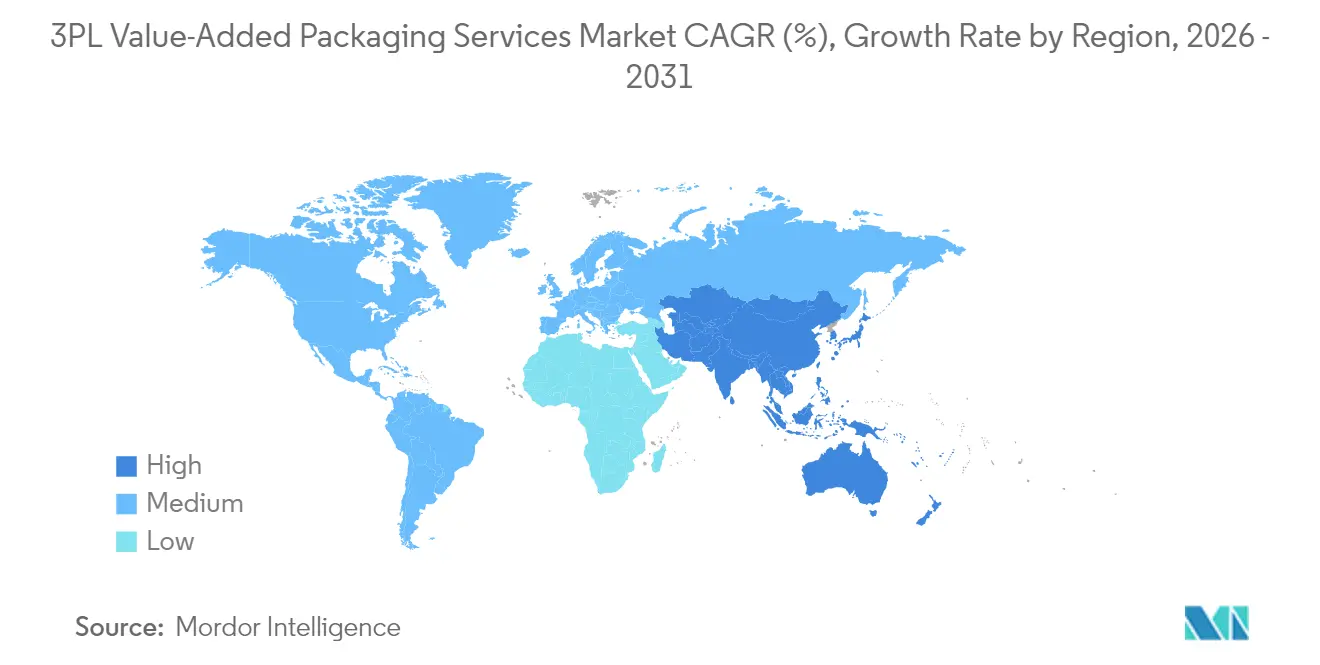
| Fastest Growing Market | Asia Pacific |
| Largest Market | North America |
| Market Concentration | Medium |
Major Players *Disclaimer: Major Players sorted in no particular order Image © Mordor Intelligence. Reuse requires attribution under CC BY 4.0. | |
3PL Value-Added Packaging Services Market Analysis by Mordor Intelligence
The 3PL value-added packaging services market size is expected to grow from USD 30.45 billion in 2025 to USD 32.27 billion in 2026 and is forecast to reach USD 43.09 billion by 2031 at 5.96% CAGR over 2026-2031. Rising demand for late-stage customization, growing e-commerce order complexity, and stricter retail compliance mandates are reshaping service offerings. Brands view postponement strategies as insurance against inventory risk and as a practical way to meet ever-changing packaging requirements. Automated kitting lines, variable data printing, and retail-ready pack expertise now separate premium providers from basic warehousing operators. Regionally, North America leads in market share, but the Asia-Pacific region is accelerating the fastest as manufacturers shift toward near-market packaging. Competitive intensity is moderate because the capital requirements for automated lines and the need for compliance expertise restrain new entrants.
Key Report Takeaways
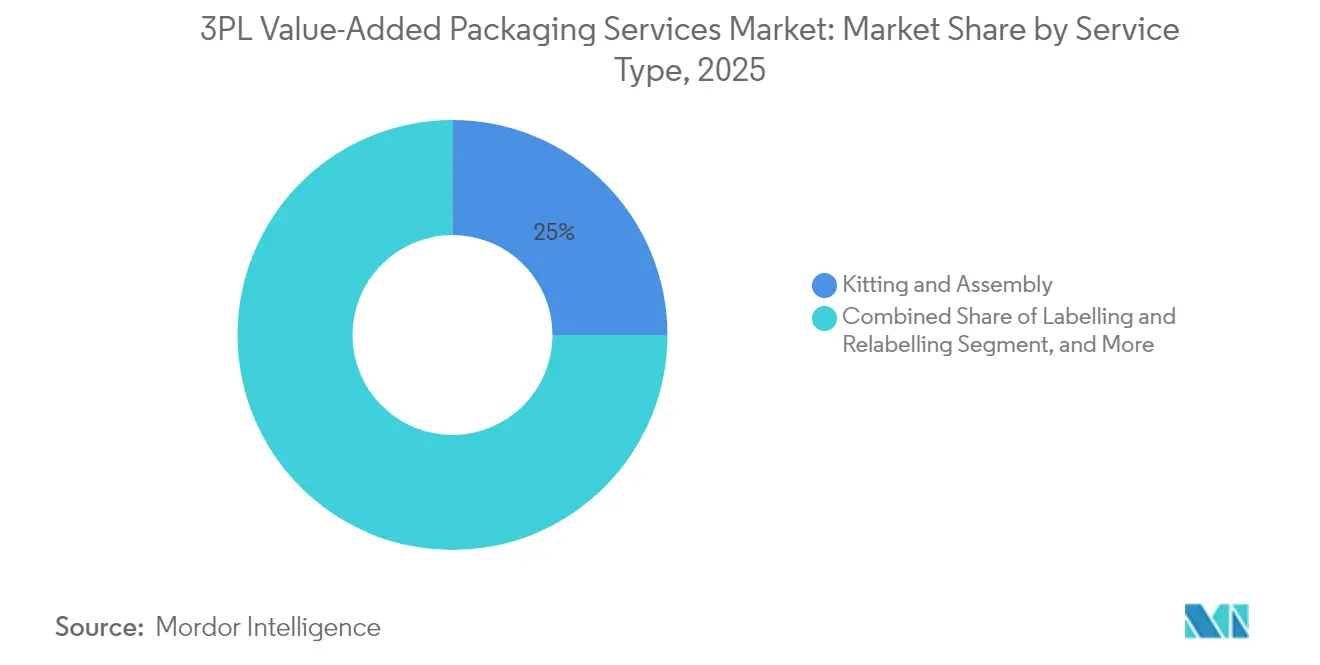
- By service type, kitting and assembly captured 25.02% of the 3PL value-added packaging services market share in 2025.
- By end-user industry, the 3PL value-added packaging services market size for healthcare devices is forecast to advance at an 7.85% CAGR through 2031.
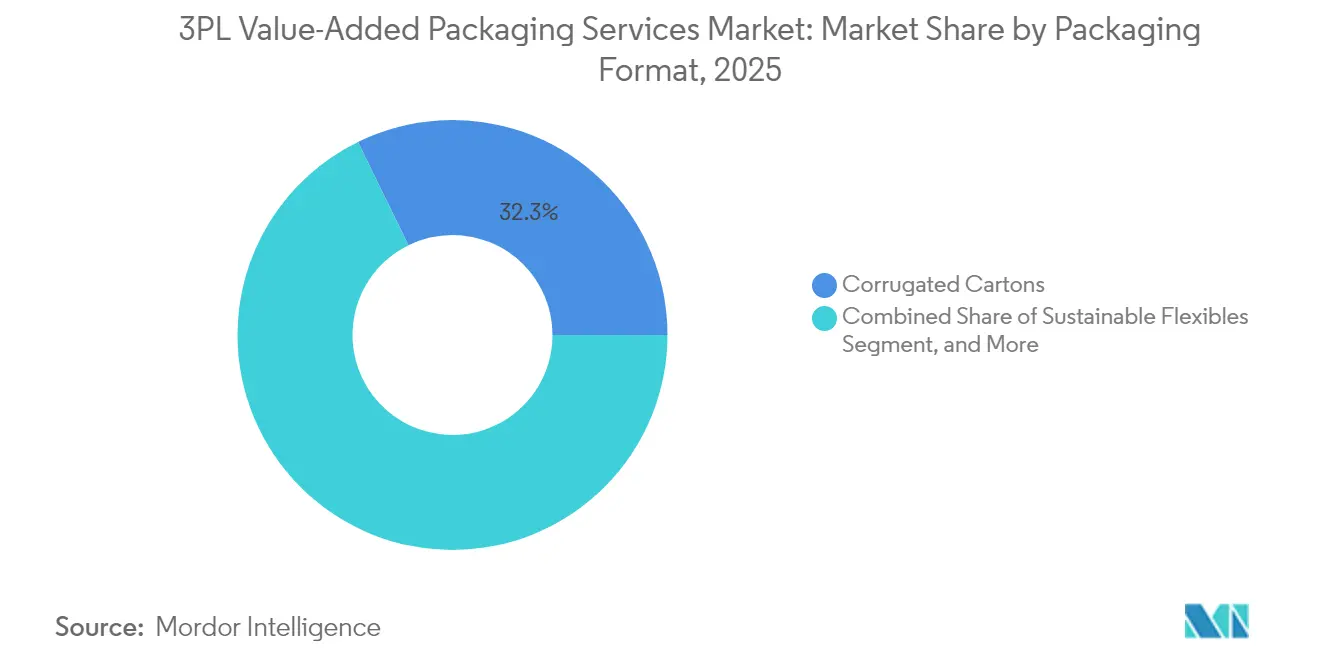
- By packaging format, corrugated cartons captured 32.25% of the 3PL value-added packaging services market share in 2025.
- By geography, the 3PL value-added packaging services market size for Asia-Pacific is forecast to advance at a 7.18% CAGR through 2031.
Note: Market size and forecast figures in this report are generated using Mordor Intelligence’s proprietary estimation framework, updated with the latest available data and insights as of 2026.
Global 3PL Value-Added Packaging Services Market Trends and Insights
Drivers Impact Analysis*
| Driver | (~) % Impact on CAGR Forecast | Geographic Relevance | Impact Timeline |
|---|---|---|---|
| E-Commerce Fulfillment Surge in SKU Complexity | +1.8% | Global, concentrated in North America and Europe | Medium term (2-4 years) |
| Brand Demand for Retail-Ready and Shelf-Ready Packs | +1.5% | North America and Europe, expanding to Asia-Pacific | Short term (≤ 2 years) |
| Sustainability-Linked Packaging Outsourcing Mandates | +1.2% | Europe leading, North America following | Long term (≥ 4 years) |
| Automation of Late-Stage Customization | +0.9% | Developed markets initially, scaling globally | Medium term (2-4 years) |
| Rising Pharma Serialization and Cold-Chain Secondary Packs | +0.7% | Global, regulatory-driven timing varies | Long term (≥ 4 years) |
| Vendor-Managed Inventory Programs in Omnichannel Retail | +0.6% | North America and Europe primarily | Short term (≤ 2 years) |
| Source: Mordor Intelligence | |||
E-Commerce Fulfillment Surge in SKU Complexity
Average SKU counts per e-commerce order have climbed 40% since 2024, pushing traditional pick-pack models beyond their limits.[1]“E-Commerce Complexity Packaging Logistics,” Wall Street Journal, wsj.com 3PLs therefore invest in sophisticated kitting software that selects bundle components in real time, ensuring presentation consistency across fragmented shipments. Dimensional-weight rules from parcel carriers intensify the need for precise cartonization, making right-sizing a revenue-protection lever rather than a cost topic. Amazon’s retail-ready protocols ripple through the sector, compelling line upgrades that can switch between shelf-ready and mail-ready packs without downtime. Providers gaining a head start in algorithm-driven packaging are capturing high-margin accounts as brands seek partners who can protect delivery economics while meeting omnichannel presentation standards.
Brand Demand for Retail-Ready and Shelf-Ready Packs
Major retailers have transformed packaging from a back-room concern into a shelf differentiation tool. Walmart’s sustainability scorecards require demonstrable waste cuts, so 3PLs embed recyclable inserts and optimized die-cuts into routine workflows.[2]“Retailer Packaging Sustainability Requirements,” Reuters, reuters.com Dual-purpose packs capable of surviving a parcel network and delivering visual impact on a display endcap are now baseline expectations. Variable data elements such as QR codes and NFC tags are applied at final assembly, opening revenue streams for providers equipped with on-demand printing. In Europe, Packaging and Packaging Waste Regulation deadlines drive brands to outsource late-stage tasks to specialists that understand cross-border labeling intricacies, vaulting those 3PLs into consultative roles.
Sustainability-Linked Packaging Outsourcing Mandates
Extended Producer Responsibility laws in Europe and emerging carbon-reporting rules worldwide have elevated environmental compliance to board-level priorities. Sixty-seven percent of Fortune 500 companies require quantifiable footprint reductions to be built into logistics contracts. 3PLs respond by installing solar roofs and procuring electric vehicles that power packaging halls. Carbon dashboards consolidate data across hundreds of clients, turning compliance reporting into a differentiator that smaller rivals struggle to match. Circular economy targets further expand scope: providers now manage take-back packaging loops, reintegrating returned materials into new shipments without compromising durability requirements.
Automation of Late-Stage Customization
Artificial-intelligence routers and collaborative robots have enabled late-stage customization to move beyond pilot mode. Inline printers can now lay down full-color graphics and serial numbers during a continuous flow at speeds previously reserved for generic labeling. Predictive maintenance algorithms reduce unplanned downtime, increasing line throughput by 30% and shortening payback periods to the three-year mark. Automated arms handle variable bundles with sub-second cycle times, trimming labor exposure and injury rates. Yet capital hurdles remain steep for mid-tier operators, spurring leasing models and joint ventures between packaging equipment OEMs and logistics firms.
Restraints Impact Analysis*
| Restraint | (~) % Impact on CAGR Forecast | Geographic Relevance | Impact Timeline |
|---|---|---|---|
| Tight Packaging Material Supply Volatility | -1.4% | Global, acute in Asia-Pacific manufacturing hubs | Short term (≤ 2 years) |
| Margin Pressure from Retailer Charge-Backs | -1.1% | North America and Europe primarily | Medium term (2-4 years) |
| High Capex Payback Period for Automated VAP Lines | -0.8% | Developed markets with high labor costs | Long term (≥ 4 years) |
| Regulatory Fragmentation in Extended Producer Responsibility | -0.6% | Europe leading, expanding globally | Long term (≥ 4 years) |
| Source: Mordor Intelligence | |||
Tight Packaging Material Supply Volatility
Quarterly price swings of up to 25% in corrugated prices compress already thin provider margins.[3]“Packaging Materials Supply Chain Volatility,” Wall Street Journal, wsj.com Supplier consolidation reduces negotiation leverage, forcing 3PLs to stockpile inputs and lock working capital. Lead times for specialty substrates range from 2 to 8 weeks, necessitating operational redesign based on availability rather than ideal conditions. Sustainable substrates introduce more variability in strength and printability, prompting additional inspections that slow lines. Regional buffer warehouses mitigate risk yet erode economies of scale.
Margin Pressure from Retailer Charge-Backs
Retailers have escalated fines for package deviations to above 5% of the shipment value and automated enforcement via scan-based checks that leave no room for manual overrides. Providers now juggle more than 200 active spec sheets, each reflecting unique barcode placement rules and branding nuances. Vendor-managed inventory contracts shift compliance risk from retailers to 3PLs, tethering revenue to flawless execution. Even minor misprints therefore wipe out profit on entire orders, intensifying pay-for-performance tension throughout the network.
*Our forecasts treat driver/restraint impacts as directional, not additive. The impact forecasts reflect baseline growth, mix effects, and variable interactions.
Segment Analysis
By Service Type: Assembly Operations Drive Market Leadership
The kitting and assembly segment held 25.02% of 3PL value-added packaging services market share in 2025. Demand stems from brand strategies that defer final product configuration until demand clarity emerges. Providers combine software-guided part picking with semi-automated bundle wraps, enabling on-the-fly changes without line stoppage. Electronics accessories, cosmetics gift sets, and subscription boxes rely on these capabilities. The rise of on-demand personalization boosts the late-stage printing segment, forecasted to grow at a 7.46% CAGR, as pack art and language variants proliferate. Shrink wrapping remains relevant for retail-ready trays that transit directly to shelves, while custom design labs offer prototypes without requiring upfront tooling investments.
Higher unit throughput favors hybrid cells, where collaborative robots handle repetitive tasks and operators manage quality control. Providers who can flex their capacity during seasonal surges command premium fees. Service bundling, including fulfillment and returns management, reduces switching costs for brands and increases the wallet share captured per client. The 3PL value-added packaging services market size for kitting lines is expected to widen as omnichannel retail embeds postponement in its economics model. Meanwhile, reverse logistics repackaging gains traction, driven by escalating e-commerce return rates that exceed 20% of gross merchandise value.


By End-User Industry: Electronics Lead Adoption Amid Healthcare Surge
Consumer electronics held 23.76% of the 3PL value-added packaging services market share in 2025, reflecting complex regional labeling and accessory bundle variations. Chargers, ear-tips, or localized manuals mandate country-specific packs that would be wasteful to pre-assemble at factories. Providers located near consumption nodes apply regulatory labels and promotional stickers just before outbound picks. Medical devices, growing at an 7.85% CAGR, spur specialized serialization and cold-chain secondary packs. Strict validation rules are drawn from ISO-certified cleanrooms and temperature-monitoring inserts.
Food and beverage brands adopt retail-ready trays and seasonal multipacks, although perishability caps dwell time in warehouses. Fashion clients use premium unboxing elements to reinforce brand identity and mitigate return fatigue. Automotive aftermarket firms outsource protective crating for high-value components, leveraging a 3PL's scale to sustain unit cost targets. Across verticals, the 3PL value-added packaging services market is continuing to shift toward sector-specific expertise built on common automation platforms.
By Packaging Format: Corrugated Dominance Faces Sustainable Alternatives
Corrugated cartons delivered a 32.25% revenue share in 2025, as they are suitable for both parcel and shelf presentation. Linerboard grades strike a balance between weight and stacking durability, supporting omnichannel flows. Yet flexible pouches are poised for an 8.11% CAGR, boosted by European regulations that prioritize material reduction. Return-ready mailers are on the rise alongside apparel e-commerce, integrating resealable strips and dual-label zones to streamline reverse logistics.
Providers invest in digital die-cut tables that shorten design cycles and in-house print modules that execute low-run graphics without the need for plates. Blister packs evolve with tamper-evident layers that comply with pharmaceutical track-and-trace regulations. Display-ready packs expand in big-box retail, where instant shelf placement saves labor. The 3PL value-added packaging services market size in flexible formats is expected to increase as circular economy metrics gain prominence in the boardroom.
Geography Analysis
North America controlled 37.82% of global revenue in 2025 thanks to mature e-commerce infrastructures and retailer mandates that integrate packaging specs into supplier scorecards. Providers benefit from numerous automation vendors and financing options that lower the barrier to entry. Labor scarcity further accelerates the adoption of robots, improving cycle consistency and compliance accuracy.
Europe sits on a plateau in terms of share, yet leads in sustainability compliance sophistication. Packaging and Packaging Waste Regulation timelines push brands to externalize multi-country labeling to specialist 3PLs. Providers with multilingual compliance teams and carbon tracing APIs win multi-year framework accords. Costly energy and labor markets heighten the ROI for high-throughput equipment, spurring consolidation among mid-size players.
The Asia-Pacific region is the fastest-growing territory, with a 7.18% CAGR. Manufacturing migration toward Southeast Asia is expected to elevate local demand for late-stage customization. Domestic e-commerce giants in China and India also insist on seller-fulfilled packaging aligned with platform guidelines, driving localized investment. Governments incentivize cold-chain and healthcare logistics, broadening opportunities in medical device packaging. Together, these factors expand the 3PL value-added packaging services market in the region and suggest future leadership potential.
South America, and Middle East, and Africa remain smaller, opportunity-driven arenas where infrastructure gaps temper adoption rates. Brazil’s tax regimes and customs routines create a niche for providers adept at documentation-heavy packaging flows. In Gulf Cooperation Council countries, pharma import rules create demand for off-airport secondary packs to maintain product integrity in extreme climates.

Competitive Landscape
Industry concentration is moderate; automated line costs and compliance know-how deter quick entry but do not give top players overwhelming dominance. Leaders leverage global node networks and continuous investment cycles to shield high-margin contracts. Mid-tier challengers carve out niches in healthcare, sustainability consulting, or reverse logistics personalization. Technology partnerships with equipment OEMs and software firms underpin competitive defense, as proprietary material-routing algorithms and real-time carbon dashboards become table stakes.
Capital intensity triggers alliances: Kuehne and Nagel’s venture with Coesia illustrates how logistics operators plug technology gaps without overextending balance sheets. Patent filings for robotic pick cells and AI cartonization routines have risen 35% since 2024, signaling a race for differentiation. Yet ROI hurdles remain; successful projects often blend bank financing, equipment vendor leasing, and client co-investment. Overall, the 3PL value-added packaging services market rewards scale in compliance management more than mere pallet throughput, steering emphasis toward credentialed staff and audit trails.
Providers monitor retailer charge-back dashboards in real time, integrating alerting into warehouse execution systems. That transparency shifts negotiations from anecdotal blame to data-driven collaboration. Meanwhile, sustainability audits decide contract renewals as much as cost bids. Providers showcasing solar offsets or recycled film pilots report higher win rates among Fortune 500 RFPs.
3PL Value-Added Packaging Services Industry Leaders
DHL Supply Chain (Deutsche Post DHL Group)
GXO Logistics, Inc.
XPO, Inc.
FedEx Supply Chain (FedEx Corporation)
UPS Supply Chain Solutions (United Parcel Service, Inc.)
- *Disclaimer: Major Players sorted in no particular order


Recent Industry Developments
- January 2025: DHL Supply Chain activated an AI cartonization suite in its new Texas facility, raising daily packaging capacity by 60%.
- December 2024: GXO Logistics finalized the integration of PharmaLogistics, adding 12 cold-chain secondary packing sites to its European and North American portfolio.
- November 2024: CEVA Logistics achieved ISO 14001 certification across 18 European packaging centers.
- October 2024: FedEx Supply Chain unveiled a USD 75 million renewable-energy program that powers 25 packaging locations with on-site solar.


Global 3PL Value-Added Packaging Services Market Report Scope
| Kitting and Assembly |
| Labelling and Relabelling |
| Custom Packaging Design and Prototyping |
| Shrink Wrapping and Bundling |
| Late-Stage Personalisation and Variable Data Print |
| Reverse Logistics Re-packaging |
| Palletisation and Stretch Wrap |
| Consumer Electronics |
| Food and Beverage |
| Pharmaceuticals |
| Medical Devices |
| Fashion and Apparel |
| Cosmetics and Personal Care |
| Automotive and Industrial |
| Other End-user Industries |
| Corrugated Cartons |
| Folding Cartons |
| Blister Packs and Clamshells |
| Flexible Pouches and Bags |
| Shrink Wrap Bundles |
| Return-ready Mailers |
| Display-ready Packs |
| Palletised Loads |
| North America | United States | |
| Canada | ||
| Mexico | ||
| South America | Brazil | |
| Argentina | ||
| Rest of South America | ||
| Europe | Germany | |
| United Kingdom | ||
| France | ||
| Italy | ||
| Spain | ||
| Russia | ||
| Rest of Europe | ||
| Asia-Pacific | China | |
| Japan | ||
| India | ||
| South Korea | ||
| South-East Asia | ||
| Rest of Asia-Pacific | ||
| Middle East and Africa | Middle East | Saudi Arabia |
| United Arab Emirates | ||
| Turkey | ||
| Rest of Middle East | ||
| Africa | South Africa | |
| Nigeria | ||
| Rest of Africa | ||
| By Service Type | Kitting and Assembly | ||
| Labelling and Relabelling | |||
| Custom Packaging Design and Prototyping | |||
| Shrink Wrapping and Bundling | |||
| Late-Stage Personalisation and Variable Data Print | |||
| Reverse Logistics Re-packaging | |||
| Palletisation and Stretch Wrap | |||
| By End-user Industry | Consumer Electronics | ||
| Food and Beverage | |||
| Pharmaceuticals | |||
| Medical Devices | |||
| Fashion and Apparel | |||
| Cosmetics and Personal Care | |||
| Automotive and Industrial | |||
| Other End-user Industries | |||
| By Packaging Format | Corrugated Cartons | ||
| Folding Cartons | |||
| Blister Packs and Clamshells | |||
| Flexible Pouches and Bags | |||
| Shrink Wrap Bundles | |||
| Return-ready Mailers | |||
| Display-ready Packs | |||
| Palletised Loads | |||
| By Geography | North America | United States | |
| Canada | |||
| Mexico | |||
| South America | Brazil | ||
| Argentina | |||
| Rest of South America | |||
| Europe | Germany | ||
| United Kingdom | |||
| France | |||
| Italy | |||
| Spain | |||
| Russia | |||
| Rest of Europe | |||
| Asia-Pacific | China | ||
| Japan | |||
| India | |||
| South Korea | |||
| South-East Asia | |||
| Rest of Asia-Pacific | |||
| Middle East and Africa | Middle East | Saudi Arabia | |
| United Arab Emirates | |||
| Turkey | |||
| Rest of Middle East | |||
| Africa | South Africa | ||
| Nigeria | |||
| Rest of Africa | |||


Key Questions Answered in the Report
How large is the 3PL value-added packaging services market in 2026?
It stands at USD 32.27 billion in 2026, with forecasts indicating continued expansion.
Which service type currently generates the highest revenue?
Kitting and assembly holds the leading 25.02% share, thanks to e-commerce bundle demand.
Which region is growing the fastest for value-added packaging?
Asia-Pacific shows the quickest pace, projected at 7.18% CAGR through 2031.
What is driving late-stage personalization demand?
Brands need mass customization and on-demand variable data printing to meet omnichannel expectations.
Why are medical devices a growth vertical?
Serialization mandates and cold-chain secondary packaging requirements push device makers toward specialized 3PL partners.
Page last updated on:


