
Republic Of Ireland Renewable Energy Market Size and Share
Market Overview
| Study Period | 2021 - 2031 |
|---|---|
| Forecast Data Period | 2026 - 2031 |
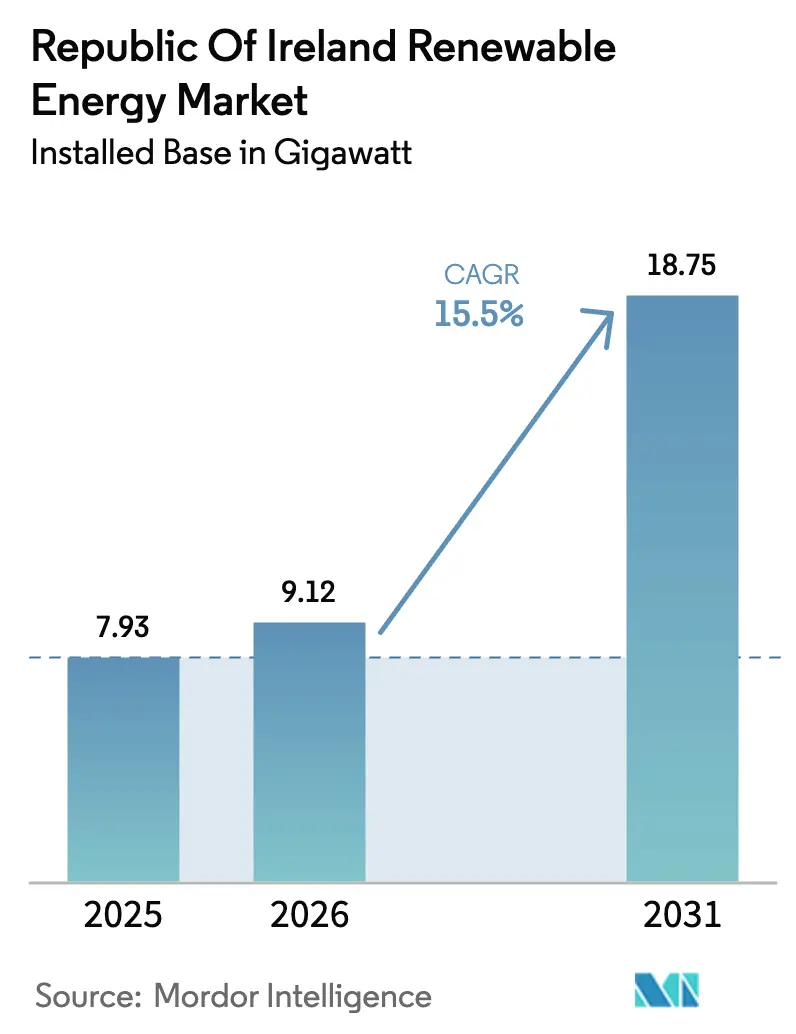
| Base Year Market Size (2025) | 7.93 gigawatt |
| Market Volume (2026) | 9.12 gigawatt |
| Market Volume (2031) | 18.75 gigawatt |
| Growth Rate (2026 - 2031) | 15.50 % |
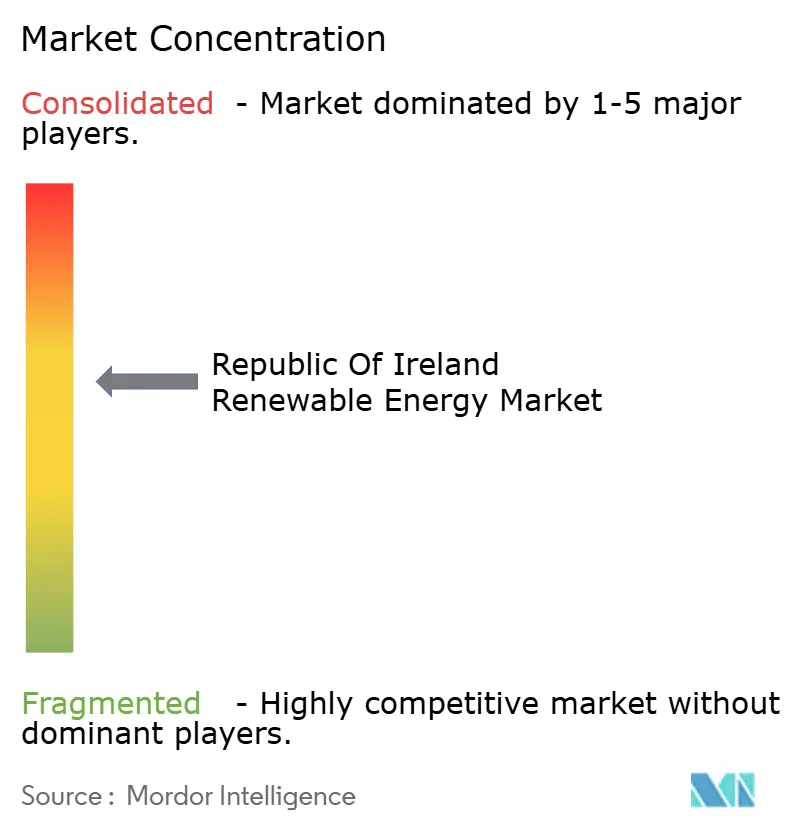
| Market Concentration | Medium |
Major Players *Disclaimer: Major Players sorted in no particular order Image © Mordor Intelligence. Reuse requires attribution under CC BY 4.0. | |
Republic Of Ireland Renewable Energy Market Analysis by Mordor Intelligence
The Republic Of Ireland Renewable Energy Market size in terms of installed base is expected to grow from 7.93 gigawatt in 2025 to 9.12 gigawatt in 2026 and is forecast to reach 18.75 gigawatt by 2031 at 15.5% CAGR over 2026-2031.
This trajectory reflects an economy-wide shift away from fossil fuel reliance, with auction-backed offshore wind, utility-scale solar under corporate PPAs, and accelerating residential rooftop adoption driving new capacity additions. Falling onshore wind strike prices, a 72 MW hyperscale solar PPA benchmark below EUR 60 per MWh, and a 7 GW offshore pipeline slated for 2028-2031 further underscore the Republic of Ireland renewable energy market’s structural momentum. Grid investments prioritized for hydrogen-ready transmission corridors, port upgrades along the South Coast, and data-center co-located renewables are reshaping project economics, while curtailment in congested coastal nodes and planning bottlenecks remain headwinds.
Key Report Takeaways
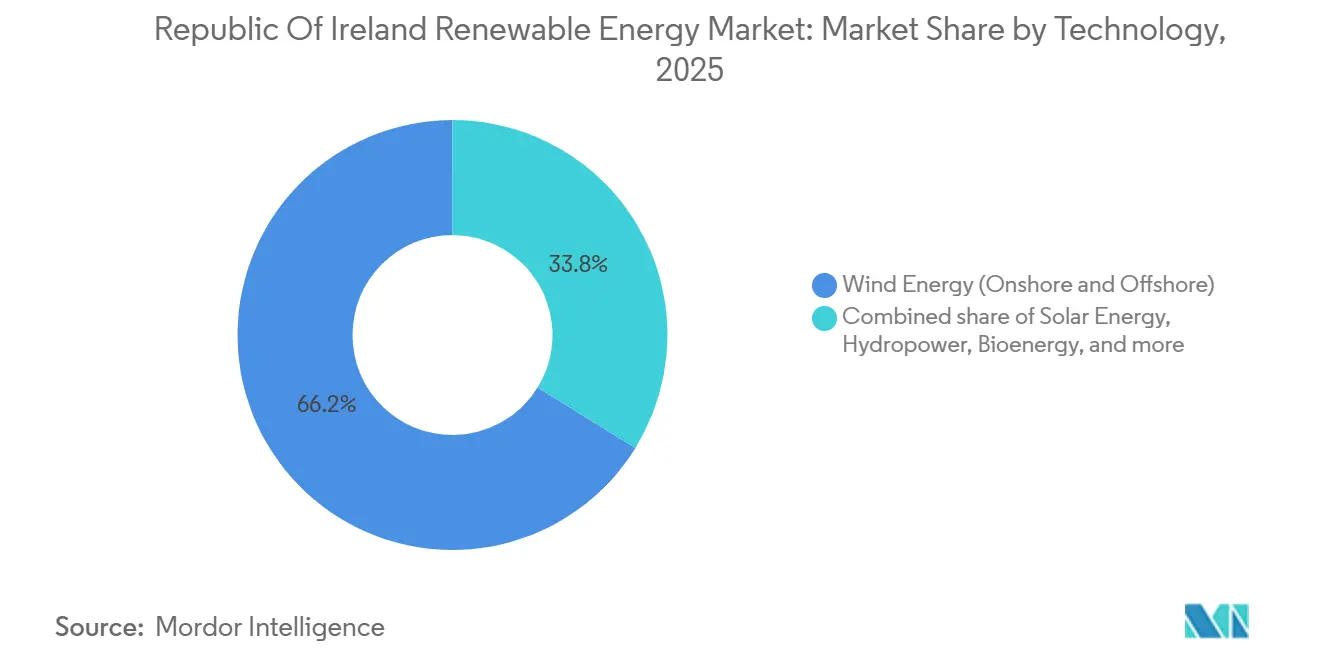
- By technology, wind energy held 66.2% of the Republic of Ireland's renewable energy market share in 2025, and bioenergy is projected to expand at a 90.4% CAGR through 2031.
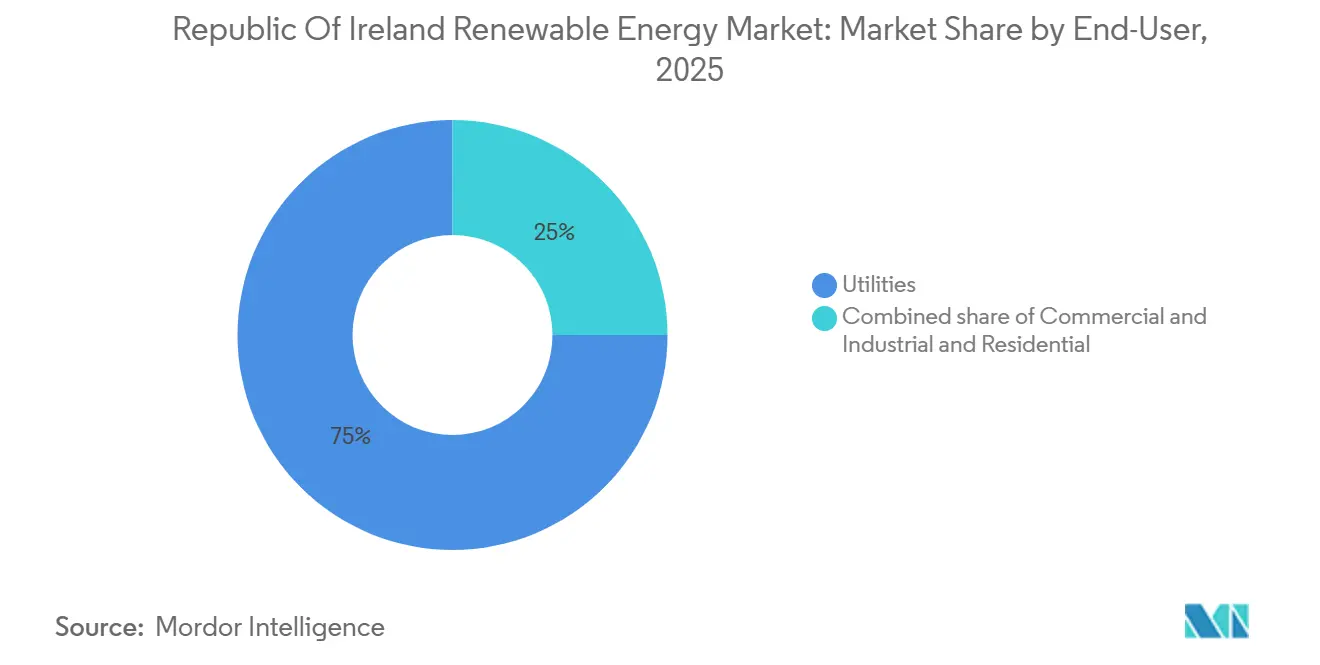
- By end-user, utilities controlled 75% of installed capacity in 2025, whereas residential solar is forecast to grow at a 25.4% CAGR to 2031.
Note: Market size and forecast figures in this report are generated using Mordor Intelligence’s proprietary estimation framework, updated with the latest available data and insights as of January 2026.
Republic Of Ireland Renewable Energy Market Trends and Insights
Drivers Impact Analysis*
| Driver | (~) % Impact on CAGR Forecast | Geographic Relevance | Impact Timeline |
|---|---|---|---|
| Accelerated Offshore-Wind Leasing in Celtic & Irish Seas | 4.2% | National, with concentration in South & East coasts | Long term (≥ 4 years) |
| Government-Backed RESS Auctions | 3.8% | National, early gains in Munster & Connacht | Medium term (2-4 years) |
| Corporate PPAs Driving Utility-Scale Solar Build-out | 2.6% | National, Leinster & Munster lead | Short term (≤ 2 years) |
| Hydrogen-Ready Transmission Grid Investments | 1.9% | National, priority corridors in East & South | Long term (≥ 4 years) |
| Repowering of Ageing Onshore Wind Fleet | 1.7% | National, legacy sites in West & Midlands | Medium term (2-4 years) |
| Data-Centre Energy Demand Growth in Leinster | 1.3% | Leinster, spillover to adjacent counties | Short term (≤ 2 years) |
| Source: Mordor Intelligence | |||
Accelerated Offshore-Wind Leasing in Celtic & Irish Seas
Ireland’s offshore pipeline reached 7 GW in 2025, split between fixed-bottom projects in the Irish Sea and floating arrays in the Atlantic. The inaugural 900 MW Tonn Nua auction in 2024 cleared at EUR 150 per MWh, reflecting higher costs for first-of-kind floating platforms. Ørsted’s 800 MW Clogher Head scheme adds a 200 MW electrolyzer, converting surplus output into green hydrogen for industrial buyers.[1]Ørsted A/S, “Clogher Head Offshore Wind Project Overview,” ØRSTED.COM, orsted.com Cross-border links to the United Kingdom’s 4.5 GW Celtic Sea leases create export optionality, yet seabed-mapping delays have postponed 1.2 GW of Irish projects. Supply-chain tightness for dynamic cables could push several floating arrays beyond 2030.
Government-Backed RESS Auctions
RESS 3-5 allocated 2.9 GW in 2024-2025, with onshore wind securing 68% and solar 22%. Onshore wind strike prices fell 12% between RESS 3 and RESS 4 to EUR 72.58 per MWh, signaling efficiency gains and cheaper project finance. Battery-paired hybrids captured 180 MW in RESS 5, demonstrating policy support for firm-capacity solutions. Sub-5 MW Small-Scale RESS awards to rooftops reduce reliance on congested distribution networks. However, grid connection delays of up to 24 months remain a binding constraint on projects awarded in RESS 3.
Corporate PPAs Driving Utility-Scale Solar Build-out
Hyperscale companies executed 450 MW of solar PPAs in 2024-2025, with Microsoft’s 72 MW Lenalea contract setting a sub-EUR 60 per MWh benchmark.[2]Microsoft Corporation, “Microsoft Signs Irish Renewable PPA,” MICROSOFT.COM, microsoft.com Merchant developers now deploy bifacial modules and single-axis trackers that improve yields by over 12%. Lightsource BP, BayWa r.e., and others are lining up 320 MW for 2026-2027, although land-use objections continue to slow planning approvals. Corporate procurement is therefore reshaping the Republic of Ireland renewable energy market by creating a pricing gap between hyperscale buyers and smaller off-takers still reliant on RESS.
Hydrogen-Ready Transmission Grid Investments
EirGrid’s EUR 1.2 billion upgrade plan channels capital to reinforce the East-West interconnector and build hydrogen-capable substations. Priority corridors in Leinster and Munster will enable the 7 GW offshore pipeline to connect without triggering curtailment once assets go live after 2028. Interim, storage-linked hybrids and synchronous condensers mitigate frequency deviations. Transmission readiness is pivotal for unlocking green hydrogen hubs along the South Coast and feeding data-center loads.
Restraints Impact Analysis*
| Restraint | (~) % Impact on CAGR Forecast | Geographic Relevance | Impact Timeline |
|---|---|---|---|
| Grid Congestion in South-West & West Coastal Nodes | -2.4% | Munster & Connacht, coastal counties | Medium term (2-4 years) |
| Slow Planning Approval Processes for Large-Scale Projects | -1.8% | National, acute in rural counties | Short term (≤ 2 years) |
| Rising CAPEX due to Local Content & Inflationary Pressures | -1.5% | National, offshore wind and floating platforms most affected | Medium term (2-4 years) |
| Limited Pumped-Storage & Long-Duration Storage Options | -1.2% | National, critical for Leinster & Munster offshore wind integration | Long term (≥ 4 years) |
| Source: Mordor Intelligence | |||
Grid Congestion in South-West & West Coastal Nodes
Curtailment exceeded 11% of available wind output in 2024 as 110 kV lines from Munster struggled to evacuate coastal production. The North-South Interconnector, delayed to 2028, leaves developers dependent on localized batteries such as ESB’s 100 MW Aghada site that absorbs excess generation but only for two-hour windows. Capital is shifting toward inland sites or to floating offshore projects positioned closer to load centers.
Slow Planning Approval Processes for Large-Scale Projects
An Bord Pleanála stretched average consent timelines for >50 MW projects to 22 months in 2025 amid heavier public consultations.[3]An Bord Pleanála, “Strategic Infrastructure Consent Statistics,” PLEANALA.IE, pleanala.ie Simply Blue Group’s Emerald floating wind timetable slipped a year after additional bird-migration studies. Developers now pre-file environmental data and community benefit plans, adding EUR 2-5 million in soft costs and compressing margins on marginal sites.
*Our forecasts treat driver/restraint impacts as directional, not additive. The impact forecasts reflect baseline growth, mix effects, and variable interactions.
Segment Analysis
By Technology: Wind Dominance Meets Bioenergy Surge
Wind energy captured 66.2% of installed capacity in 2025, and repowering projects such as SSE's 105 MW Galway upgrade lifted onshore output without expanding footprints.[4]SSE Renewables, “Galway Wind Park Repowering,” SSERENEWABLES.COM, sserenewables.com The Republic of Ireland's renewable energy market size for onshore wind is projected to reach 9.3 GW by 2031 at a 9.4% CAGR, while a 4.2 GW fixed-bottom and 2.8 GW floating offshore pipeline positions the segment for 22.1% annual growth. Bioenergy capacity, anchored by 18 new anaerobic digestion facilities, is rising at a 90.4% CAGR, reflecting dispatchable generation demand that complements intermittent wind and solar. Small hydropower remains capped at 240 MW, though ESB's 300 MW Turlough Hill expansion would double long-duration storage when commissioned in 2030.
Solar's corporate-driven build-out totals 720 MW installed or under construction, and the Republic of Ireland renewable energy market size for solar is forecast to double between 2026 and 2031. Ocean energy retains pilot status; DP Energy's 5 MW wave project relies on EU Innovation Fund support to bring levelized costs below EUR 150 per MWh by decade's end. Technology diversification is therefore broadening the Republic of Ireland's renewable energy market beyond its historic wind focus.



By End-User: Utilities Lead, Residential Accelerates
Utilities owned 75% of capacity in 2025, yet households are closing the gap as Microgeneration Support Scheme feed-in tariffs shorten rooftop solar paybacks to under nine years. Residential installations doubled to 8,200 in 2024, and the segment is set to log a 25.4% CAGR to 2031, driven by high retail tariffs averaging EUR 0.32 per kWh. Commercial and industrial players are hedging power costs through behind-the-meter assets, exemplified by Kerry Group's 12 MW solar system meeting 18% of factory demand.
Utilities are pivoting to hybrid assets that satisfy EirGrid's firm-capacity rules. Energia's 50 MW Castlepook wind-plus-battery plant demonstrates how pairing 20 MW of storage secures priority dispatch. By 2031, hybrid configurations could carry 12% of the Republic of Ireland's renewable energy market share, further diluting the traditional dominance of stand-alone wind farms.
Geography Analysis
Leinster, Munster, and Connacht account for 92% of projected capacity additions through 2031. Leinster remains the largest consumer due to data-center concentration, yet a 2024 connection moratorium is redirecting new projects to Munster. The Republic of Ireland renewable energy market size for Munster is forecast to exceed 6 GW by 2031 on the back of a 3.2 GW offshore pipeline and bioenergy build-out tied to dairy agriculture.
Connacht hosts 1.2 GW of operating onshore wind but suffers 14% curtailment pending the 400 kV North-South Interconnector in 2028. Ulster’s cross-border links allow power exports to Northern Ireland, though dual planning regimes add up to nine months to project approvals. Upgraded ports at Cork, Waterford, and Shannon Foynes command EUR 450 million in investment, placing the South Coast at the center of floating offshore assembly.
Data-center developers are installing 420 MW of co-located renewables across Dublin, Meath, and Kildare, yet grid upgrades worth EUR 800 million will not be operational until 2028. Inland counties with strong wind resources remain underdeveloped, confirming that transmission readiness, not resource quality, will shape the next wave of the Republic of Ireland renewable energy market.
Regulatory Landscape
Ireland's renewable build-out is anchored by the Renewable Electricity Support Scheme (RESS), which has awarded 2.9 GW across RESS 3-5 during 2024-2025, alongside faster route-to-market options such as corporate PPAs. On the network side, the Commission for Regulation of Utilities (CRU) advanced Price Review Six (PR6), approving up to EUR 18.9 billion of electricity grid and network investment for 2026-2030. This aligns regulated spending with renewable integration and system resilience requirements.
Permitting and grid connection rules are tightening around EU Renewable Energy Directive implementation. The European Union (Planning and Development) (Renewable Energy) Regulations 2025 (S.I. 274 of 2025) introduced RED III-aligned measures such as permit-granting timelines and environmental screening procedures. The 2026 amending instrument (S.I. 185 of 2026, signed 29 April 2026) then adjusted commencement dates for certain procedures to 1 November 2026. Separately, S.I. 161 of 2026 put in place measures intended to reduce barriers to renewable electricity supply, including provisions relevant to renewable PPAs and enabling infrastructure across transmission, distribution, and storage.
Competitive Landscape
The five largest players, SSE Renewables, ESB, Energia, Ørsted, and Mainstream Renewable Power, account for 58% of installed capacity, reflecting moderate concentration. Incumbents exploit balance-sheet strength to dominate RESS allocations, while new entrants target niches such as floating offshore wind or wave energy. Greencoat Renewables and Brookfield grow through asset acquisitions, with Greencoat’s EUR 180 million purchase of 120 MW in 2024 widening its portfolio to 580 MW.
Technology advances are redrawing cost curves: Vestas V162-6.2 MW turbines in SSE’s Galway repowering deliver 22% higher capacity factors than legacy units, and bifacial solar modules at Lightsource BP’s 85 MW Milltown site lift yields by 14%. Compliance with EirGrid’s DS3 grid-support rules favors projects integrating synchronous condensers or grid-forming inverters, elevating technically sophisticated developers.
Hybrid projects that monetize curtailed output via batteries or hydrogen electrolysis illustrate strategic diversification: Energia’s Castlepook and Ørsted’s Clogher Head electrolyzer exemplify how developers convert surplus energy into new revenue streams. As floating offshore, agrivoltaics, and hydrogen hubs mature, competitive intensity in the Republic of Ireland renewable energy market is set to rise.
Republic Of Ireland Renewable Energy Industry Leaders
ESB Generation & Trading
SSE Renewables
Statkraft Ireland Ltd
Energia Group
Greencoat Renewables plc
- *Disclaimer: Major Players sorted in no particular order

Market Opportunities and Future Outlook
Grid and enabling-infrastructure execution appears to be the clearest whitespace for moving additional renewable capacity from pipeline to operation, given documented congestion and curtailment challenges in coastal nodes. Ireland has also formalized major network investment signals through the National Development Plan 2026-2030, including EUR 3.5 billion for electricity infrastructure (EUR 1.5 billion for ESB Networks and EUR 2.0 billion for EirGrid). CRU's PR6 framework underpins a broader 2026-2030 investment envelope (up to EUR 18.9 billion) for the electricity grid and network. Together, these programs create near-term opportunities for developers and OEMs in grid-forming inverters, synchronous condensers, and storage-linked hybridization that address curtailment and connection constraints.
Offshore wind and corporate-led solar procurement continue to open scalable routes to market, while regulatory and planning reforms are intended to reduce cycle times. The offshore opportunity is supported by government actions such as Budget 2026 allocating EUR 8 million for an offshore site surveying program to de-risk future ORESS auctions, alongside the broader policy framework for offshore renewable energy and plan-led maritime spatial planning. Corporate procurement remains a visible commercial driver, including 450 MW of solar PPAs executed in 2024-2025 and a hyperscale benchmark set by Microsoft's 72 MW Lenalea solar PPA at below EUR 60 per MWh. This supports continued demand for utility-scale solar and co-located storage where grid access can be secured. Market participants also have a clearer legislative runway for alternative connection models through the Private Wires policy, and the government's approval to draft the Private Wires Bill (2026), which targets private investment pathways for generation and storage infrastructure serving large energy users.
Recent Industry Developments
- July 2026: Energy Dome announced a commercial contract with Google to build a 23 MW/200 MWh carbon-based battery project in Ireland. The company said the project had secured land, planning consent, and a 10-year capacity contract from EirGrid, strengthening the investment case for long-duration storage that can firm variable renewables and reduce curtailment exposure.
- November 2025: ESB and Orsted said their joint venture won provisional rights to develop the 900 MW Tonn Nua offshore wind site off County Waterford in an offshore wind auction. The award advances a large-scale offshore project through the development pipeline and signals continued competitive interest in Irish offshore wind despite cost and permitting complexity.
- October 2025: SSE Renewables completed and powered up the 101 MW Yellow River Wind Farm in Rhode, County Offaly. The commissioning expanded SSE Renewables' operational onshore wind base in Ireland and added incremental generation in a market where repowering and new-build onshore projects remain central to near-term capacity additions.


Research Methodology Framework and Report Scope
Market Definition and Coverage
In this study, the market is defined as renewable electricity generation capacity installed in the Republic of Ireland, tracked in gigawatts across major renewable technologies that connect to the grid or are formally recognized under national schemes.
Scope exclusions: We exclude unregistered microgeneration that does not show up in national statistics, and we also exclude renewable certificate trading and energy-from-waste incineration revenues.
Segmentation Overview
- By Technology
- Solar Energy (PV and CSP)
- Wind Energy (Onshore and Offshore)
- Hydropower (Small, Large, PSH)
- Bioenergy
- Geothermal
- Ocean Energy (Tidal and Wave)
- By End-User
- Utilities
- Commercial and Industrial
- Residential
Data Sources, Market Sizing, and Validation
Desk Research
Desk research was used to build the base data series for installed capacity, additions, and retirements by technology, and then to align it with national targets and grid realities. We relied on public sources such as SEAI statistics and energy balances, EirGrid connection and grid development publications, CRU regulatory updates, and Eurostat electricity and renewables datasets.
Along with these, we checked policy and tender signals through government releases on auctions and support schemes, then cross-checked with developer announcements, planning documents, and company filings where available. For specific clarifications, we also referenced paid subscriptions that help with company financials and intelligence, news and financials, patent databases, and tender and contracts tracking, which supported timeline checks and commissioning patterns. The desk sources listed here are illustrative only, and many other public references were reviewed to collect data points, validate assumptions, and clarify gaps.
Primary Interviews and Surveys
We use interviews and surveys with Irish project developers, utilities, equipment suppliers, grid specialists, regulators, and energy buyers. Respondents help clarify commissioning dates, auction pricing, connection delays, utilization, and project assumptions that Ireland's public data does not fully explain.
Distribution of primary research fieldwork respondents
| Company type | Respondent position |
|---|---|
| Top tier: 25% | CXOs: 20% |
| Mid tier: 55% | Functional/Unit leaders: 30% |
| Smaller Players: 20% | Managers: 50% |
Market-Sizing & Forecasting
Sizing was built using top-down reconstruction from technology-wise installed capacity records and planned additions, then converted into a consistent yearly series for the country. We corroborated the totals with selective bottom-up checks, including sampled project pipelines, typical commissioning schedules, and channel checks on equipment delivery timing where it could be reasonably verified.
Key inputs in the model include annual capacity additions and retirements, grid connection queue and constraint signals, auction award volumes and delivery timelines, typical capacity factors by technology, and policy targets that affect build-out pace. Because timing matters a lot in renewables, the model also uses construction lead times, repowering cycles for older assets, and the split between utility-scale versus accredited behind-the-meter capacity when it appears in national statistics.
Forecasting uses scenario analysis supported by trend smoothing for the historical series, with scenarios anchored to auction cadence, grid readiness, and expected project completion rates discussed by interviewees. Where project-level detail was incomplete, gaps were handled by applying conservative completion ratios to the visible pipeline and then rebalancing the outlook to match realistic grid and policy constraints.
Data Validation & Update Cycle
Validation is done in layers so the final numbers do not rely on any single dataset. Outputs are compared against independent signals such as national installed capacity reporting, auction award lists, grid connection updates, and observed year-over-year build patterns, then exceptions are reviewed before sign-off.
If a variance is large, we revisit the assumptions behind commissioning timing, retirements, or technology scope, and when needed we re-contact the relevant experts to confirm what changed. Reports are refreshed annually, with interim updates when a material policy shift, auction outcome, or grid development event is likely to move the forecast, and a final pre-delivery pass is completed so clients receive the most current view.
Mordor Intelligence's Republic of Ireland Renewable Energy Market Estimate Compared With Other Published Estimates
Published estimates for Ireland renewables often do not match because different teams measure different variables, and they also update their assumptions at different times. Some sources report installed capacity in GW, while others convert the sector into revenue using equipment prices, project costs, or broader energy transition spending, which can shift values even when the physical build is similar.
In this report, update timing is treated as a sizing variable, since late-year commissioning changes, FX snapshots, and assumed price per MW can all move the result even if physical capacity stays the same. This refresh-led discipline is also why the GW-based series stays stable under the checks applied by Mordor Intelligence.
Benchmark comparison
| Source | Market Size | Gaps in Research Methodology |
|---|---|---|
| Mordor Intelligence | USD 7.93 B (2025) | |
| Regional Consultancy A | USD 3.90 B (2023) | Values the market in USD revenue terms and uses a 2023 base year, so results depend on capex and pricing assumptions rather than installed capacity, and the time-of-update can miss late commissioning changes. |
| Industry Publisher B | USD 14.90 B (2023) | Uses a broader value framing with longer-horizon growth and different base-year settings, which can mix technology scope and currency timing, thereby inflating figures versus a capacity-tracked boundary. |
The table mainly shows a unit and scope mismatch, since the GW-based estimate tracks physical build-out while the other two figures represent monetized interpretations tied to pricing and modeling choices. When scope is kept consistent and the refresh cadence aligns to commissioning and policy events, the range narrows and the market view becomes easier to replicate year to year.


Key Questions Answered in the Report
How large is the Republic of Ireland renewable energy market in 2026?
Installed capacity reaches 9.12 GW in 2026, and it is forecast to double to 18.75 GW by 2031.
Which technology leads new capacity additions over 2026-2031?
Offshore wind anchors growth with a 7 GW pipeline, supported by fixed-bottom and floating projects scheduled for 2028-2031.
What support scheme underpins most new projects?
The Renewable Electricity Support Scheme (RESS) awarded 2.9 GW in auctions 3-5 during 2024-2025, providing 15-year fixed-price contracts to winners.
Why are corporate PPAs important in Ireland?
Hyperscale buyers signed 450 MW of solar PPAs in 2024-2025, setting price benchmarks below RESS levels and accelerating merchant solar economics.
What is the key grid challenge facing developers?
Congestion in South-West and West coastal nodes causes curtailment exceeding 11% of wind output, pending major transmission upgrades due by 2028.
How fast is residential solar growing?
Shipments doubled in 2024, and residential rooftop capacity is projected to grow at a 25.4% CAGR through 2031 under the Microgeneration Support Scheme.
Page last updated on:


 Your data is secure and never sold or shared.


