Market Overview
| Study Period | 2021 - 2031 |
|---|---|
| Forecast Data Period | 2026 - 2031 |
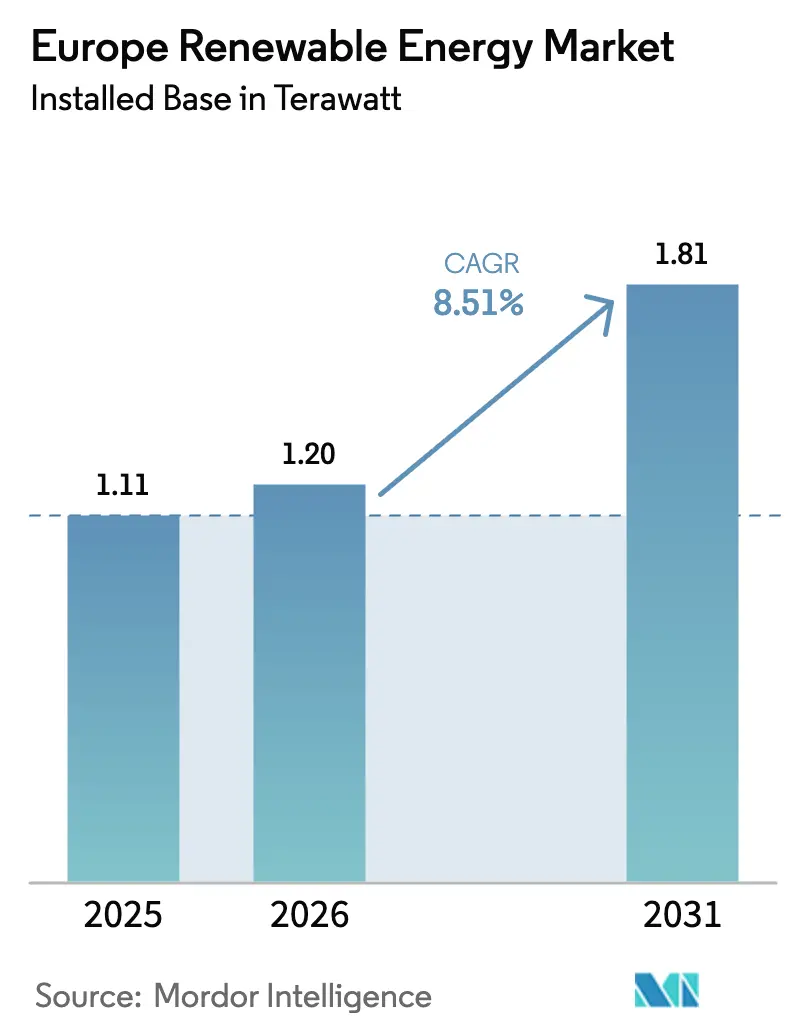
| Base Year Market Size (2025) | 1.11 Terawatt |
| Market Volume (2026) | 1.20 Terawatt |
| Market Volume (2031) | 1.81 Terawatt |
| Growth Rate (2026 - 2031) | 8.51% CAGR |
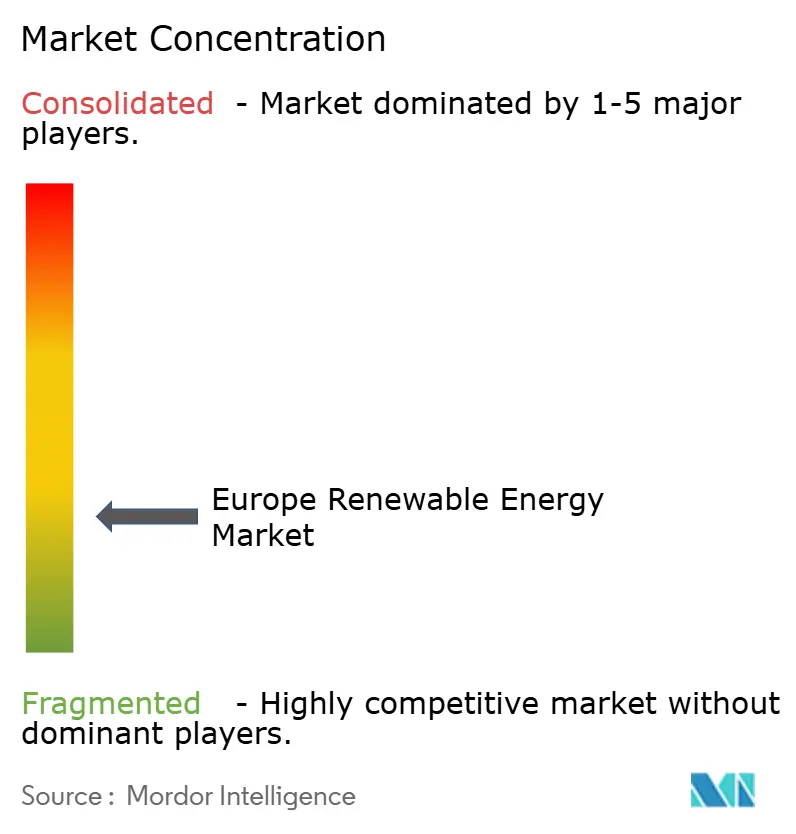
| Market Concentration | Low |
Major Players *Disclaimer: Major Players sorted in no particular order Image © Mordor Intelligence. Reuse requires attribution under CC BY 4.0. | |
Europe Renewable Energy Market Analysis by Mordor Intelligence
The Europe Renewable Energy Market size in terms of installed base is expected to grow from 1.11 Terawatt in 2025 to 1.20 Terawatt in 2026 and is forecast to reach 1.81 Terawatt by 2031 at 8.51% CAGR over 2026-2031.
The robust trajectory is propelled by the EU’s REPowerEU requirement to cover 45% of final energy demand with renewables by 2030, the EU-ETS carbon allowance price that passed EUR 80 per tonne in early 2025, and ever-cheaper solar and onshore-wind LCOE that outcompetes new gas capacity in most hours. Offshore-wind auction volumes, green-hydrogen quotas, and corporate PPAs from hyperscale data-center and steel producers are pulling projects forward, shrinking development lead times, and intensifying competition for grid-connection slots. Hybrid plants that co-locate wind, solar, and batteries already supply 12% of new builds and lower LCOE by 20-30% versus standalone assets. The European renewable energy market benefits from integrated utilities bundling generation, storage, and retail; yet margin compression in turbine manufacturing is triggering strategic pivots toward long-term service contracts and digital-twin analytics.
Key Report Takeaways
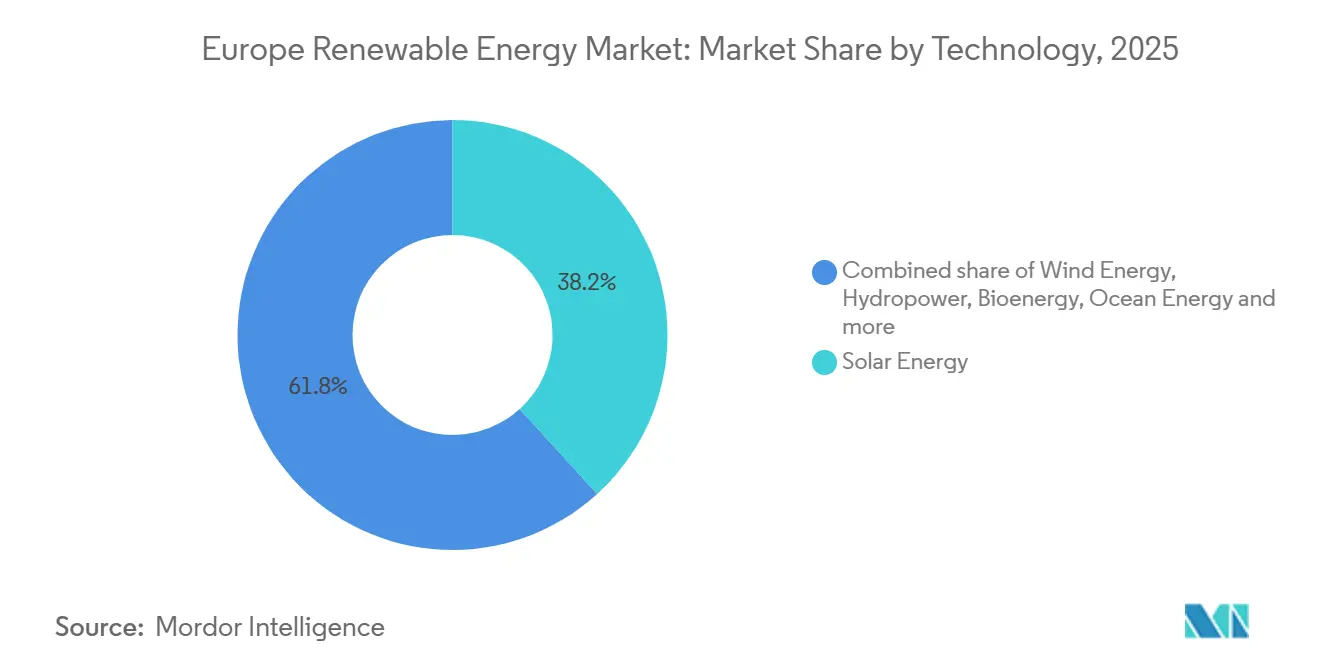
- By technology, solar commanded 38.24% of Europe's renewable energy market share in 2025. Ocean energy is projected to expand at a 31.83% CAGR through 2031.
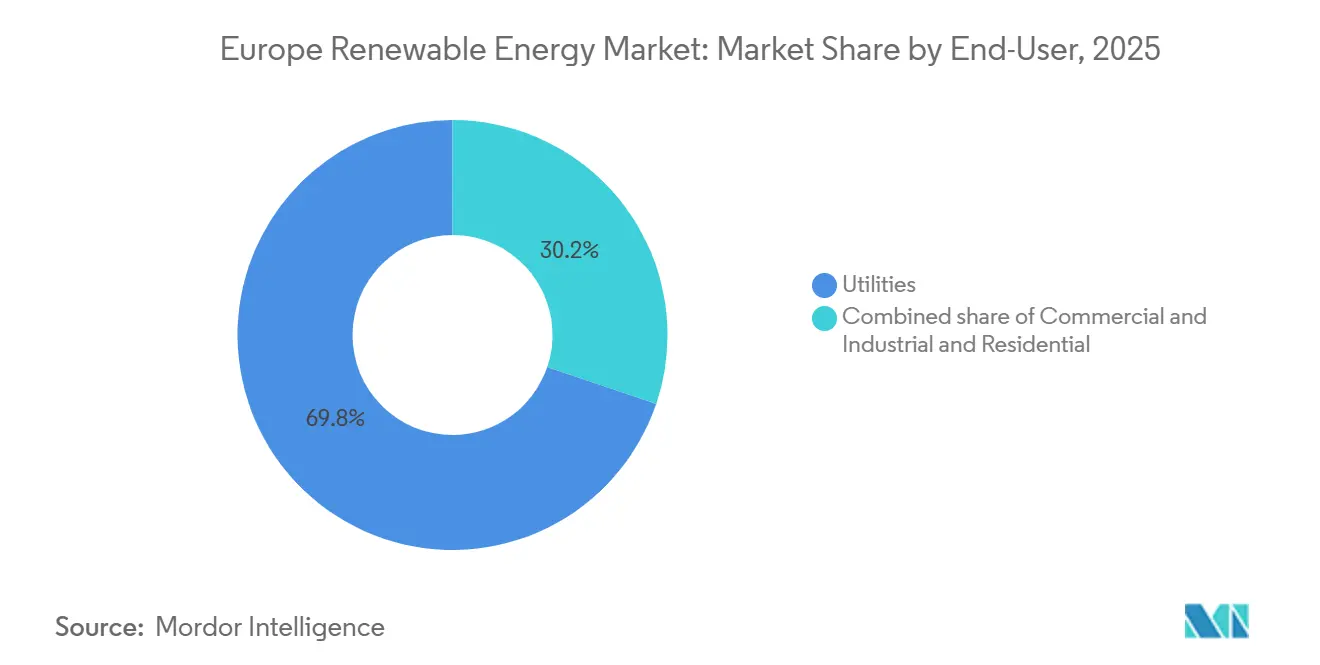
- By end-user, utilities led with 69.81% share of the European renewable energy market size in 2025. Residential installations are forecast to advance at an 11.19% CAGR between 2026-2031.
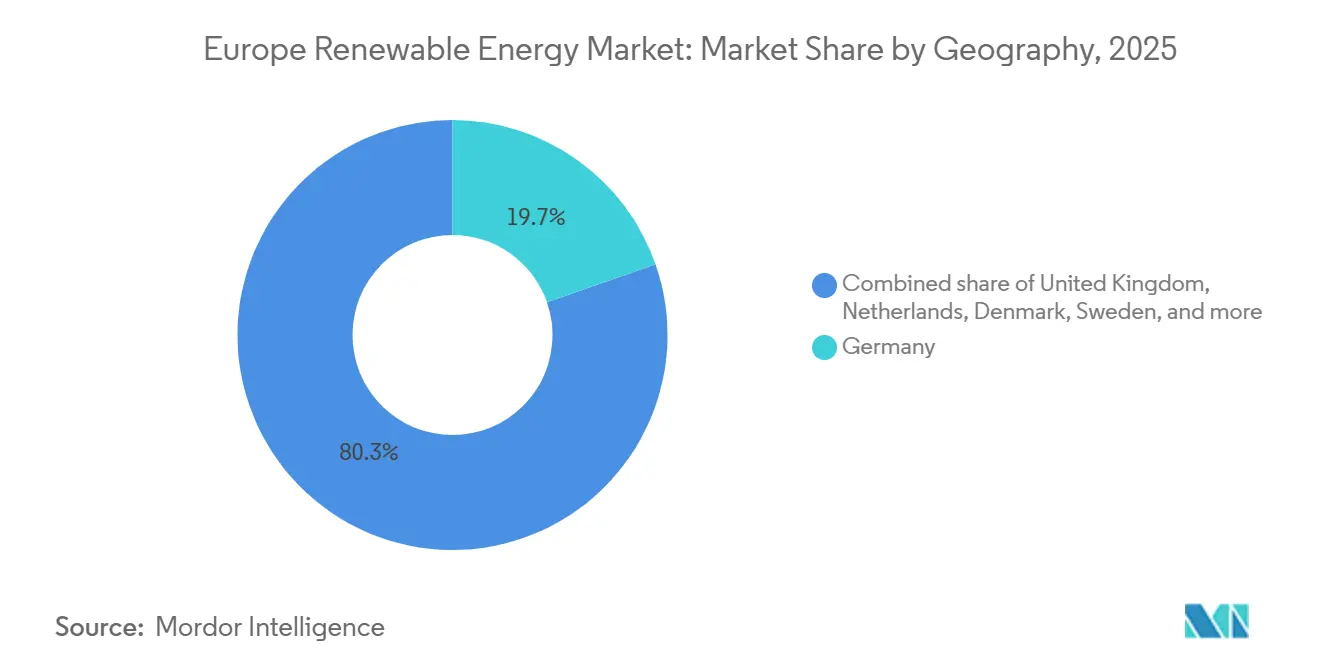
- By geography, Germany accounted for 19.67% of Europe's renewable energy market size in 2025. The United Kingdom is forecast to grow fastest at 12.41% CAGR to 2031.
Note: Market size and forecast figures in this report are generated using Mordor Intelligence’s proprietary estimation framework, updated with the latest available data and insights as of January 2026.
Market Trends and Insights
Drivers Impact Analysis of Europe Renewable Energy Market*
| Driver | (~) % Impact on CAGR Forecast | Geographic Relevance | Impact Timeline |
|---|---|---|---|
| EU "Fit-for-55" & REPowerEU 45% target by 2030 | +2.1% | Pan-European, strongest in Germany, Netherlands, Denmark | Long term (≥ 4 years) |
| Rapid LCOE decline in solar & onshore wind | +1.8% | Global, with accelerated adoption in Spain, Italy, Greece | Medium term (2-4 years) |
| Rising EU-ETS carbon price tilting merit-order | +1.5% | Core EU markets (Germany, France, Poland), limited effect in non-ETS Norway | Short term (≤ 2 years) |
| Offshore-wind build-out backed by EU strategies | +1.3% | North Sea basin (UK, Netherlands, Denmark, Germany), Baltic (Poland, Sweden) | Long term (≥ 4 years) |
| Corporate PPAs from data-centre & heavy-industry clusters | +0.9% | Nordics (data centers), Germany & France (steel, chemicals) | Medium term (2-4 years) |
| Green-hydrogen quotas anchoring new RES capacity | +0.7% | Iberia (Spain, Portugal), Germany, Netherlands | Long term (≥ 4 years) |
| Source: Mordor Intelligence | |||
Fit-for-55 & REPowerEU 45% Target
The REPowerEU plan elevates the 2030 renewables target to 45% of final energy, with Germany pledging 80% renewable electricity and the Netherlands aiming for 21 GW offshore wind by 2030.[1]European Commission, “REPowerEU Plan,” europa.eu Fast-track permitting in designated “go-to” areas cuts average lead times below two years and trims WACC by 50-100 bps, yet reaching the headline goal still hinges on synchronous grid reinforcement.
Rapid Solar and Onshore-Wind LCOE Decline
Utility-scale solar in Southern Europe achieved EUR 25-30 per MWh in 2025 after bifacial-module and tracker gains, while high-resource onshore-wind sites reached EUR 30-35 per MWh, enabling subsidy-free auctions in Spain and merchant builds in Italy.[2]International Renewable Energy Agency, “Renewable Power Generation Costs 2025,” irena.org Investor appetite is shifting toward merchant projects that exploit intraday volatility, even as narrower margins accelerate developer consolidation.
Rising EU-ETS Carbon Price
An average allowance price of EUR 82 per tonne in 1H 2025 rendered coal uneconomic for most hours and forced 4.2 GW of German lignite retirements. Long-term industrial PPAs are locking in wind supply for steel and chemical clusters to hedge against escalating carbon costs.
Offshore-Wind Build-Out Strategies
The EU targets 60 GW offshore wind by 2030 and 300 GW by 2050, with UK seabed leases, Germany’s 5.5 GW 2025 tender, and the 3.5 GW Bornholm Energy Island underpinning the pipeline. Turbine ratings have jumped to 15-18 MW, lowering installed costs 15-20% and turning offshore wind into a quasi-baseload resource in North Sea grids.
Restraints Impact Analysis of Europe Renewable Energy Market*
| Restraint | (~) % Impact on CAGR Forecast | Geographic Relevance | Impact Timeline |
|---|---|---|---|
| Grid congestion & interconnection bottlenecks | -1.2% | Germany (North-South), Iberia-France, Italy (North-South) | Short term (≤ 2 years) |
| Retroactive policy shifts & tariff claw-backs | -0.6% | Spain, Italy, Greece (inframarginal taxes, tariff revisions) | Medium term (2-4 years) |
| Price-inflated supply chains (transformers, subsea cables) | -0.5% | Pan-European, acute in offshore wind (North Sea, Baltic) | Short term (≤ 2 years) |
| Local opposition/biodiversity litigation delays | -0.4% | France (onshore wind), Germany (raptor habitats), UK (coastal zones) | Medium term (2-4 years) |
| Source: Mordor Intelligence | |||
Grid Congestion & Interconnection Bottlenecks
Curtailment erased 8 TWh of wind and solar output in 2025, costing EUR 800 million in unrealized revenue. Limited capacity from Spain into France and from Nordic hubs into Central Europe suppresses merchant capture rates, driving co-located battery deployment despite 10-15% higher capex.[3]European Network of Transmission System Operators for Electricity, “Ten-Year Network Development Plan 2025,” entso-e.eu
Retroactive Policy Shifts
Spain’s windfall levy, Italy’s tariff index caps, and Greece’s revenue claw-backs trimmed project IRRs 8-12% for legacy assets and widened WACC 50-100 bps for new builds. Developers now favor corporate PPAs and capacity-market hedges to ring-fence regulatory risk.
*Our forecasts treat driver/restraint impacts as directional, not additive. The impact forecasts reflect baseline growth, mix effects, and variable interactions.
Europe Renewable Energy Market Segment Analysis
By Technology:
Ocean Surge, Solar ScaleSolar held 38.24% of Europe's renewable energy market share in 2025, reflecting broad rooftop adoption and utility builds across Iberia. Ocean energy is on track for a 31.83% CAGR to 2031, buoyed by Scotland's commercial tidal arrays and Portugal's wave pilots.[4]Ocean Energy Europe, “EU Market Outlook 2025,” oceanenergy-europe.eu
Utility-grade solar remains the volume anchor of the European renewable energy market, yet developers increasingly hybridize with batteries to smooth intraday volatility and satisfy green-hydrogen offtake contracts. Offshore wind, now standardizing 15-18 MW machines, contributes growing baseload hours at 50-55% capacity factors. Pumped-storage hydro, 12-14% of capacity, is being uprated for six-plus-hour storage duty. Bioenergy and geothermal preserve niche roles but supply key flexibility in Nordic and volcanic belts.


By End-User:
Utility Dominance, Residential UpswingUtilities accounted for 69.81% of Europe's renewable energy market size in 2025, leveraging green-bond access and balance-sheet depth to win capacity auctions. Residential systems, forecast to rise at an 11.19% CAGR through 2031, gain from subsidy-backed batteries and improved net-metering in Germany and Italy.
Utilities now bundle generation, demand-response, and retail tariffs, monetizing distributed energy through virtual power plants. Residential uptake exceeds 20% of peak-day supply in parts of Bavaria and Flanders, prompting DSOs to install smart inverters and local flexibility markets. Commercial-industrial rooftops and virtual PPAs deliver hedge value for data centers and auto plants, rounding out the demand stack of the European renewable energy market.
Geography Analysis
Western Europe Renewable Energy Market
Germany retained 19.67% of Europe's renewable energy market size in 2025, under Energiewende mandates that target 80% renewable electricity by 2030. The United Kingdom is set to grow fastest at 12.41% CAGR through 2031, propelled by 8 GW of new offshore leases and competitive CfD strike prices. Spain and France each stood near 13% of capacity; Spain continues merchant solar growth while France accelerates offshore wind in Normandy and Brittany.
Broader European Markets
Italy, at 8-9%, concentrates solar in high-insolation south, while the Netherlands pairs rooftop solar with North Sea wind to reach 6-7% share. Denmark and Sweden punch above their weight per capita, the former sourcing 80% of electricity from wind and the latter balancing hydropower and wind. The rest of Europe cohort, Poland, Greece, Portugal, Belgium, and Ireland, collectively supplied one-quarter of capacity in 2025 and presents the next wave of greenfield builds supported by EU Just Transition funds and lower permitting friction. Weak Iberia-France and Baltic-Central Europe links still localize price risk, dampening project valuations by up to 15% versus well-meshed grids.
Competitive Landscape
The top 10 developers control roughly 40-45% of installed renewable capacity, yielding a moderate concentration in the European renewable energy market. Ørsted and RWE link offshore wind with green-hydrogen offtake, securing 10-15-year revenue lines that shave financing costs. Vestas, Siemens Gamesa, and Nordex offset shrinking turbine margins by expanding 30-year service contracts and digital diagnostics that boost lifecycle revenue 30-35%.
Scale and vertical integration are becoming prerequisites: RWE and Vattenfall deploy 15-18 MW offshore turbines that cut foundations 30-40% per GW, while Enel and Iberdrola pair solar with four-hour batteries to arbitrage peak spreads. Hybrid solar-wind-storage plants reduce curtailment 20-30% and already represent 12% of new builds, offering white-space for niche specialists in floating offshore and tidal-stream demonstrations. M&A continues as TotalEnergies bought half of EDPR’s Iberian solar pipeline and Engie merged Belgian assets with Ocean Winds to boost auction competitiveness, illustrating strategic alignment toward portfolio scale and balance-sheet reach.
Europe Renewable Energy Industry Leaders
Enel Green Power S.p.A.
Iberdrola Renovables S.A.
Ørsted A/S
RWE Renewables GmbH
EDF Renewables
- *Disclaimer: Major Players sorted in no particular order
Europe Renewable Energy Market Companies Covered in this Report
- Enel Green Power S.p.A.
- Iberdrola Renovables S.A.
- Ørsted A/S
- RWE Renewables GmbH
- EDF Renewables
- Engie SA (Renewables)
- Acciona Energía S.A.
- Statkraft AS
- EDP Renováveis S.A.
- Vattenfall AB (Renewables)
- Vestas Wind Systems A/S
- Siemens Gamesa Renewable Energy S.A.
- Nordex SE
- Hanwha Q Cells GmbH
- TotalEnergies Renewables
- Repsol Renovables
- ContourGlobal PLC
- Abengoa SA
- Andritz AG
- BayWa r.e. AG

Recent Industry Developments in Europe Renewable Energy Market
- November 2025: Ingrid has partnered with Energiequelle GmbH to co-develop and deploy 200 MW of grid-scale Battery Energy Storage Systems (BESS) across Germany. In this collaboration, Energiequelle spearheads project development, whereas Ingrid takes charge of financing, operating, and optimizing the assets through its proprietary trading and optimization platform.
- October 2025: Apple unveiled plans to bolster its renewable energy endeavors across Europe. The tech giant is set to develop 650 MW of new solar and wind farms in Greece, Italy, Latvia, Poland, and Romania.
- March 2025: RWE and TotalEnergies sealed a landmark 15-year agreement. Under this deal, RWE will supply 30,000 tons of green hydrogen each year to TotalEnergies' Leuna refinery in Germany, commencing in 2030. The initiative aims to reduce emissions at the refinery by substituting gray hydrogen with green hydrogen.
- January 2025: Plenitude revealed a 400 MW boost to its renewable energy capacity in Spain, bringing its total to nearly 950 MW. This marks a more than twofold increase from its 2023 figures, encompassing both photovoltaic and wind power projects.


Europe Renewable Energy Market Report Scope
Renewable energy, sourced from nature's rapidly replenishing elements such as sunlight, wind, water, and geothermal heat, offers power with minimal to zero greenhouse gas emissions. This stands in stark contrast to the emissions from finite fossil fuels. The primary forms of renewable energy encompass solar, wind, hydropower, biomass, and geothermal. These are captured using technologies like solar panels, wind turbines, and dams, presenting a sustainable solution in the fight against climate change.
The European renewable energy market is segmented by technology, end user, and geography. By technology, the market is segmented into solar energy, wind energy, hydropower, bioenergy, geothermal energy, and ocean energy. By end user, the market is segmented into utilities, commercial and industrial, and residential sectors. By geography, the market is segmented into Germany, the United Kingdom, Spain, France, Italy, the Netherlands, Denmark, Sweden, and the rest of Europe. For each segment, the market sizing and forecasts have been carried out on the basis of volume, measured in gigawatts (GW).
Segmentation Overview
By Technology
| Solar Energy (PV and CSP) |
| Wind Energy (Onshore and Offshore) |
| Hydropower (Small, Large, PSH) |
| Bioenergy |
| Geothermal |
| Ocean Energy (Tidal and Wave) |
By End-User
| Utilities |
| Commercial and Industrial |
| Residential |
By Geography
| Germany |
| United Kingdom |
| Spain |
| France |
| Italy |
| Netherlands |
| Denmark |
| Sweden |
| Rest of Europe |
| By Technology | Solar Energy (PV and CSP) |
| Wind Energy (Onshore and Offshore) | |
| Hydropower (Small, Large, PSH) | |
| Bioenergy | |
| Geothermal | |
| Ocean Energy (Tidal and Wave) | |
| By End-User | Utilities |
| Commercial and Industrial | |
| Residential | |
| By Geography | Germany |
| United Kingdom | |
| Spain | |
| France | |
| Italy | |
| Netherlands | |
| Denmark | |
| Sweden | |
| Rest of Europe |


Key Questions Answered in the Report
How large is Europe’s renewable energy capacity today, and what is the projected growth by 2031?
Capacity stands at 1,204.66 GW in 2026 and is expected to reach 1,811.91 GW by 2031, advancing at an 8.51% CAGR.
Which technology segment is expanding fastest through 2031?
Ocean-energy projects, mainly tidal and wave, are forecast to grow at a 31.83% CAGR, outpacing all other segments.
Which country currently holds the largest share of capacity, and which is growing quickest?
Germany leads with 19.67% of regional capacity in 2025, while the United Kingdom shows the fastest expansion at a 12.41% CAGR to 2031.
What factors are driving corporate power-purchase agreements in the region?
Rising data-center electricity demand, heavy-industry decarbonization goals, and the EU Carbon Border Adjustment Mechanism are pushing PPA volumes to record highs.
What are the biggest short-term obstacles to new renewable builds?
Grid congestion, limited cross-border interconnections, and supply-chain cost inflation are curbing output and raising capital costs.
Page last updated on:


