Market Overview
| Study Period | 2021 - 2031 |
|---|---|
| Forecast Data Period | 2026 - 2031 |
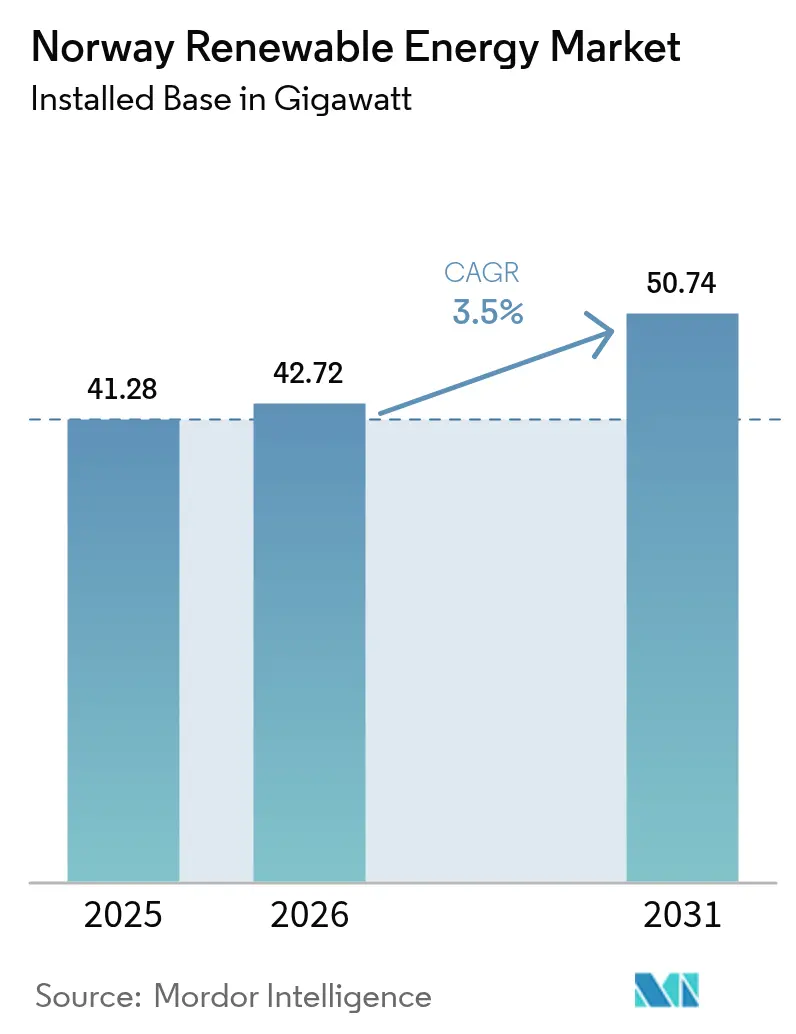
| Base Year Market Size (2025) | 41.28 gigawatt |
| Market Volume (2026) | 42.72 gigawatt |
| Market Volume (2031) | 50.74 gigawatt |
| Growth Rate (2026 - 2031) | 3.50% CAGR |
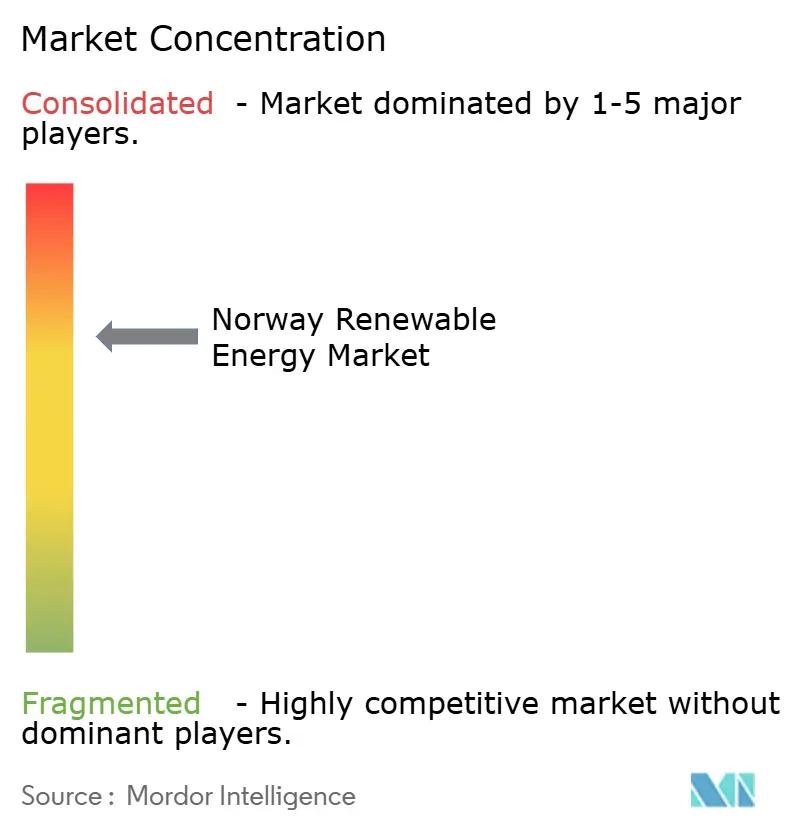
| Market Concentration | Medium |
Major Players *Disclaimer: Major Players sorted in no particular order Image © Mordor Intelligence. Reuse requires attribution under CC BY 4.0. | |
Norway Renewable Energy Market Analysis by Mordor Intelligence
The Norway Renewable Energy Market size is expected to grow from 41.28 gigawatt in 2025 to 42.72 gigawatt in 2026 and is forecast to reach 50.74 gigawatt by 2031 at 3.50% CAGR over 2026-2031.
High-head hydropower still supplies the country’s baseload, but seasonal oversupply drives negative Nordic spot prices that favor long-duration storage, merchant exports, or long-term power-purchase agreements. Floating-platform innovations are opening deep-water areas, while bifacial solar shows unexpected productivity in snow-reflection conditions. Corporate decarbonization mandates, especially for data centers and aluminum smelters, translate into premium-priced 24/7 carbon-free PPAs that underwrite new capacity.
Key Report Takeaways
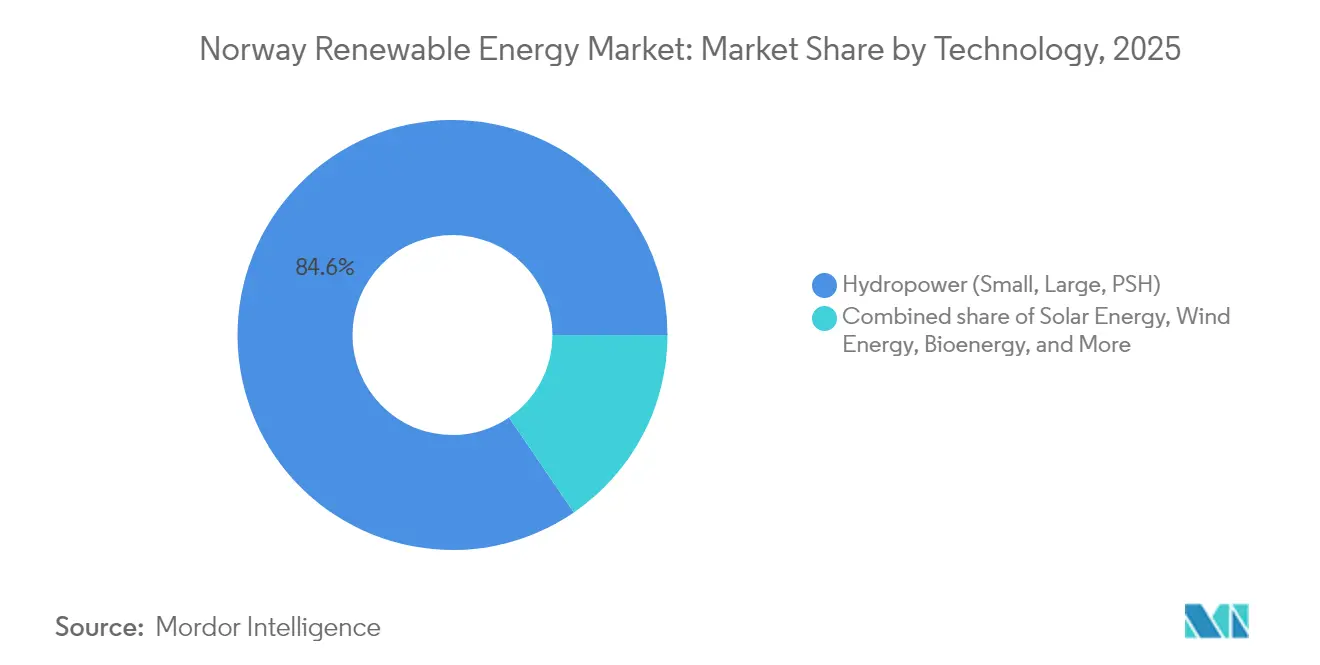
- By technology, hydropower commanded 84.55% of the Norway renewable energy market share in 2025, while solar energy is forecast to expand at a 35.1% CAGR through 2031.
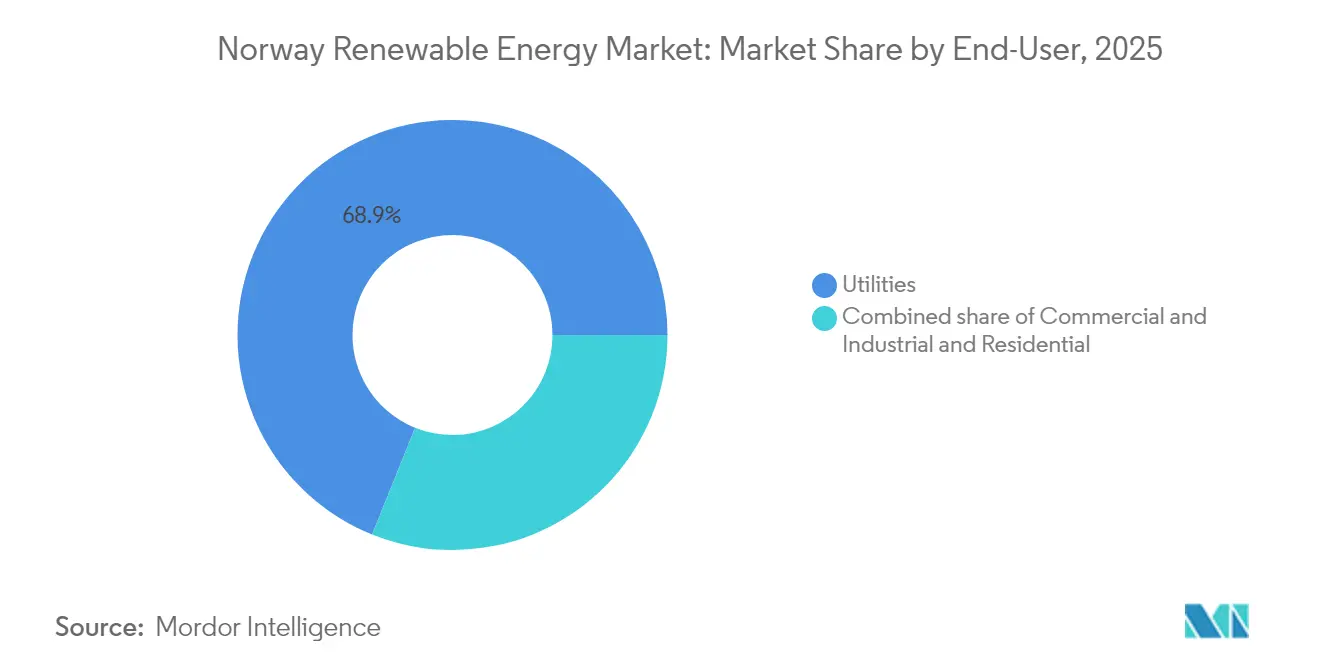
- By end-user, utilities held 68.90% of the Norway renewable energy market size in 2025, whereas the commercial and industrial segment is advancing at a 6.68% CAGR between 2026 and 2031.
- Statkraft and Equinor together controlled about 44.60% of installed capacity in 2025, giving them the single largest slice of the Norway renewable energy market share.
Note: Market size and forecast figures in this report are generated using Mordor Intelligence’s proprietary estimation framework, updated with the latest available data and insights as of 2026.
Norway Renewable Energy Market Trends and Insights
Drivers Impact Analysis*
| Driver | (~) % Impact on CAGR Forecast | Geographic Relevance | Impact Timeline |
|---|---|---|---|
| Hydro-dominant grid limits CO₂ emissions | +0.30% | National | Long term (≥ 4 years) |
| 50 Hertz interconnector boosts export revenues | +0.70% | Southern Norway–Germany | Medium term (2–4 years) |
| Mandatory data-center electrification (2025) | +0.90% | Northern Norway | Short term (≤ 2 years) |
| Offshore wind auction scheme | +1.20% | North Sea coastal zones | Long term (≥ 4 years) |
| Aluminium smelters locking 15-year PPAs | +0.50% | Western industrial clusters | Medium term (2–4 years) |
| Glacier-melt inflow to reservoirs | +0.40% | Mountain catchments | Short term (≤ 2 years) |
| Source: Mordor Intelligence | |||
Hydro-Dominant Grid Limits CO₂ Emissions
Norway’s power system emitted only 6 g CO₂/kWh in 2024, setting an ultra-low baseline that shifts investment away from coal displacement and toward hard-to-abate sectors. Utilities monetize this advantage through hour-by-hour certificates that guarantee carbon-free supply to data-center tenants. Strict grid-code compliance under EU Regulation 2016/631 keeps system stability high even with more variable generation. Equinor’s co-location of solar arrays beside hydro substations cuts interconnection waiting times and leverages existing transformers. The broader signal is that incremental decarbonization now depends on transport and industry electrification rather than new domestic renewables capacity.
50 Hertz Interconnector Boosts Export Revenues
The 1.4 GW NordLink and twin North Sea Link cables exported 8.2 TWh to Germany and the United Kingdom in 2024, earning Norwegian generators EUR 820 million in price arbitrage.[1]“NordLink Record Export Volumes,” Statnett, statnett.noOff-shore wind developers expect similar uplift because Sørlige Nordsjø II output can clear into German peak hours at EUR 100+/MWh while local prices sit near zero. Statnett will invest NOK 30 billion in internal reinforcements that unlock more north–south flow and raise interconnector utilization. EU rules calling for 70 % cross-border capacity, though not binding on Norway, raise pressure to deepen links that anchor the Norway renewable energy market to Continental demand.
Mandatory Data-Center Electrification (2025)
A 2025 decree obliges every new data center to procure 100 % renewables with real-time matching, a threshold stricter than existing EU efficiency proposals.[2]Norwegian Ministry of Climate and Environment, “Data Center Renewable Mandate,” regjeringen.noAker Horizons plans 500 MW of data-center capacity in Narvik and Mo i Rana, exploiting sub-Arctic cooling and nearby hydro surpluses. Statkraft’s 24/7 carbon-free PPAs fetch premiums 20-30 % above standard contracts, creating bankable revenue for new build. The data-protection authority mandates monthly disclosure of sourcing, bolstering transparency. These rules differentiate Norway from neighboring Sweden and Finland, drawing hyperscaler demand northward and enlarging the Norway renewable energy market.
Offshore Wind Auction Scheme
Government auctions covering 1.5 GW at Utsira Nord and 3 GW at Sørlige Nordsjø II will finalize in 2025, with first steel expected in 2027. Utsira Nord’s 200-300 m depths require floating foundations; Equinor holds seven operational patents here, leveraging Hywind experience. Principle Power’s WindFloat platform secured a EUR 60 million European Investment Bank loan to commercialize 15 MW turbines at 500 m depth. In the shallower Sørlige Nordsjø II area, Ørsted and Vattenfall have submitted seabed surveys for fixed-bottom bids. Auction rules omit contracts-for-difference, so developers must secure merchant offtake or corporate PPAs, concentrating risk but rewarding projects with interconnector access.
Restraints Impact Analysis*
| Restraint | (~) % Impact on CAGR Forecast | Geographic Relevance | Impact Timeline |
|---|---|---|---|
| Grid bottlenecks NO2–NO5 price areas | -0.60% | Southern–Northern corridors | Medium term (2–4 years) |
| Reindeer-herding land-use conflicts | -0.40% | Sámi regions | Long term (≥ 4 years) |
| Slow permitting for onshore turbines | -0.50% | National | Medium term (2–4 years) |
| Negative Nordic spot prices | -0.70% | Synchronous Nordic area | Short term (≤ 2 years) |
| Source: Mordor Intelligence | |||
Grid Bottlenecks NO2–NO5 Price Areas
Congestion between southern (NO2) and northern (NO5) zones produced EUR 80/MWh price gaps and stranded northern generation in 2024. Statnett will spend NOK 30 billion on 420 kV upgrades, yet the first energization will arrive only in 2028. Curtailment trims northern wind capacity factors by 8–12 %, eroding returns. Developers thus face a spatial trade-off: costly land near load or cheaper remote sites with curtailment risk. Until reinforcement completes, project economics across the Norway renewable energy market hinge on north–south power-flow relief.
Reindeer-Herding Land-Use Conflicts
The Supreme Court’s Fosen ruling found 151 turbines breached Sámi grazing rights, setting a precedent that has stalled 1.2 GW of onshore wind.[3]Norwegian Ministry of Climate and Environment, “Data Center Renewable Mandate,” regjeringen.no Sámi Parliament consent is now required, extending approvals beyond 1,000 days. Statkraft canceled three Finnmark projects, writing off NOK 180 million in sunk costs. New guidelines demand ethnographic impact assessments and revenue sharing, but permitting lags persist. Capital is therefore pivoting offshore, where seabed leases avoid indigenous land claims, reshaping the Norway renewable energy market toward floating wind.
*Our forecasts treat driver/restraint impacts as directional, not additive. The impact forecasts reflect baseline growth, mix effects, and variable interactions.
Segment Analysis
By Technology: Floating Platforms Unlock Deep-Water Wind
Hydropower held an 84.55 % share of the Norway renewable energy market size in 2025, anchored by 33 GW of installed dams and pumped-storage units. Yet new dam approvals face environmental pushback, so pumped-storage upgrades such as Illvatn now dominate hydro capex. Solar energy is projected to post a 35.1 % CAGR through 2031, with bifacial panels in Stavanger showing 18 % annual capacity factors that validate PV at 60° N latitude. Wind energy contributed roughly 10 % of capacity but will accelerate once 4.5 GW of Utsira Nord and Sørlige Nordsjø II installations enter service after 2028, most of them on floating foundations. Ocean energy and bioenergy together account for less than 2 % today; however, grants under the ENERGIX program sustain R&D pipelines that might reach commercial scale after 2030. The technology mix therefore bifurcates: mature hydro secures flexibility, while fast-rising solar and floating wind drive incremental volume in the Norway renewable energy market.
The Norway renewable energy market share for hydropower will gradually erode as new offshore wind displaces its portion of installed GW, but pumped-storage keeps hydro central to balancing duties. Solar’s sharp cost decline below USD 0.15/W tilts commercial rooftops toward self-generation, although grid buy-back rates remain wholesale. Floating platforms are unlocking 200-400 m depths that dominate Norway’s continental shelf, creating a first-mover advantage for patent holders such as Equinor and Principle Power. Fixed-bottom projects nearer shore still win on levelized cost but face seabed constraints. Bioenergy remains concentrated in waste-to-energy plants like BIR’s Voss facility, which converts organic waste into biomethane for district heat. Overall, portfolio diversification is enhancing resilience and attracting capital even under mature-market growth rates.


By End-User: Hyperscalers Compete With Smelters for PPAs
Utilities controlled 68.90 % of the Norway renewable energy market size in 2025, reflecting state ownership and balancing responsibilities. Commercial and industrial customers are expanding at a 6.68 % CAGR as smelters and data centers lock 10–15-year carbon-free PPAs. The Norway renewable energy market share commanded by utilities will gradually shrink if hyperscaler load accelerates after 2025. Norsk Hydro’s 2.5 TWh/year PPA and Aker Horizons’ planned 500 MW data-center load exemplify how corporates pre-empt generation to secure flat pricing. Residential demand grows just 2 % per year because wholesale-based net metering limits rooftop solar attraction.
Corporate PPAs now underpin financing stacks for floating-wind arrays, reducing merchant-revenue exposure and letting sponsors raise higher debt ratios. Competition authorities view these contracts as pro-competitive because they damp spot-price volatility and stimulate new builds. Utilities still dominate balancing services and ancillary-market revenues, but long-duration storage projects could let industrial buyers internalize flexibility over time. If data-center mandates broaden beyond new facilities to cover existing sites, the commercial and industrial share may overtake utilities by 2035. The Norway renewable energy market thus transitions toward a corporate-PPA equilibrium in which large off-takers shape project pipelines.
Geography Analysis
Hydropower clusters along steep valleys in Vestland and Rogaland, which together house 45 % of installed capacity, while North Sea winds favor nearby floating-wind zones. Northern regions (NO4 and NO5) host 30 % of hydro and much of the best onshore-wind resource, yet transmission bottlenecks strand energy and create EUR 80/MWh price splits versus the south. Statnett’s NOK 30 billion reinforcement aims to lift north-to-south transfer by 1.2 GW, allowing surplus hydro and wind to reach Continental interconnectors. Southern Norway, chiefly NO2, draws solar development because of better irradiance and proximity to demand; Equinor’s 12 MW Stavanger rooftop verified PV viability at high latitude.
Utsira Nord and Sørlige Nordsjø II lie off the West Coast, ensuring export alignment with German demand via NordLink and forthcoming HVDC links. Conversely, Sámi land-use conflicts have frozen 1.2 GW of onshore wind in Finnmark and Troms, redirecting capital to offshore sites where seabed leases avoid indigenous overlaps. Aker Horizons’ data-center campuses in Narvik and Mo i Rana co-locate load with stranded renewables, sidestepping curtailment risk and setting a model for future industrial siting. Geography thus underpins a dual market: southern zones feed Europe and attract offshore wind, northern zones court on-site loads to monetize surplus power.
The Norway renewable energy market will stay spatially divided until the NO2–NO5 backbone energizes in 2028. After that, hydro reservoirs in the north should flexibly supply Continental peaks, while floating wind in the south exports premium volumes. Solar, though relatively small in absolute terms, will cluster near urban demand centers where rooftops lower land-use friction. Region-specific policies, indigenous rights, and cable capacity, therefore, shape the geographic mosaic of growth.
Regulatory Landscape
Norway regulates renewable power through the Ministry of Energy, with market access, licensing, and grid connection framed by the Energy Act (Act No. 50 of 1990), and offshore development governed under the Offshore Energy Act (Act No. 21 of 2010) and related offshore energy regulations. System operation and connection requirements are shaped by grid codes aligned with EU Regulation 2016/631, which helps maintain stability as variable generation and interconnectors expand.
Recent policy moves tighten compliance for large energy users and add targeted prioritization tools. The Energy Mapping Regulations that entered into force in October 2024 require enterprises using 2.5 GWh/year or more to carry out energy mapping and submit an implementation plan for efficiency measures, reinforcing obligations for data centers and heavy industry. In June 2026, Parliament adopted amendments to the Energy Act (Lovvedtak 82 (2025-2026)) enabling the King to prioritize grid connections for specific customers based on national security interests, adding another element to queue management as electrification demand rises.
Competitive Landscape
The Norway renewable energy market exhibits moderate concentration: Statkraft and Equinor together hold roughly 45 % of installed capacity and dominate offshore-wind acreage. Vestas remains the leading onshore turbine OEM with a 40 % fleet share, followed by Siemens Gamesa and Nordex. Aker Horizons spans floating foundations, green hydrogen, and data-center development, positioning itself as an integrated play from generation through end use. Smaller specialists such as Scatec in solar EPC and Flumill in tidal turbines target high-growth niches beyond the hydro-and-wind mainstream.
Strategic themes point to risk migration away from merchant exposure toward contracted revenues. Statkraft’s 24/7 carbon-free structure matches generation hourly with load, allowing developers to lever projects at 70 % debt or higher. Equinor’s 2024 patent for a tension-leg floater with integrated 50 MWh battery storage signals a move to hybrid systems that combine generation and flexibility. The Norwegian Petroleum Directorate awards seabed licenses based on technical track record, which favors incumbents and may slow new-entrant penetration.
Competition centers on supply-chain localization: Principle Power will assemble WindFloat foundations domestically under its EIB-backed scale-up, while ABB won a NOK 4.5 billion contract for HVDC converter stations that reinforce internal grids. Turbine vendors differentiate via power-curve guarantees suited to Norway’s high-turbulence maritime climate. As solar installations multiply, EPC firms with cold-climate snow-shedding expertise gain share. Overall, the Norway renewable energy market rewards players that blend technology leadership with long-term offtake contracting.
Norway Renewable Energy Industry Leaders
Norsk Hydro ASA
Agder Energi AS
Equinor ASA
Berkshire Hathaway Energy Co
Siemens Gamesa Renewable Energy S.A.,
- *Disclaimer: Major Players sorted in no particular order

Market Opportunities and Future Outlook
Hydropower upgrades and pumped-storage additions are the most actionable whitespace because they build on existing catchments, reservoirs, and grid nodes, while adding flexibility against seasonal oversupply and volatile Nordic prices. Statkraft has communicated a NOK 80 billion investment plan in Norway over the next ten years focused on hydropower upgrading and development, and the pipeline continues to move through licensing, including Statkrafts June 2026 license application to NVE for a new Mar power plant in Tinn municipality designed to lift capacity from 180 MW to 520 MW. Alongside this, high application volumes point to a broader build-and-uprate queue, with NVE reporting around 730 concession applications in 2025.
Corporate and industrial procurement also creates an opportunity, particularly where grid constraints generate localized surpluses and price-area spreads. Long-term PPAs and real-time matching mandates for new data centers support contracted demand, illustrated by Hydro Energi AS and Statkraft signing two long-term power purchase agreements in April 2026 totaling 12.3 TWh over ten years. Offshore wind remains an important expansion route, supported by the government’s stated ambition to allocate areas for 30,000 MW of offshore wind by 2040, but near-term execution still depends on auction design, permitting throughput, and transmission and interconnector access.
Recent Industry Developments
- July 2026: Hydro Energy signed a long-term power purchase agreement with Eviny Fornybar covering 0.5 TWh of renewable electricity per year for the NO5 price area from 2031 to 2040. The agreement strengthens long-dated demand visibility for renewable generators and supports Hydros low-carbon aluminium positioning through secured future power supply.
- April 2026: Hydro Energi AS and Statkraft signed two long-term power purchase agreements totaling 12.3 TWh of electricity over a ten-year period. The contracts expand the pool of bankable, contracted demand in Norway and reinforce the role of corporate PPAs in underpinning new renewable capacity and flexibility investments.
- December 2024: Norsk Hydro secured final regulatory approval from NVE for its 1,120 MW Illvatn pumped-storage project in Telemark. The approval advanced one of the larger storage-oriented hydro additions in the country, aligning with the need for system balancing as wind and solar penetration grows.


Research Methodology Framework and Report Scope
Market Definition and Coverage
For this methodology, the Norway renewable energy market is defined as renewable power generation capacity installed within Norway, counted in gigawatts, and covering technologies such as hydropower, wind, solar, and bioenergy that feed the electricity system.
Scope exclusions: We exclude traded electricity volumes and carbon credits, and we also exclude revenue-only views where capacity additions and retirements cannot be reconciled to grid-connected assets.
Segmentation Overview
- By Technology
- Solar Energy (PV and CSP)
- Wind Energy (Onshore and Offshore)
- Hydropower (Small, Large, PSH)
- Bioenergy
- Geothermal
- Ocean Energy (Tidal and Wave)
- By End-User
- Utilities
- Commercial and Industrial
- Residential
Data Sources, Market Sizing, and Validation
Desk Research
Desk research was used to build the base structure of the market model and to anchor it to public, checkable energy system series. We relied on official statistics and system releases, including Statistics Norway and the Norwegian Water Resources and Energy Directorate (NVE), plus Norwegian transmission system operator publications and IEA energy balances, to understand installed capacity, generation mix, and policy signals.
To keep the coverage practical, we also reviewed project and permitting updates from government portals, national and Nordic power exchange disclosures where relevant, and company annual reports and investor presentations for development pipelines and repowering plans. Patent databases were referenced selectively to sanity-check the direction of technology change, for example turbine and grid integration themes. A paid subscription for company financials and intelligence was used only to standardize operator profiles and ownership where public filings were uneven. The desk sources listed here are illustrative, and many additional public documents and releases were reviewed to collect, validate, and clarify inputs.
Primary Interviews and Surveys
Primary work focused on validating how capacity is being added, upgraded, or delayed across hydropower refurbishments, onshore wind timelines, and emerging offshore wind plans, since these drivers are not always visible in public datasets. We spoke with a mix of utilities and generators, EPC and project service providers, equipment and component stakeholders, and large power buyers, and then used these conversations to stress-test assumptions on commissioning dates, utilization patterns, and technology-specific constraints across Norway.
Distribution of primary research fieldwork respondents
| Company type | Respondent position | Region |
|---|---|---|
| Top tier: 37% | CXOs: 16% | APAC: 39% |
| Mid tier: 46% | Functional/Unit leaders: 30% | EMEA: 36% |
| Smaller Players: 17% | Managers: 54% | Americas: 25% |
Market-Sizing & Forecasting
Market sizing starts with a top-down reconstruction of Norway installed renewable capacity using official time series and grid connected asset updates, which are then aligned to the technology definitions used in this study. After building the country total for the base year, we apply technology specific build rates and retirement patterns so the pathway from the base year to the forecast years stays explainable.
Inputs that influence the model include recent commissioning and decommissioning lists, refurbishment and uprating activity in hydropower, announced offshore wind award timelines, grid connection readiness, and typical construction lead times by technology. When a data point is unclear, it is treated as a gap and handled through conservative timing assumptions, and those assumptions are discussed again in follow-up calls.
Forecasting is done using scenario analysis supported by simple trend checks on historic additions and by the project pipeline maturity, and then stress-tested against policy milestones and grid expansion constraints. Selective bottom-up approximations are used as a cross-check, such as sampling large projects and rolling them up by expected commissioning year, and then comparing the implied annual additions against what the top-down build path suggests.
Data Validation & Update Cycle
Outputs are checked in several steps so that surprises are caught early and assumptions stay consistent across technologies. We compare the model totals against independent signals such as national capacity statistics, grid connection disclosures, and publicly tracked project status changes, and then review variances before results are finalized.
When a large change is seen, such as a major project delay, a rule change, or a new tender outcome, the assumptions are re-opened and targeted re-contacts are triggered to confirm what changed and what did not. The report is refreshed annually, and material events are added through interim updates so clients do not have to wait for the next full cycle. Before delivery, a final analyst pass is completed to ensure the latest public releases are reflected in the tables and narrative.
Mordor Intelligence's Norway Renewable Energy Market Size Compared Against Other Published Estimates
It is common to see different market sizes for Norway renewable energy because the word market is not always measured the same way. Some sources report installed capacity, others report revenue, and a few mix generation output with capacity, which can make the results look inconsistent even when the underlying story is similar.
By tracking installed capacity additions and retirements year by year, Mordor Intelligence keeps the estimate tied to grid connected assets, while some publications use revenue projections that move with power prices, inflation, and currency timing. The spread can also come from what is counted as renewable in practice, such as whether pumped storage is included, how offshore wind timelines are treated before final investment decisions, and how quickly assumptions are refreshed after a tender or permitting update.
Benchmark comparison
| Source | Market Size | Gaps in Research Methodology |
|---|---|---|
| Mordor Intelligence | USD 41.28 B (2025) | |
| Global Consultancy A | USD 14.10 B (2023) | Uses a revenue-based definition that is sensitive to wholesale power price assumptions and inflation indexing, so it does not map cleanly to installed capacity movements in a given year. |
| Regional Consultancy B | USD 17.14 B (2026) | Starts from a later forecast year and blends in broader value chain elements, which can shift totals depending on what is treated as generation assets versus enabling services. |
Taken together, the table shows that the biggest driver of difference is not a math error, it is the measurement choice and timing. Our approach stays traceable because each year is built from capacity change logic that can be checked against project status and national statistics, and then adjusted only when a clear evidence point supports it.


Key Questions Answered in the Report
How large is the Norway renewable energy market today?
Installed capacity reached 42.72 GW in 2026 and is forecast to grow to 50.74 GW by 2031 at a 3.50 % CAGR.
Which technology is growing the fastest in Norway’s power mix?
Solar energy leads with a projected 35.1 % CAGR through 2031, thanks to falling module prices and long summer daylight.
Why are corporate PPAs important in Norway?
Long-term contracts with smelters and data centers stabilize cash flows, enabling developers to finance new offshore-wind and solar projects.
What is delaying onshore-wind expansion?
Permitting now takes more than 1,000 days due to expanded environmental reviews and Sámi land-use concerns.
How will grid bottlenecks be addressed?
Statnett is investing NOK 30 billion to reinforce the NO2–NO5 corridor, boosting north–south transfer capacity by 1.2 GW by 2028.
Page last updated on:


