
Market Overview
| Study Period | 2021 - 2031 |
|---|---|
| Forecast Data Period | 2026 - 2031 |
| Base Year Market Size (2025) | 27.62 gigawatt |
| Market Volume (2026) | 29.29 gigawatt |
| Market Volume (2031) | 39.26 gigawatt |
| Growth Rate (2026 - 2031) | 6.04 % |
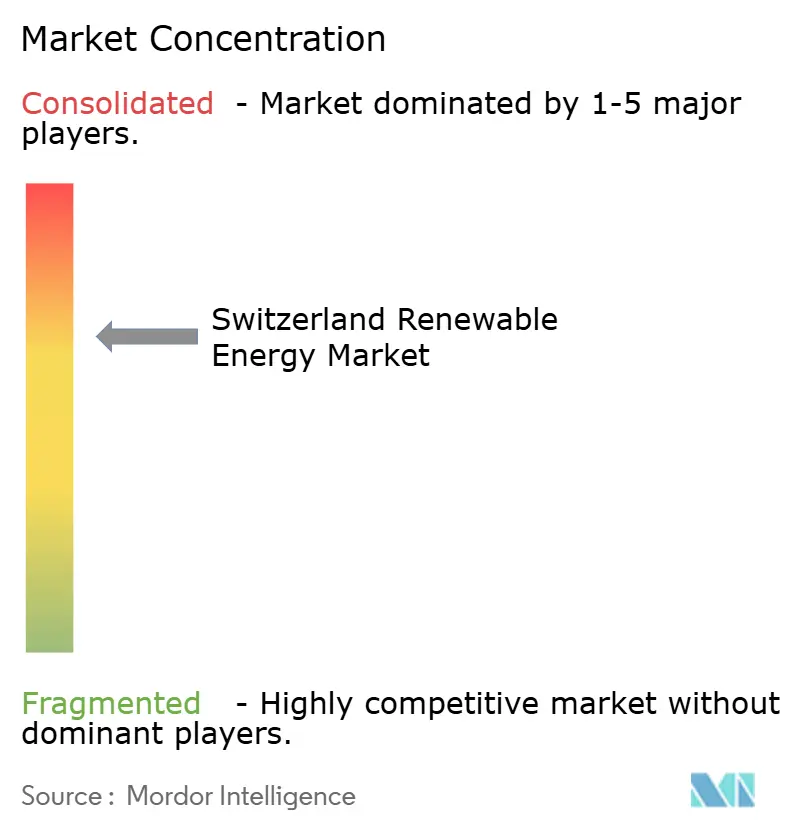
| Market Concentration | Medium |
Major Players *Disclaimer: Major Players sorted in no particular order Image © Mordor Intelligence. Reuse requires attribution under CC BY 4.0. | |
Switzerland Renewable Energy Market Analysis by Mordor Intelligence
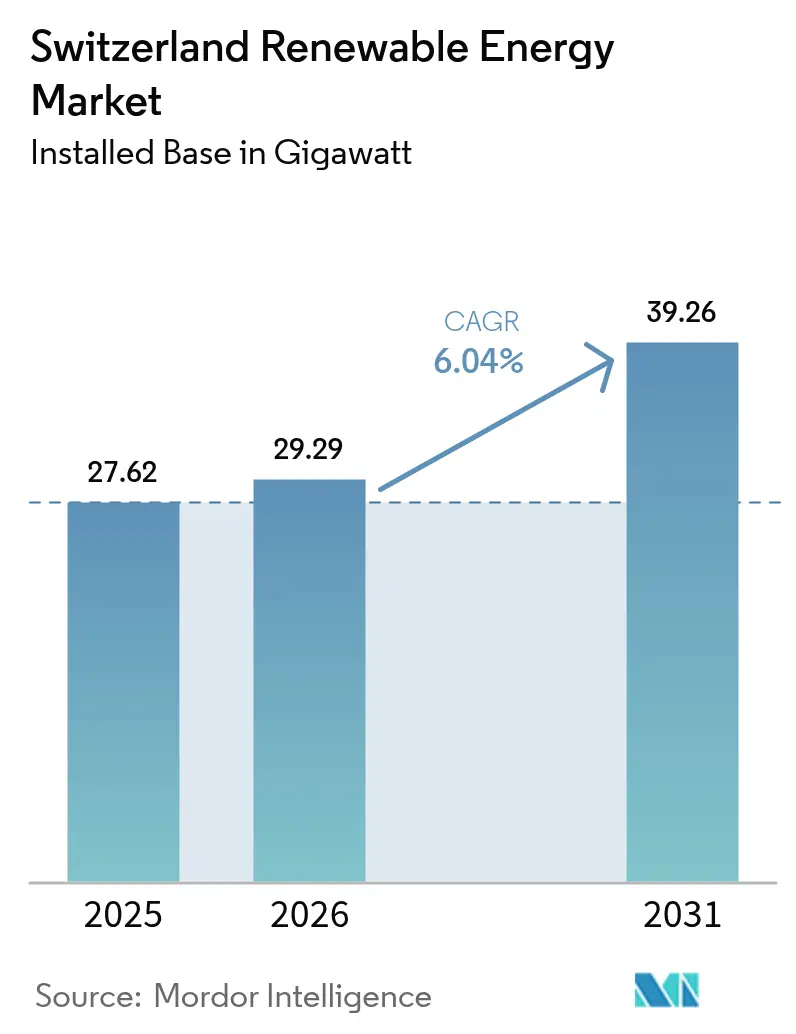
The Switzerland Renewable Energy Market size was valued at 27.62 gigawatt in 2025 and estimated to grow from 29.29 gigawatt in 2026 to reach 39.26 gigawatt by 2031, at a CAGR of 6.04% during the forecast period (2026-2031).
Supportive federal climate policies, streamlined permitting rules adopted in mid-2024, and growing corporate demand for origin-certified green power are accelerating capacity additions in solar photovoltaics, wind, and battery storage. Long-established hydropower assets still supply nearly two-thirds of national generation, yet tightening site availability and lengthy ecological reviews are steering new investment toward high-altitude solar projects that generate half of their annual output during winter, thereby easing seasonal imbalances. Voter endorsement of the new electricity law with 68% support in June 2024 strengthened investor confidence by introducing sliding market premiums and virtual self-consumption groups, both of which improve revenue visibility for independent power producers. Simultaneously, grid-scale battery auctions and the world’s largest 1,600 MWh redox-flow system planned for Laufenburg signal a strategic pivot toward long-duration storage to buffer alpine weather volatility. Switzerland’s proven ability to mobilize cross-border financing, exemplified by Axpo’s JPY 42 billion sustainability-linked Samurai loan in February 2025, further widens the capital pool available for next-generation projects.
Key Report Takeaways
- By technology, hydropower led with 66.85% of the Switzerland renewable energy market share in 2025; wind is advancing at a 23.47% CAGR through 2031.
- By end user, utilities held 70.10% of the Switzerland renewable energy market size in 2025, while the commercial and industrial segment is expanding at a 9.69% CAGR to 2031
Note: Market size and forecast figures in this report are generated using Mordor Intelligence’s proprietary estimation framework, updated with the latest available data and insights as of 2026.
Switzerland Renewable Energy Market Trends and Insights
Drivers Impact Analysis*
| Driver | (~) % Impact on CAGR Forecast | Geographic Relevance | Impact Timeline |
|---|---|---|---|
| Net-zero 2050 mandate and interim 2030 targets | +1.8% | National; strongest deployment in Valais, Graubünden, Bern | Long term (≥ 4 years) |
| Hydro refurbishment subsidies through 2035 | +0.9% | Alpine cantons including Valais, Uri, Ticino | Medium term (2-4 years) |
| Corporate green-power PPAs | +1.5% | Zürich, Basel, Geneva corporate hubs | Short term (≤ 2 years) |
| Grid-scale battery auctions | +1.2% | Graubünden, Valais, Bern | Medium term (2-4 years) |
| Community solar cooperatives | +0.4% | Graubünden, Valais, Jura | Short term (≤ 2 years) |
| Blockchain origin guarantees | +0.3% | National with export spillover to EU | Short term (≤ 2 years) |
| Source: Mordor Intelligence | |||
Government Net-Zero 2050 Mandate & Interim 2030 Targets
Federal climate legislation passed in 2023 obliges Switzerland to reduce greenhouse gas emissions by at least 50% by 2030 compared to 1990 levels and 65% by 2035. This legislation also doubles renewable electricity generation targets to 35,000 GWh from new sources and 37,900 GWh from hydropower.(1)Swiss Federal Office for the Environment, “Net-Zero Strategy 2050,” bafu.admin.ch Annual public funding of CHF 1.2 billion for energy research and a CHF 7 billion green-bond market widens technology pipelines while lowering financing costs. Sectoral mandates that require 100% emissions reduction in buildings and transport by 2050 are pushing electrification and creating structural demand for additional clean power. Regulatory certainty, anchored in multi-decade targets, allows utilities to plan refurbishment projects and multinationals to sign 10-15 year PPAs without political cycle risk. Collectively, these provisions raise the baseline growth path for the Switzerland renewable energy market.
Extension of Hydro Refurbishment Subsidies Through 2035
Bern’s decision to extend subsidies for hydropower modernization until 2035 encourages operators to heighten dams, replace turbines, and add pumped-storage equipment rather than pursue contentious new schemes in untouched valleys.(2) Axpo Group, “Dam Heightening Projects in Grisons,” axpo.com Projects such as the wall-raising at Curnera and Nalps could unlock an extra 99 GWh of winter electricity, easing the seasonal gap. The certainty of multi-year cost recovery makes 5-7 year payback refurbishments viable, while mandatory fish-pass installations and ecological flow controls reduce biodiversity concerns that historically delayed approvals. Although hydropower’s proportional share will decline, refurbished plants will supply flexible winter peaking capacity that complements the rapid expansion of solar energy.
Surge in Corporate Green-Power PPAs from Swiss Multinationals
The headquarters of global firms located in Zurich, Basel, and Zug are accelerating their renewable sourcing efforts to meet Scope 2 targets. Borealis, for instance, signed a 900 GWh wind PPA cutting 155 kt of CO₂ over ten years, and Swiss Federal Railways will operate solely on renewable electricity from 2025.(3) Axpo Group, “Dam Heightening Projects in Grisons,” axpo.com The new electricity law’s virtual self-consumption provision allows firms to aggregate demand across multiple sites, unlocking economies of scale. Blockchain-verified origin guarantees sell at premium tariffs as corporates seek auditable ESG data. Such long-term contracts provide revenue certainty, which derisks merchant exposure for new solar and wind assets.
Accelerated Grid-Scale Battery Auctions to Stabilize Alpine Supply
Swissgrid’s 2024 tender round prioritises long-duration systems capable of 8-12 hour discharge, complementing pumped-storage but avoiding additional valley inundation. The 1,600 MWh Laufenburg redox-flow project will service frequency control for the Germano-Franco-Swiss hub and capture cross-border arbitrage spreads. Storage mitigates the negative price episodes that valley solar causes in the summer and backfills winter deficits when solar irradiation dips, allowing hydropower reservoirs to conserve water for the spring freshet.
Restraints Impact Analysis*
| Restraint | (~) % Impact on CAGR Forecast | Geographic Relevance | Impact Timeline |
|---|---|---|---|
| Limited buildable land for large parks | -1.1% | National; acute in Graubünden, Valais, Uri | Long term (≥ 4 years) |
| Stringent alpine biodiversity rules | -0.7% | Protected alpine zones | Medium term (2-4 years) |
| Lengthy grid-connection and permitting queues | -0.5% | Swissgrid hubs in Bern, Zürich | Medium term (2-4 years) |
| Seasonal price volatility | -0.9% | Nationwide, peaks in summer surplus | Short term (≤ 2 years) |
| Source: Mordor Intelligence | |||
Limited Buildable Land for Large Solar & Wind Parks
Only 7.5% of Swiss territory is deemed suitable for utility-scale solar energy, and prime wind corridors often skirt national parks, where public sentiment strongly favors landscape preservation. In response, developers are pursuing floating PV on high-altitude reservoirs and removable arrays along rail tracks, which do not trigger new land-use conflicts. Even so, fragmented topography necessitates smaller project footprints, which sacrifice economies of scale. The land squeeze raises balance-of-system costs by 15-20%, thereby dampening price competitiveness versus imported green power.
Stringent Alpine Spatial-Planning & Biodiversity Rules
Projects above 1,200 m must undergo 18 to 24-month ecological assessments that often require curtailing wind-turbine operation during bird migration and rerouting access roads to avoid sensitive habitats. Cantonal veto power can stall projects even after federal approval, adding procedural uncertainty. Developers are increasingly clustering new infrastructure near existing resorts or transmission corridors to mitigate visual impact, but this tactic limits resource quality and inflates interconnection costs.
*Our forecasts treat driver/restraint impacts as directional, not additive. The impact forecasts reflect baseline growth, mix effects, and variable interactions.
Segment Analysis
By Technology: Hydropower Dominates While Wind Gains Pace
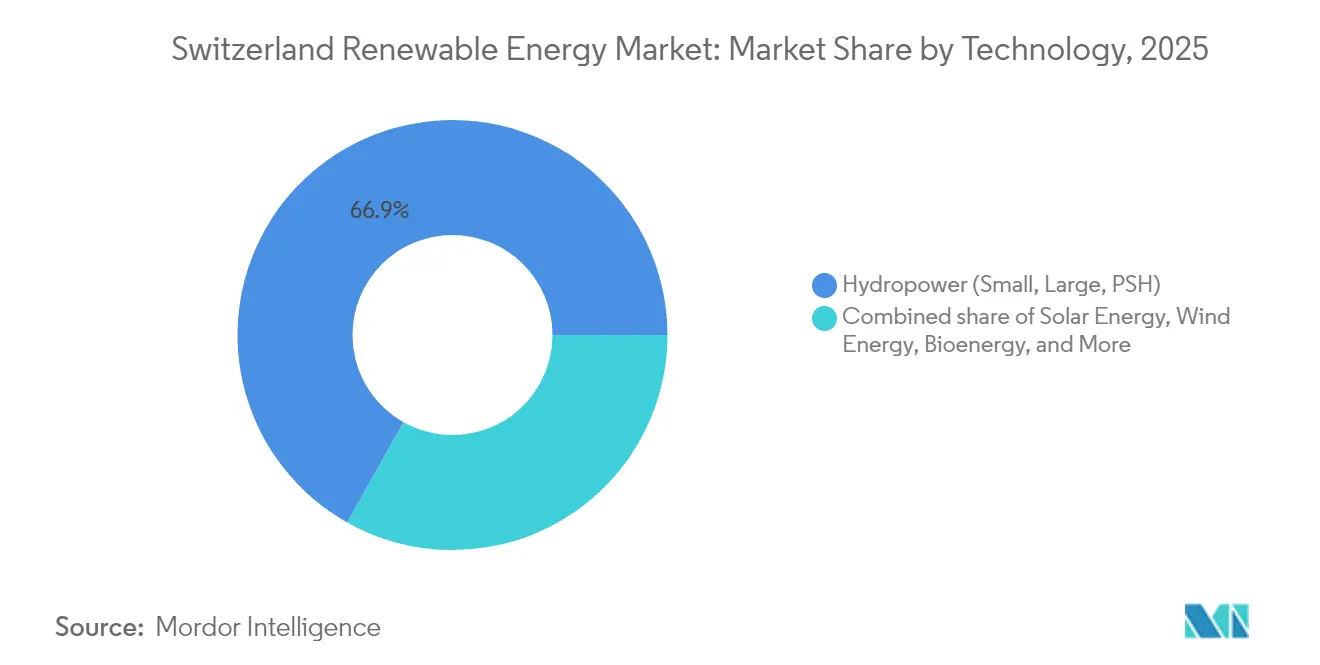
Hydropower represented 66.85% of total capacity in 2025, underlining its historic role in the Switzerland renewable energy market. The segment benefits from mature reservoirs, variable-speed turbine retrofits, and a refreshed subsidy scheme that secures post-2030 cash flows. The Swiss renewable energy market's contribution from pumped-storage hydro alone stands at 9 GW, offering 20 GWh of energy storage that Swissgrid taps for frequency control. Wind remains a modest slice today, yet it is poised for the fastest expansion at a 23.47% CAGR through 2031 as cantonal reforms slash permitting timelines. High-altitude solar is evolving into a winter-focused niche, with bifacial panels exploiting snow albedo to lift seasonal yields. Bioenergy and geothermal stay constrained by feedstock supply and seismic risk, respectively, but pilot geothermal projects suggest up to 500 MW could be online by 2035.
Project economics reflect geography. Reservoir upgrades in Valais earn capacity payments that counteract summer price troughs, while new wind clusters in the Jura sell winter output into premium demand windows. Grid integration rules require all new generators to install bird-safe turbine designs or fish-passage systems, which raises capital expenditures but secures a social license. Over the forecast horizon, the Switzerland renewable energy market size contribution from wind could overtake solar in annual additions if turbine deliveries stay on schedule and cantonal impact studies accelerate.



By End User: Utilities Hold Scale, C&I Accelerates
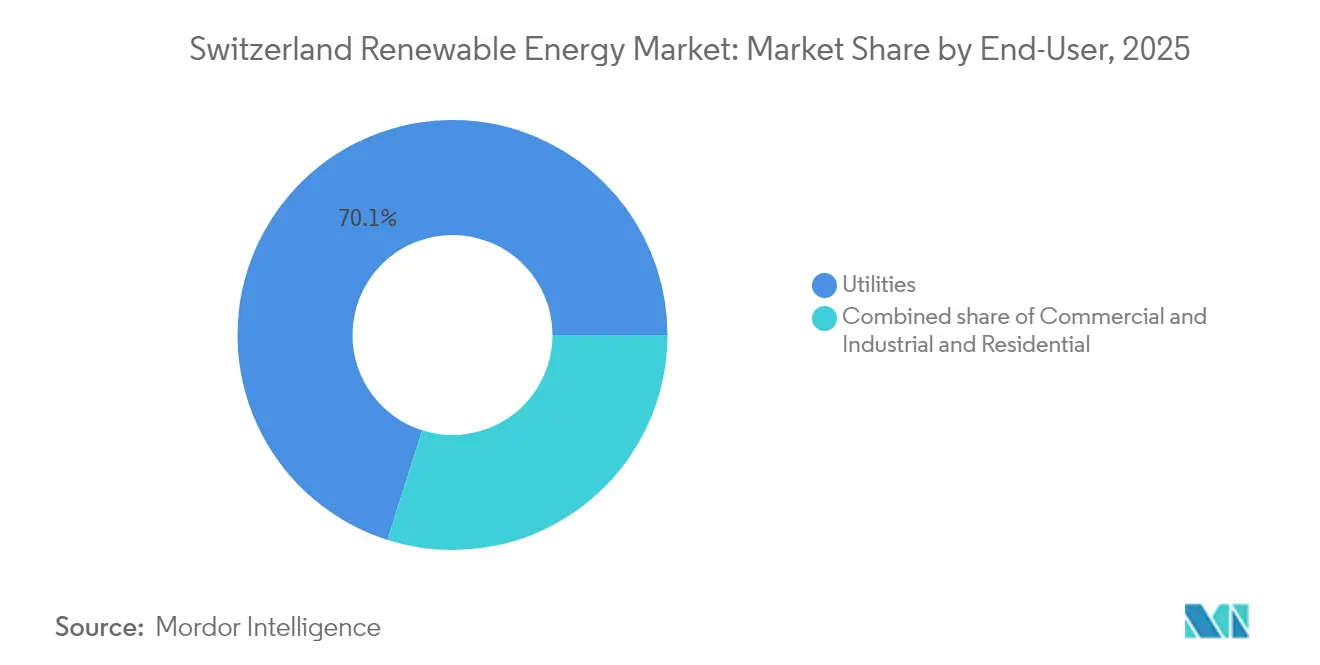
Utilities controlled 70.10% of the installed capacity in 2025, reflecting a century of hydropower development and preferential access to the grid. They leverage balance-sheet strength to refurbish dams, add pumped-storage modules, and invest in grid-scale batteries. The Switzerland renewable energy market share of utilities may edge down as distributed generation rises, yet incumbents still dominate wholesale trading and ancillary services. Commercial and industrial customers are the fastest movers, tracking a 9.69% CAGR as rooftop solar meets scope-2 decarbonization targets and PPAs lock in long-run price certainty. Residential prosumers contribute roughly 10% of capacity, buoyed by canton-level feed-in programs and falling panel prices.
Corporate energy managers prize resilience. Pharmaceutical labs in Basel and high-density data centers in Zürich install behind-the-meter arrays paired with 10-year wind PPAs, blending self-generation with external hedges. Energy cooperatives accelerate community adoption by pooling capital and negotiating volume discounts on equipment. Swissgrid’s CHF 500 million smart-meter rollout will allow real-time netting, unlocking value streams from surplus exports and demand-response participation. As a result, the Switzerland renewable energy market size for the C&I segment is projected to climb steadily, supported by transparent origin guarantees and digital bidding platforms.
Geography Analysis
Alpine cantons dominate physical assets in the Switzerland renewable energy market, with Valais alone hosting 5.2 GW of hydro and 1.1 GW of solar capacity. Graubünden follows, benefiting from wind corridors and proximity to pumped-storage reservoirs. Uri and Ticino round out the top tier with steep gradients that favor run-of-river upgrades and high-altitude photovoltaics. The Jura ridgeline, once hindered by biodiversity concerns, is now equipped with new radar-curtailment systems that reduce avian mortality by 80%, unlocking 150 MW of additional wind energy by 2027.
Urban cantons such as Zürich, Basel, and Geneva focus on rooftop deployment and demand-response portfolios. Zürich’s municipal utility, ewz, installed 50 MW of solar energy across schools and civic buildings in 2024, aiming to reach a 100 MW target by 2027. Basel’s life-science cluster pairs rooftop arrays with blockchain certificates to strengthen ESG narratives. Geneva leverages its district heating network to integrate waste-to-energy plants and forthcoming geothermal pilots.
Cross-border flows temper seasonal imbalance. Switzerland exported 32 TWh and imported 28 TWh in 2024, primarily swapping summer surplus for winter shortfall with France and Italy. Future EU power-market coupling could tighten spreads and reward fast-acting battery capacity stationed near interconnectors. Cantonal autonomy, however, creates a patchwork policy. Bern green-lighted 12 wind projects in 2024, while Fribourg rejected eight on grounds of landscape preservation, underscoring the importance of local engagement.
The Federal Spatial Planning Act requires each canton to publish renewable-energy zoning maps by 2025. Early drafts suggest that 3% of national territory will be earmarked for large-scale projects, predominantly in mountain valleys and plateau wind corridors. High-potential slope sites in Ticino and Vaud attract agrivoltaic pilots among vineyards, where dual-use shading cuts irrigation demand 15%. Through 2031, the Switzerland renewable energy market size growth will remain skewed toward alpine regions, but urban micro-grids and smart-meter rollouts will spread the geographic footprint of renewables beyond traditional hydro strongholds.
Regulatory Landscape
Switzerland’s renewable buildout is governed by federal energy policy led by the Swiss Federal Office of Energy (SFOE), with market oversight and grid-code enforcement supported by bodies such as ElCom and transmission system operator Swissgrid. A central anchor is the Federal Act on a Secure Electricity Supply with Renewable Energy Sources (Stromgesetz), endorsed by voters in June 2024 and implemented in stages, with key provisions taking effect on January 1, 2025 and further provisions on January 1, 2026. The framework codifies binding expansion targets, including at least 35,000 GWh of renewable electricity excluding hydropower by 2035 and hydropower net production of at least 37,900 GWh by 2035, which reinforces long-term investment visibility for solar, wind, hydro refurbishment, and flexibility assets.
Implementation is being translated into operational rules via ordinances, including updates to the Electricity Supply Ordinance (StromVV) that specify technical requirements across grid tariff calculation principles, intelligent metering, and feed-in remuneration rules, with a key update entering into force on July 1, 2026. The same policy package anchors winter-security measures, including an explicit ceiling on net electricity imports in the winter semester and a quantified domestic winter-production increase objective, pushing the market toward system-friendly renewables, storage, and demand-side flexibility rather than energy-only additions.
Competitive Landscape
The Swiss renewable energy market is moderately concentrated, with the top five utilities, Axpo, Alpiq, BKW, Repower, and CKW, holding roughly 60% of the installed capacity. Incumbents defend hydropower positions while pivoting into solar, wind, and battery storage. Axpo expanded its Alpine solar portfolio with a 2.2 MW bifacial project located at 2,500 meters and plans to install a 50 MW green-hydrogen electrolyzer in Valais, targeting industrial off-takers. Alpiq commissioned a 50 MW/110 MWh battery designed for intra-day arbitrage and secured a 15-year ancillary-services contract from Swissgrid. BKW completed the 68 MW Gruyère wind park after nine years of permitting and CHF 8 million in biodiversity offsets.
Specialist developers chase niches left open by legacy players. JUVENT exploits streamlined Jura, permitting to build of mid-size wind clusters that sidestep multi-year environmental studies. Renergon scales agricultural biogas digesters in cantons with livestock density and feed-in incentives. Energy cooperatives, led by Genossenschaft Solarstrom Schweiz, pool citizen capital for community-owned rooftops, 200 arrays to date, while capturing interest rates 1.5 points below commercial benchmarks.
Digital innovation reshapes competition. Blockchain origin guarantees fetch higher prices, and AI dispatch models cut balancing costs by 12% for operators bidding into Swissgrid’s ancillary-services auctions. Patent filings center on variable-speed turbine controls and DER aggregation software. Regulators watch closely: ElCom enforces grid-code compliance and certificate authenticity, imposing fines for reporting lapses. Looking to 2030, incumbents will leverage grid access and hydropower reservoirs, but nimble newcomers may capture value in rooftop aggregation, winter-focused wind, and hybrid solar-plus-storage plays.
Switzerland Renewable Energy Industry Leaders
Axpo Holding AG
Alpiq Holding AG
BKW Energie AG
CKW (Centralschweizerische Kraftwerke AG)
Repower AG
- *Disclaimer: Major Players sorted in no particular order

Market Opportunities and Future Outlook
Near-term whitespace centers on grid and flexibility investments that can raise penetration of decentralized solar while addressing the winter security constraints embedded in the new electricity law. Swissgrid’s Strategic Grid 2040 publication (April 2025) outlines 31 significant grid projects and a CHF 5.5 billion investment envelope through 2040, creating demand for EPC services, substation and line upgrades, digital grid tools, and interconnection solutions that shorten queue times for new solar, wind, and storage. At the same time, ordinance-level implementation of intelligent metering and tariff rules (including the July 2026 StromVV update) supports business models around virtual self-consumption groups and local electricity communities, widening the addressable market for aggregators, C&I energy managers, and behind-the-meter solar-plus-storage providers.
Solar supply-chain and integration capacity also represent a concrete opportunity area, given the pace of additions and the policy emphasis on accelerated planning and permitting for national-interest projects. Switzerland deployed 1.33 GW of new solar capacity in 2025, and federal-level actions in 2026 to accelerate approval pathways for solar, wind, and hydro projects reinforce a pipeline shift toward larger, grid-relevant developments and winter-optimized production profiles (including high-altitude PV). Alongside generation, long-duration and grid-scale storage sits at the intersection of policy and system needs: Swissgrid tenders and the market’s pivot toward long-duration solutions, including the planned 1,600 MWh redox-flow project at Laufenburg referenced in the report context, expand the vendor and developer landscape for batteries, power conversion systems, and energy management software linked to ancillary services and congestion management.
Recent Industry Developments
- July 2026: Alpiq signed a pre-connection agreement with Swissgrid for a 300 MW/1.2 GWh battery energy storage system in Niedergosgen. The step moves the project from concept toward grid-integrated execution in a market where interconnection approvals are a key gating factor. It also underlines the shift among Swiss incumbents toward utility-scale flexibility to complement rising solar output and manage winter reliability constraints.
- February 2025: Axpo raised JPY 42 billion via a sustainability-linked Samurai loan to finance renewable projects across its portfolio. The transaction broadened the available financing pool for capital-intensive renewables and flexibility assets and showed continued investor appetite for linked sustainability KPIs. Access to diversified funding supports multi-technology development spanning solar, wind, and storage.
- December 2024: Axpo launched a hydrogen production plant at Reichenau, supporting Switzerland’s hydrogen strategy and sector coupling agenda. The move strengthens the pathway for renewable electricity to supply new end uses beyond the power sector, including industrial offtake. It also adds another demand lever for origin-certified renewable generation alongside corporate PPAs.


Research Methodology Framework and Report Scope
Market Definition and Coverage
This market covers Switzerland's renewable power capacity added and operating across grid connected and behind the meter projects, counted as installed capacity in gigawatts across the renewable technologies considered in the study.
Scope exclusions: We exclude non-renewable generation assets, pure grid transmission and distribution spending, and downstream retail electricity sales not tied to renewable capacity additions.
Segmentation Overview
- By Technology
- Solar Energy (PV and CSP)
- Wind Energy (Onshore and Offshore)
- Hydropower (Small, Large, PSH)
- Bioenergy
- Geothermal
- Ocean Energy (Tidal and Wave)
- By End-User
- Utilities
- Commercial and Industrial
- Residential
Data Sources, Market Sizing, and Validation
Desk Research
Desk work starts with building a consistent Switzerland power baseline, because capacity additions only make sense when compared against total generation needs and policy targets. We used public sources such as the Swiss Federal Office of Energy (SFOE) statistics, IEA country energy balances, the International Renewable Energy Agency (IRENA) renewable capacity series, and ENTSO-E electricity system data where applicable for cross-checks.
Next, inputs were shaped using sources that explain what is being built and when, such as regulatory publications and federal consultation notes, grid connection and permitting updates, and customs or trade statistics for selected equipment categories when it helps validate installation momentum. Company annual reports, investor presentations, and reputable Swiss energy press were used to confirm commissioning timelines and to sanity check technology mix. For gaps like historical project commissioning dates and patent activity that signals technology direction, we also referenced paid subscriptions covering company financials and intelligence, news and financials, patent databases, and global contracts and tenders. These examples are not exhaustive, and many other public and internal reference points were used for data collection, validation, and clarification.
Primary Interviews and Surveys
We use expert interviews and surveys with Swiss utility, developer, installer, equipment, engineering, and policy professionals. Their feedback tests capacity additions, commissioning delays, utilization assumptions, project economics, and gaps in secondary records. Analysts reconcile conflicting responses before adjusting model inputs and final totals for Switzerland.
Distribution of primary research fieldwork respondents
| Company type | Respondent position |
|---|---|
| Top tier: 29% | CXOs: 18% |
| Mid tier: 46% | Functional/Unit leaders: 30% |
| Smaller Players: 25% | Managers: 52% |
Market-Sizing & Forecasting
Sizing was built using a top-down approach where national renewable capacity time series, policy targets, and grid level build-out signals reconstruct the annual installed base, and then the results are split across technologies using observed mix and pipeline evidence. Once that structure is in place, selective bottom-up checks are used so totals do not drift, including sampled project pipelines, commissioning calendars, and a few supplier and installer channel checks where visibility is available.
The model uses market fingerprints that can be traced year to year, such as annual renewable capacity additions, technology wise split between solar, wind, hydropower, bioenergy and other renewables, grid connection lead times, permitting throughput, and average project size trends by end user category. Where a sub-segment lacks consistent public reporting, we bridge the gap by anchoring to known installed base, applying a conservative build rate, and then confirming direction with expert feedback.
For forecasting, we relied on scenario analysis supported by an ARIMA style time series check on historical additions, and then adjusted the pathway based on variables that experts agreed matter most in Switzerland, including policy execution pace, grid constraint severity, and the bankability of project economics. The final forecast is only finalized after the assumptions are rechecked for internal consistency with the national power context and the technology level pipeline reality.
Data Validation & Update Cycle
Validation happens in layers, so a single source or a single model output does not drive the result. We compare modeled capacity totals with independent signals like official capacity registries, project commissioning announcements, and technology specific trend breaks, and then investigate any variance that looks too large to be explained by timing.
Before sign-off, the work is reviewed by another analyst who checks unit consistency, time alignment, and whether assumptions match what primary respondents described. The report is refreshed annually, and interim updates are made when there is a material policy shift, a major project pipeline change, or a clear break in installation momentum. Right before delivery, a final pass is completed so clients receive the most current view available at that time.
Mordor Intelligence's Switzerland Renewable Energy Market Size Measured Against Other Published Estimates
Published market sizes for Switzerland renewable energy often do not match because they do not measure the same thing, and the unit choice drives the outcome. Some sources size revenue linked to renewable activity, while others, like this report, express the market as installed capacity in gigawatts, which naturally leads to a different scale.
Installed capacity time series and technology-level build-out checks are the evidence that anchors Mordor Intelligence's estimate to what is actually commissioned in Switzerland, instead of converting the market into revenue using assumed electricity prices. The other main gap drivers are how technologies are grouped, whether legacy hydropower is treated as part of the renewable base in the same way, and how quickly assumptions are refreshed when policy or pipeline conditions change.
Benchmark comparison
| Source | Market Size | Gaps in Research Methodology |
|---|---|---|
| Mordor Intelligence | USD 29.29 B (2026) | |
| Industry Publisher A | USD 2.00 B (2025) | Sizes the market as revenue across renewable types and end users, so the total is driven by pricing and value-chain boundaries rather than installed capacity additions. |
| Analytics Publisher B | USD 2.07 B (2023) | Reports a revenue-based market with a different historical window and lower growth pathway, and it does not tie the total back to annual capacity additions and commissioning timing. |
The table shows that most of the spread is not a math error, it is a scope and unit difference that changes the numerator completely. By keeping the model tied to commissioning and installed base updates, and then cross-checking technology mix with pipeline reality, the final figure stays traceable to clear variables and repeatable steps.


Key Questions Answered in the Report
What is the current capacity of renewables installed across Switzerland?
The Switzerland renewable energy market size totals 29.29 GW in 2026, led by hydropower at 66.85% of capacity.
How fast is Swiss wind capacity expected to grow?
Solar photovoltaics lead growth, with capacity forecast to rise at a 9.42% CAGR through 2031, buoyed by federal Solar Express subsidies.
How significant is hydropower in the current mix?
Wind is forecast to record a 23.47% CAGR through 2031 as cantonal reforms accelerate project approvals.
Which customer segment is adding renewable capacity the quickest?
Commercial and industrial buyers are expanding at a 9.69% CAGR, driven by rooftop solar and long-term PPAs.
Why are large batteries becoming attractive in Switzerland?
Grid-scale batteries help absorb summer solar surpluses and deliver power during winter peaks when hydropower wanes.
How do blockchain guarantees of origin benefit Swiss renewable generators?
They command price premiums by proving geographic and temporal specificity, attracting corporate buyers seeking additionality.
Page last updated on:





