Red Berries Market Size and Share
Red Berries Market Analysis by Mordor Intelligence
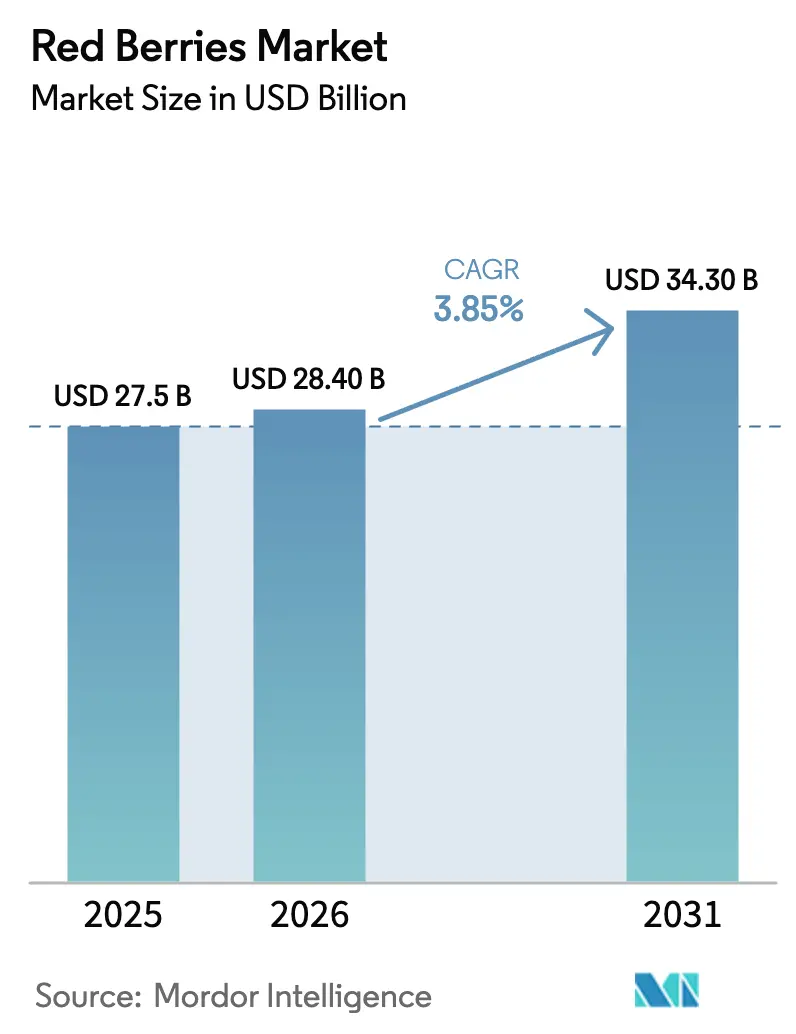
The red berries market size is expected to reach USD 27.5 billion in 2025, USD 28.40 billion in 2026, and is projected to grow to USD 34.30 billion by 2031, reflecting a CAGR of 3.85%. This moderate expansion reflects growers shifting toward climate-resilient cultivars, greater irrigation precision, and wider adoption of controlled-environment production. Competitive positioning now relies on securing consistent pollination, automating labor-intensive tasks, and integrating post-harvest cold chains that can withstand long-haul exports. Retailers are tightening traceability and sustainability criteria, which prompts larger grower-shippers to lock in multi-year supply contracts, while smaller farms pivot toward premium local or organic niches. Rising nutraceutical demand for anthocyanin-rich extracts, supported by processor pre-purchase agreements, further boosts the red berries market by offering alternative revenue streams during periods of fresh-market oversupply[1]Source: United States Department of Agriculture, “Climate-Smart Agriculture and Forestry Partnership Program,” usda.gov.
Key Report Takeaways
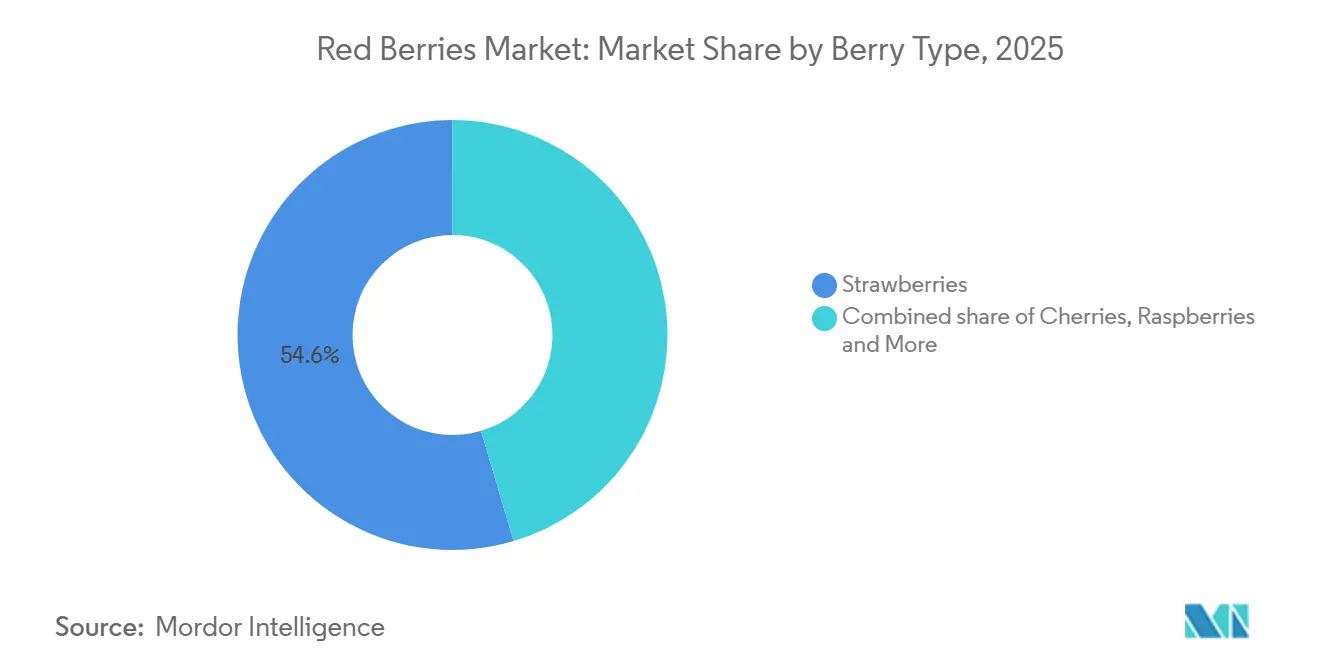
- By berry type, strawberries led with 54.6% of the red berries market share in 2025, and raspberries recorded the fastest growth with a 4.1% CAGR through 2031.
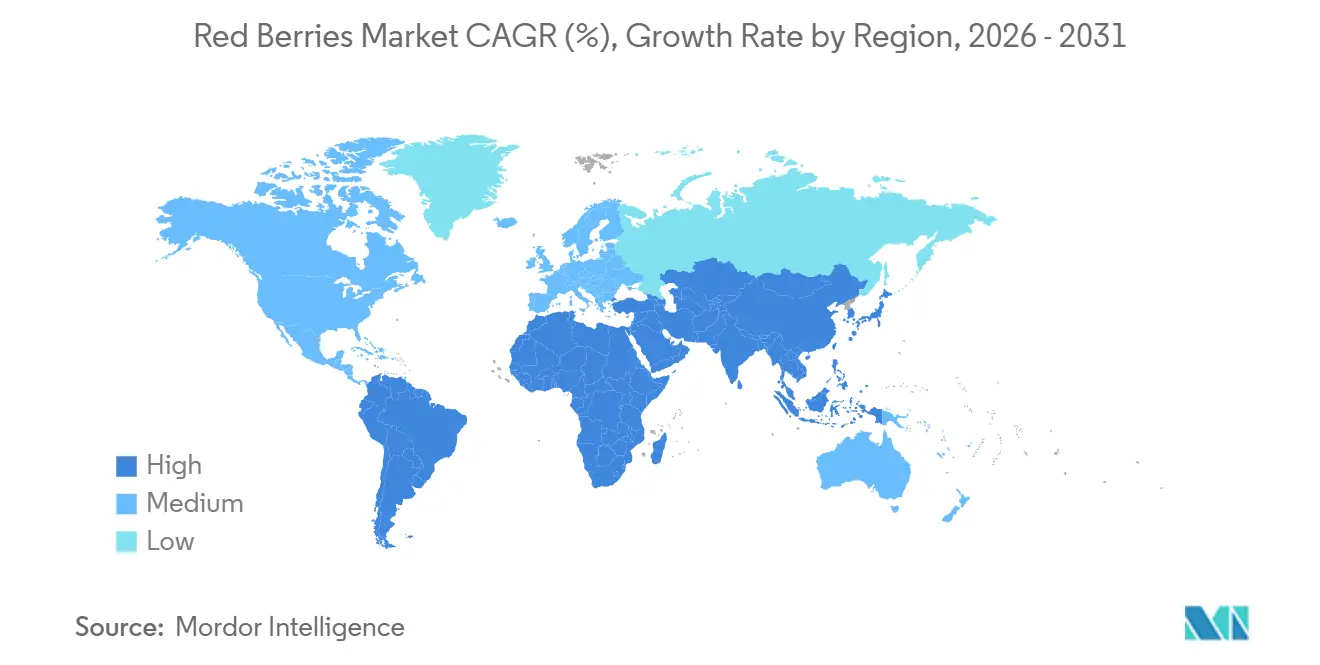
- By geography, Europe accounted for 31.2% of the red berries market size in 2025, and Asia-Pacific registered the highest projected CAGR at 4.2% to 2031.
Note: Market size and forecast figures in this report are generated using Mordor Intelligence’s proprietary estimation framework, updated with the latest available data and insights as of January 2026.
Global Red Berries Market Trends and Insights
Drivers Impact Analysis*
| Driver | (~) % Impact on CAGR Forecast | Geographic Relevance | Impact Timeline |
|---|---|---|---|
| Climate-resilient cultivars adoption | +0.6% | United States, Spain, Chile, and Australia | Medium term (2 to 4 years) |
| Expansion of vertical farming acreage | +0.7% | North America and Asia-Pacific | Short term (≤ 2 years) |
| Controlled-release fertigation practices | +0.5% | Europe and Middle East, expanding to South America | Medium term (2 to 4 years) |
| Government subsidies for perennial crops | +0.5% | North America, South America, and Asia-Pacific | Long term (≥ 4 years) |
| Demand from nutraceutical processors | +0.6% | North America and Europe with global sourcing | Medium term (2 to 4 years) |
| Fresh-convenience retail partnerships | +0.5% | North America and Europe with global influence | Short term (≤ 2 years) |
| Source: Mordor Intelligence | |||
Climate-Resilient Cultivars Adoption
Public breeding programs are reshaping berry cultivation by introducing resilient varieties that withstand heat, drought, and disease pressures. New strawberry and raspberry lines maintain fruit quality even in warmer growing seasons, while saline‑tolerant cultivars released in Spain have unlocked coastal acreage once considered unsuitable. In May 2025, the United Nations Industrial Development Organization (UNIDO) reported climate‑resilient berry value chain initiatives in Ukraine[2]Source: United Nations Industrial Development Organization (UNIDO), “Fostering Climate Resilience in Berries and Nuts Value Chain”, unido.org. Chilean researchers have strengthened raspberries against fungal damage by crossbreeding with wild relatives, and trials in Australia have shown that drought‑tolerant lines can sustain strong yields under water stress. In September 2025, the University of British Columbia (UBC) highlighted sustainable berry projects in Canada. These innovations highlight how science is securing future supply chains and reducing resource use.
Expansion of Vertical Farming Acreage
Indoor berry production has shifted from experimental pilots to full commercial scale, transforming supply chains and consumer access. Leading companies have invested in vertical farming facilities that deliver multiple harvests annually, far surpassing traditional field crops. Premium brands have expanded capacity to meet growing demand in retail, positioning fresh indoor berries as a high‑value alternative. In China, controlled‑environment farms are using spectrum‑tuned lighting to enhance nutritional qualities while eliminating pesticide use. In September 2024, Plenty Unlimited announced the opening of the world’s first large‑scale indoor vertical berry farm, marking a milestone in protected cultivation. Despite high build‑out costs, declining LED prices and modular rack systems are lowering barriers, expanding the red berry market beyond conventional farmland.
Controlled-Release Fertigation Practices
Nutrient management in berry cultivation is undergoing a transformation, with innovative practices reducing environmental impact while maintaining crop quality. Growers are adopting slow‑release fertilizers that minimize leaching into groundwater, ensuring sustainability without compromising yields. Fertigation systems paired with soil sensors and polymer‑coated nutrients are improving efficiency, cutting down on repeated applications and enhancing plant health. Research in protected environments has demonstrated gains in fruit firmness and shelf life, offering better quality for consumers and retailers. Controlled‑release potassium sources are helping stabilize sugar levels in berries, ensuring higher export grades and fewer rejections. Together, these advances highlight how modern nutrient strategies are reshaping berry production with greater resilience, sustainability, and market competitiveness.
Government Subsidies for Perennial Fruit Crops
Climate‑smart subsidy programs are reshaping perennial fruit production by easing financial barriers and accelerating orchard establishment. Governments are supporting growers with cost‑sharing schemes for irrigation and protective structures, ensuring resilience against climate risks while maintaining productivity. Long‑term loan programs are helping farmers spread repayment across orchard maturation, making investment more accessible. Matching grants tied to planting stock and cold‑storage facilities are strengthening supply chains and improving export readiness. Protected cultivation initiatives are reducing vulnerability to frost, hail, and other weather extremes, safeguarding yields in sensitive regions. These measures highlight how targeted subsidies are shortening break‑even timelines, encouraging sustainable practices, and expanding opportunities for growers in the perennial fruit crop sector.
Restraints Impact Analysis*
| Restraint | (~) % Impact on CAGR Forecast | Geographic Relevance | Impact Timeline |
|---|---|---|---|
| Pollinator population decline | -0.4% | North America and Europe with global knock-on effects | Medium term (2 to 4 years) |
| High perishability in export logistics | -0.3% | South America to Asia-Pacific corridors | Short term (≤ 2 years) |
| Labor scarcity during harvest windows | -0.5% | North America, Europe, and Australia | Medium term (2 to 4 years) |
| Volatile farm-gate pricing cycles | -0.3% | North America and South America prominent, global relevance | Short term (≤ 2 years) |
| Source: Mordor Intelligence | |||
Pollinator Population Decline
Pollinator management has become a critical issue in berry production, with managed honeybee colonies declining due to pests, pesticide exposure, and habitat loss. Rising hive rental costs have added pressure to growers, particularly in regions reliant on pollination services. In 2025, Michigan State University reported high honeybee colony losses and outlined strategies for farmers and growers to support pollinator health[3]Source: Michigan State University Extension, “Reports of High Honey Bee Colony Losses and How Farmers and Growers Can Support Honey Bees”, canr.msu.edu. Assessments in Europe have shown reduced wild pollinator abundance, increasing yield risks for fruit crops. Growers in South America have turned to imports of managed colonies, incurring quarantine expenses and higher pollination bills. To mitigate these challenges, many producers are planting self‑compatible cultivars, though this often comes with lower yields.
High Perishability in Export Logistics
Berry firmness tends to decline quickly after harvest, making even minor temperature fluctuations costly for growers and exporters. Delays at ports have eroded margins for shipments, while quality assessments in key markets have highlighted bruising and mold as recurring issues that lead to discounts and rejections. Cooperative groups have adopted modified‑atmosphere packaging to extend shelf life, reducing losses but adding extra costs to packing operations. Exporters have also invested in humidity‑controlled cold storage to cut spoilage, though such infrastructure requires significant financial commitments and longer recovery timelines. These measures illustrate how supply chain innovations are being deployed to protect berry quality, stabilize export grades, and sustain competitiveness in increasingly demanding global markets.
*Our forecasts treat driver/restraint impacts as directional, not additive. The impact forecasts reflect baseline growth, mix effects, and variable interactions.
Segment Analysis
By Berry Type: Technology Elevates Strawberries and Lifts Raspberries
Strawberries accounted for 54.6% of the red berries market size in 2025, supported by multi-zone cultivation that ensures a year-round supply and diversified applications across fresh, frozen, and processed product lines. The segment benefits from day-neutral cultivars, which fruit under controlled light cycles, enabling vertical farms to achieve up to fifteen harvests per year and expanding retail availability in urban centers.
Raspberries, while smaller in scale, are projected to grow at the fastest rate of 4.1% through 2031, driven by nutraceutical contracts that secure offtake for high-anthocyanin varieties and by primocane genetics that reduce the time to first harvest to six months. Cherries rank third in value, however, erratic late frosts in Turkey and Poland necessitate frost-mitigation systems costing up to USD 5,000 per acre, impacting profitability. Cranberries remain concentrated in North America, where a cooperative model controls 85% of processing, but slow juice demand limits expansion. Red currants and red grapes occupy niche positions, where red currants are primarily used in traditional European preserves, while red grapes serve fresh-table and wine markets, with the two markets intersecting only through extract processing.


Geography Analysis
In 2025, Europe led the red berries market share, accounting for 31.2% of revenue. Strong strawberry, raspberry, and cherry production was supported by integrated cold‑chain logistics that ensured rapid deliveries to major markets such as the United Kingdom, Germany, and France. Regional policies aimed at reducing pesticide use have accelerated the adoption of biological control, while water restrictions have prompted the adoption of drip irrigation and recycled wastewater systems. Cooperative initiatives have encouraged mechanization to offset rising labor costs. FAOSTAT data shows cherry production in Europe grew from 740,551 metric tons in 2021 to 790,424 metric tons in 2024, reflecting resilience and innovation in the sector. These measures reinforce Europe’s dominance in the red berry trade.
The Asia‑Pacific region is estimated to be the fastest‑growing market for the red berries market during 2026 to 2031, with an annual growth rate of 4.2%. The expansion of vertical farming in China and the adoption of protected cultivation in India have been central to this momentum, meeting rising urban demand for premium fruit. Controlled‑environment farming has reduced pesticide reliance while enhancing nutritional quality, and drip irrigation technologies have boosted yields in challenging climates. FAOSTAT data highlights that strawberry production in China increased from 3,724,242 metric tons in 2021 to 4,123,417 metric tons in 2024, underscoring the region’s rapid growth trajectory. Seasonal advantages in Australia have allowed exporters to capture high‑value markets across Southeast Asia, positioning Asia‑Pacific as the most dynamic red berry market globally.
North America maintained a significant share of the red berries market, with the United States and Mexico driving production and trade flows. Rising labor costs and water restrictions in California have shifted investment toward protected structures in Mexico, enhancing efficiency and output. South America has played a vital role, with Chile commanding premiums in Asian markets despite logistical challenges, while Brazil expanded strawberry cultivation through protected methods and subsidy programs. In the Middle East and Africa, Turkey sustained its leadership in cherry production, and the United Arab Emirates advanced urban farming initiatives to boost local supply.

Competitive Landscape
The stakeholders in the red berries market, a multi‑billion‑dollar commodity segment, are primarily producers, exporters, processors, and traders. Leading producers such as Driscoll’s operate across continents with proprietary genetics and integrated supply chains, ensuring consistent placement with major retailers such as Walmart, Costco, and Kroger. Hortifrut has expanded its South American presence through the acquisition of Camposol’s berry division, adding counter‑seasonal supply capacity. Ocean Spray has diversified into value‑added formats such as freeze‑dried powders for sports nutrition, while Costa Group has invested in water‑efficient substrate systems to serve premium Asian buyers. Vertical‑farm startups such as Oishii and iFarm are also emerging, offering pesticide‑free berries that command significant retail premiums.
Trading and processing stakeholders play a critical role in connecting production to global demand. Exporters in Chile, Peru, and Mexico leverage extended shelf‑life packaging innovations to reach Asia‑Pacific markets with minimal losses. Regional cooperatives and local traders supply organic and heirloom varieties to domestic markets, capturing price premiums through differentiation. Nutraceutical processors represent a growing demand segment, paying USD 4–6 per kilogram for high‑anthocyanin berries, which incentivizes producers to prioritize pigment content over fresh‑market appearance. These trading and processing dynamics highlight the importance of both global supply chains and localized niche markets.
Regulatory and market frameworks further shape stakeholder strategies. Compliance requirements under the EU’s Farm to Fork strategy and FDA traceability rules add costs but favor integrated operators who can absorb them across larger volumes. At the same time, urban agriculture developers are partnering with municipalities to convert warehouse roofs into productive acreage, shortening supply chains and reducing perishability risks. Taken together, producers, traders, processors, and local cooperatives illustrate how the red berries market rewards integration, innovation, and sustainability alignment, ensuring resilience in a commodity sector driven by both global exports and regional demand.
Recent Industry Developments
- March 2025: Brazil has approved the import of Korean strawberries, marking the first such agreement in South America. Korean growers can export their produce after completing facility registration and meeting pest control protocols. The agreement enables the export of varieties such as Seolhyang and Jukhyang to the Brazilian market.
- June 2024: Oishii launched Amatelas Farm, a 237,000-square-foot vertical strawberry farm in New Jersey. The solar-powered facility incorporates moving rack systems, robotics, and energy-efficient technologies. The farm produces 20 times more strawberries than its previous facility and utilizes machine learning algorithms to enhance pollination and harvest processes.
- February 2024: Angus Soft Fruits started commercial production of two AVA strawberry new varieties, Alicia and Catalina, in 2024. These varieties are specifically developed for Mediterranean winter growing conditions and feature enhanced disease resistance, longer shelf life, and maintain summer strawberry characteristics in taste and appearance.


Global Red Berries Market Report Scope
Red berries are small, red‑colored fruits such as strawberries, raspberries, cranberries, and others, consumed fresh. The Red Berries Market Report is Segmented by Berry Type (Strawberries, and More), and by Geography (North America, Europe, and More). The Study Includes Production Analysis (Volume), Consumption Analysis (Value and Volume), Export Analysis (Value and Volume), Import Analysis (Value and Volume), Wholesale Price Trend Analysis, Regulatory Framework, List of Key Players, Logistics and Infrastructure, and Seasonality Analysis. The Market Forecasts are Provided in Terms of Value (USD) and Volume (Metric Tons).
| Strawberries |
| Cherries |
| Raspberries |
| Cranberries |
| Red Currants |
| Red Grapes |
| North America | United States | Production Analysis (Area Harvested, Yield, and Production Volume) |
| Consumption Analysis (Consumption Value and Volume) | ||
| Import Market Analysis (Import Value, Volume, and Key Supplying Markets) | ||
| Export Market Analysis (Export Value, Volume, and Key Destination Markets) | ||
| Wholesale Price Trend Analysis and Forecast | ||
| Regulatory Framework | ||
| List of Key Players | ||
| Logistics and Infrastructure | ||
| Seasonality Analysis | ||
| Canada | Production Analysis (Area Harvested, Yield, and Production Volume) | |
| Consumption Analysis (Consumption Value and Volume) | ||
| Import Market Analysis (Import Value, Volume, and Key Supplying Markets) | ||
| Export Market Analysis (Export Value, Volume, and Key Destination Markets) | ||
| Wholesale Price Trend Analysis and Forecast | ||
| Regulatory Framework | ||
| List of Key Players | ||
| Logistics and Infrastructure | ||
| Seasonality Analysis | ||
| Mexico | Production Analysis (Area Harvested, Yield, and Production Volume) | |
| Consumption Analysis (Consumption Value and Volume) | ||
| Import Market Analysis (Import Value, Volume, and Key Supplying Markets) | ||
| Export Market Analysis (Export Value, Volume, and Key Destination Markets) | ||
| Wholesale Price Trend Analysis and Forecast | ||
| Regulatory Framework | ||
| List of Key Players | ||
| Logistics and Infrastructure | ||
| Seasonality Analysis | ||
| Europe | Germany | Production Analysis (Area Harvested, Yield, and Production Volume) |
| Consumption Analysis (Consumption Value and Volume) | ||
| Import Market Analysis (Import Value, Volume, and Key Supplying Markets) | ||
| Export Market Analysis (Export Value, Volume, and Key Destination Markets) | ||
| Wholesale Price Trend Analysis and Forecast | ||
| Regulatory Framework | ||
| List of Key Players | ||
| Logistics and Infrastructure | ||
| Seasonality Analysis | ||
| Spain | Production Analysis (Area Harvested, Yield, and Production Volume) | |
| Consumption Analysis (Consumption Value and Volume) | ||
| Import Market Analysis (Import Value, Volume, and Key Supplying Markets) | ||
| Export Market Analysis (Export Value, Volume, and Key Destination Markets) | ||
| Wholesale Price Trend Analysis and Forecast | ||
| Regulatory Framework | ||
| List of Key Players | ||
| Logistics and Infrastructure | ||
| Seasonality Analysis | ||
| Russia | Production Analysis (Area Harvested, Yield, and Production Volume) | |
| Consumption Analysis (Consumption Value and Volume) | ||
| Import Market Analysis (Import Value, Volume, and Key Supplying Markets) | ||
| Export Market Analysis (Export Value, Volume, and Key Destination Markets) | ||
| Wholesale Price Trend Analysis and Forecast | ||
| Regulatory Framework | ||
| List of Key Players | ||
| Logistics and Infrastructure | ||
| Seasonality Analysis | ||
| Poland | Production Analysis (Area Harvested, Yield, and Production Volume) | |
| Consumption Analysis (Consumption Value and Volume) | ||
| Import Market Analysis (Import Value, Volume, and Key Supplying Markets) | ||
| Export Market Analysis (Export Value, Volume, and Key Destination Markets) | ||
| Wholesale Price Trend Analysis and Forecast | ||
| Regulatory Framework | ||
| List of Key Players | ||
| Logistics and Infrastructure | ||
| Seasonality Analysis | ||
| France | Production Analysis (Area Harvested, Yield, and Production Volume) | |
| Consumption Analysis (Consumption Value and Volume) | ||
| Import Market Analysis (Import Value, Volume, and Key Supplying Markets) | ||
| Export Market Analysis (Export Value, Volume, and Key Destination Markets) | ||
| Wholesale Price Trend Analysis and Forecast | ||
| Regulatory Framework | ||
| List of Key Players | ||
| Logistics and Infrastructure | ||
| Seasonality Analysis | ||
| Asia-Pacific | China | Production Analysis (Area Harvested, Yield, and Production Volume) |
| Consumption Analysis (Consumption Value and Volume) | ||
| Import Market Analysis (Import Value, Volume, and Key Supplying Markets) | ||
| Export Market Analysis (Export Value, Volume, and Key Destination Markets) | ||
| Wholesale Price Trend Analysis and Forecast | ||
| Regulatory Framework | ||
| List of Key Players | ||
| Logistics and Infrastructure | ||
| Seasonality Analysis | ||
| India | Production Analysis (Area Harvested, Yield, and Production Volume) | |
| Consumption Analysis (Consumption Value and Volume) | ||
| Import Market Analysis (Import Value, Volume, and Key Supplying Markets) | ||
| Export Market Analysis (Export Value, Volume, and Key Destination Markets) | ||
| Wholesale Price Trend Analysis and Forecast | ||
| Regulatory Framework | ||
| List of Key Players | ||
| Logistics and Infrastructure | ||
| Seasonality Analysis | ||
| Australia | Production Analysis (Area Harvested, Yield, and Production Volume) | |
| Consumption Analysis (Consumption Value and Volume) | ||
| Import Market Analysis (Import Value, Volume, and Key Supplying Markets) | ||
| Export Market Analysis (Export Value, Volume, and Key Destination Markets) | ||
| Wholesale Price Trend Analysis and Forecast | ||
| Regulatory Framework | ||
| List of Key Players | ||
| Logistics and Infrastructure | ||
| Seasonality Analysis | ||
| New Zealand | Production Analysis (Area Harvested, Yield, and Production Volume) | |
| Consumption Analysis (Consumption Value and Volume) | ||
| Import Market Analysis (Import Value, Volume, and Key Supplying Markets) | ||
| Export Market Analysis (Export Value, Volume, and Key Destination Markets) | ||
| Wholesale Price Trend Analysis and Forecast | ||
| Regulatory Framework | ||
| List of Key Players | ||
| Logistics and Infrastructure | ||
| Seasonality Analysis | ||
| South America | Brazil | Production Analysis (Area Harvested, Yield, and Production Volume) |
| Consumption Analysis (Consumption Value and Volume) | ||
| Import Market Analysis (Import Value, Volume, and Key Supplying Markets) | ||
| Export Market Analysis (Export Value, Volume, and Key Destination Markets) | ||
| Wholesale Price Trend Analysis and Forecast | ||
| Regulatory Framework | ||
| List of Key Players | ||
| Logistics and Infrastructure | ||
| Seasonality Analysis | ||
| Chile | Production Analysis (Area Harvested, Yield, and Production Volume) | |
| Consumption Analysis (Consumption Value and Volume) | ||
| Import Market Analysis (Import Value, Volume, and Key Supplying Markets) | ||
| Export Market Analysis (Export Value, Volume, and Key Destination Markets) | ||
| Wholesale Price Trend Analysis and Forecast | ||
| Regulatory Framework | ||
| List of Key Players | ||
| Logistics and Infrastructure | ||
| Seasonality Analysis | ||
| Middle East | Turkey | Production Analysis (Area Harvested, Yield, and Production Volume) |
| Consumption Analysis (Consumption Value and Volume) | ||
| Import Market Analysis (Import Value, Volume, and Key Supplying Markets) | ||
| Export Market Analysis (Export Value, Volume, and Key Destination Markets) | ||
| Wholesale Price Trend Analysis and Forecast | ||
| Regulatory Framework | ||
| List of Key Players | ||
| Logistics and Infrastructure | ||
| Seasonality Analysis | ||
| Saudi Arabia | Production Analysis (Area Harvested, Yield, and Production Volume) | |
| Consumption Analysis (Consumption Value and Volume) | ||
| Import Market Analysis (Import Value, Volume, and Key Supplying Markets) | ||
| Export Market Analysis (Export Value, Volume, and Key Destination Markets) | ||
| Wholesale Price Trend Analysis and Forecast | ||
| Regulatory Framework | ||
| List of Key Players | ||
| Logistics and Infrastructure | ||
| Seasonality Analysis | ||
| United Arab Emirates | Production Analysis (Area Harvested, Yield, and Production Volume) | |
| Consumption Analysis (Consumption Value and Volume) | ||
| Import Market Analysis (Import Value, Volume, and Key Supplying Markets) | ||
| Export Market Analysis (Export Value, Volume, and Key Destination Markets) | ||
| Wholesale Price Trend Analysis and Forecast | ||
| Regulatory Framework | ||
| List of Key Players | ||
| Logistics and Infrastructure | ||
| Seasonality Analysis | ||
| Africa | Egypt | Production Analysis (Area Harvested, Yield, and Production Volume) |
| Consumption Analysis (Consumption Value and Volume) | ||
| Import Market Analysis (Import Value, Volume, and Key Supplying Markets) | ||
| Export Market Analysis (Export Value, Volume, and Key Destination Markets) | ||
| Wholesale Price Trend Analysis and Forecast | ||
| Regulatory Framework | ||
| List of Key Players | ||
| Logistics and Infrastructure | ||
| Seasonality Analysis | ||
| South Africa | Production Analysis (Area Harvested, Yield, and Production Volume) | |
| Consumption Analysis (Consumption Value and Volume) | ||
| Import Market Analysis (Import Value, Volume, and Key Supplying Markets) | ||
| Export Market Analysis (Export Value, Volume, and Key Destination Markets) | ||
| Wholesale Price Trend Analysis and Forecast | ||
| Regulatory Framework | ||
| List of Key Players | ||
| Logistics and Infrastructure | ||
| Seasonality Analysis | ||
| By Berry Type | Strawberries | ||
| Cherries | |||
| Raspberries | |||
| Cranberries | |||
| Red Currants | |||
| Red Grapes | |||
| By Geography | North America | United States | Production Analysis (Area Harvested, Yield, and Production Volume) |
| Consumption Analysis (Consumption Value and Volume) | |||
| Import Market Analysis (Import Value, Volume, and Key Supplying Markets) | |||
| Export Market Analysis (Export Value, Volume, and Key Destination Markets) | |||
| Wholesale Price Trend Analysis and Forecast | |||
| Regulatory Framework | |||
| List of Key Players | |||
| Logistics and Infrastructure | |||
| Seasonality Analysis | |||
| Canada | Production Analysis (Area Harvested, Yield, and Production Volume) | ||
| Consumption Analysis (Consumption Value and Volume) | |||
| Import Market Analysis (Import Value, Volume, and Key Supplying Markets) | |||
| Export Market Analysis (Export Value, Volume, and Key Destination Markets) | |||
| Wholesale Price Trend Analysis and Forecast | |||
| Regulatory Framework | |||
| List of Key Players | |||
| Logistics and Infrastructure | |||
| Seasonality Analysis | |||
| Mexico | Production Analysis (Area Harvested, Yield, and Production Volume) | ||
| Consumption Analysis (Consumption Value and Volume) | |||
| Import Market Analysis (Import Value, Volume, and Key Supplying Markets) | |||
| Export Market Analysis (Export Value, Volume, and Key Destination Markets) | |||
| Wholesale Price Trend Analysis and Forecast | |||
| Regulatory Framework | |||
| List of Key Players | |||
| Logistics and Infrastructure | |||
| Seasonality Analysis | |||
| Europe | Germany | Production Analysis (Area Harvested, Yield, and Production Volume) | |
| Consumption Analysis (Consumption Value and Volume) | |||
| Import Market Analysis (Import Value, Volume, and Key Supplying Markets) | |||
| Export Market Analysis (Export Value, Volume, and Key Destination Markets) | |||
| Wholesale Price Trend Analysis and Forecast | |||
| Regulatory Framework | |||
| List of Key Players | |||
| Logistics and Infrastructure | |||
| Seasonality Analysis | |||
| Spain | Production Analysis (Area Harvested, Yield, and Production Volume) | ||
| Consumption Analysis (Consumption Value and Volume) | |||
| Import Market Analysis (Import Value, Volume, and Key Supplying Markets) | |||
| Export Market Analysis (Export Value, Volume, and Key Destination Markets) | |||
| Wholesale Price Trend Analysis and Forecast | |||
| Regulatory Framework | |||
| List of Key Players | |||
| Logistics and Infrastructure | |||
| Seasonality Analysis | |||
| Russia | Production Analysis (Area Harvested, Yield, and Production Volume) | ||
| Consumption Analysis (Consumption Value and Volume) | |||
| Import Market Analysis (Import Value, Volume, and Key Supplying Markets) | |||
| Export Market Analysis (Export Value, Volume, and Key Destination Markets) | |||
| Wholesale Price Trend Analysis and Forecast | |||
| Regulatory Framework | |||
| List of Key Players | |||
| Logistics and Infrastructure | |||
| Seasonality Analysis | |||
| Poland | Production Analysis (Area Harvested, Yield, and Production Volume) | ||
| Consumption Analysis (Consumption Value and Volume) | |||
| Import Market Analysis (Import Value, Volume, and Key Supplying Markets) | |||
| Export Market Analysis (Export Value, Volume, and Key Destination Markets) | |||
| Wholesale Price Trend Analysis and Forecast | |||
| Regulatory Framework | |||
| List of Key Players | |||
| Logistics and Infrastructure | |||
| Seasonality Analysis | |||
| France | Production Analysis (Area Harvested, Yield, and Production Volume) | ||
| Consumption Analysis (Consumption Value and Volume) | |||
| Import Market Analysis (Import Value, Volume, and Key Supplying Markets) | |||
| Export Market Analysis (Export Value, Volume, and Key Destination Markets) | |||
| Wholesale Price Trend Analysis and Forecast | |||
| Regulatory Framework | |||
| List of Key Players | |||
| Logistics and Infrastructure | |||
| Seasonality Analysis | |||
| Asia-Pacific | China | Production Analysis (Area Harvested, Yield, and Production Volume) | |
| Consumption Analysis (Consumption Value and Volume) | |||
| Import Market Analysis (Import Value, Volume, and Key Supplying Markets) | |||
| Export Market Analysis (Export Value, Volume, and Key Destination Markets) | |||
| Wholesale Price Trend Analysis and Forecast | |||
| Regulatory Framework | |||
| List of Key Players | |||
| Logistics and Infrastructure | |||
| Seasonality Analysis | |||
| India | Production Analysis (Area Harvested, Yield, and Production Volume) | ||
| Consumption Analysis (Consumption Value and Volume) | |||
| Import Market Analysis (Import Value, Volume, and Key Supplying Markets) | |||
| Export Market Analysis (Export Value, Volume, and Key Destination Markets) | |||
| Wholesale Price Trend Analysis and Forecast | |||
| Regulatory Framework | |||
| List of Key Players | |||
| Logistics and Infrastructure | |||
| Seasonality Analysis | |||
| Australia | Production Analysis (Area Harvested, Yield, and Production Volume) | ||
| Consumption Analysis (Consumption Value and Volume) | |||
| Import Market Analysis (Import Value, Volume, and Key Supplying Markets) | |||
| Export Market Analysis (Export Value, Volume, and Key Destination Markets) | |||
| Wholesale Price Trend Analysis and Forecast | |||
| Regulatory Framework | |||
| List of Key Players | |||
| Logistics and Infrastructure | |||
| Seasonality Analysis | |||
| New Zealand | Production Analysis (Area Harvested, Yield, and Production Volume) | ||
| Consumption Analysis (Consumption Value and Volume) | |||
| Import Market Analysis (Import Value, Volume, and Key Supplying Markets) | |||
| Export Market Analysis (Export Value, Volume, and Key Destination Markets) | |||
| Wholesale Price Trend Analysis and Forecast | |||
| Regulatory Framework | |||
| List of Key Players | |||
| Logistics and Infrastructure | |||
| Seasonality Analysis | |||
| South America | Brazil | Production Analysis (Area Harvested, Yield, and Production Volume) | |
| Consumption Analysis (Consumption Value and Volume) | |||
| Import Market Analysis (Import Value, Volume, and Key Supplying Markets) | |||
| Export Market Analysis (Export Value, Volume, and Key Destination Markets) | |||
| Wholesale Price Trend Analysis and Forecast | |||
| Regulatory Framework | |||
| List of Key Players | |||
| Logistics and Infrastructure | |||
| Seasonality Analysis | |||
| Chile | Production Analysis (Area Harvested, Yield, and Production Volume) | ||
| Consumption Analysis (Consumption Value and Volume) | |||
| Import Market Analysis (Import Value, Volume, and Key Supplying Markets) | |||
| Export Market Analysis (Export Value, Volume, and Key Destination Markets) | |||
| Wholesale Price Trend Analysis and Forecast | |||
| Regulatory Framework | |||
| List of Key Players | |||
| Logistics and Infrastructure | |||
| Seasonality Analysis | |||
| Middle East | Turkey | Production Analysis (Area Harvested, Yield, and Production Volume) | |
| Consumption Analysis (Consumption Value and Volume) | |||
| Import Market Analysis (Import Value, Volume, and Key Supplying Markets) | |||
| Export Market Analysis (Export Value, Volume, and Key Destination Markets) | |||
| Wholesale Price Trend Analysis and Forecast | |||
| Regulatory Framework | |||
| List of Key Players | |||
| Logistics and Infrastructure | |||
| Seasonality Analysis | |||
| Saudi Arabia | Production Analysis (Area Harvested, Yield, and Production Volume) | ||
| Consumption Analysis (Consumption Value and Volume) | |||
| Import Market Analysis (Import Value, Volume, and Key Supplying Markets) | |||
| Export Market Analysis (Export Value, Volume, and Key Destination Markets) | |||
| Wholesale Price Trend Analysis and Forecast | |||
| Regulatory Framework | |||
| List of Key Players | |||
| Logistics and Infrastructure | |||
| Seasonality Analysis | |||
| United Arab Emirates | Production Analysis (Area Harvested, Yield, and Production Volume) | ||
| Consumption Analysis (Consumption Value and Volume) | |||
| Import Market Analysis (Import Value, Volume, and Key Supplying Markets) | |||
| Export Market Analysis (Export Value, Volume, and Key Destination Markets) | |||
| Wholesale Price Trend Analysis and Forecast | |||
| Regulatory Framework | |||
| List of Key Players | |||
| Logistics and Infrastructure | |||
| Seasonality Analysis | |||
| Africa | Egypt | Production Analysis (Area Harvested, Yield, and Production Volume) | |
| Consumption Analysis (Consumption Value and Volume) | |||
| Import Market Analysis (Import Value, Volume, and Key Supplying Markets) | |||
| Export Market Analysis (Export Value, Volume, and Key Destination Markets) | |||
| Wholesale Price Trend Analysis and Forecast | |||
| Regulatory Framework | |||
| List of Key Players | |||
| Logistics and Infrastructure | |||
| Seasonality Analysis | |||
| South Africa | Production Analysis (Area Harvested, Yield, and Production Volume) | ||
| Consumption Analysis (Consumption Value and Volume) | |||
| Import Market Analysis (Import Value, Volume, and Key Supplying Markets) | |||
| Export Market Analysis (Export Value, Volume, and Key Destination Markets) | |||
| Wholesale Price Trend Analysis and Forecast | |||
| Regulatory Framework | |||
| List of Key Players | |||
| Logistics and Infrastructure | |||
| Seasonality Analysis | |||


Key Questions Answered in the Report
How large is the global red berries market in 2025?
The red berries market size reached USD 28.40 billion in 2026 and is projected to hit USD 34.30 billion by 2031.
Which berry type holds the biggest sales share?
Strawberries command 54.6% of global sales because year-round indoor production supports consistent supply and premium positioning.
Which region is expanding fastest?
Asia-Pacific is growing at a 4.2% CAGR through 2030 thanks to rapid acreage gains in China and rising health awareness among urban consumers.
What technology trend is reshaping supply?
Vertical farming is transforming production economics by delivering high yields with minimal water and pesticide use while locating farms near major cities.
Why are pollinators a constraint for growers?
Bee population declines reduce fruit set and quality, forcing growers to rent additional hives and invest in habitat restoration, which raises production costs.
Page last updated on:


