Cranberries Market Size and Share
Cranberries Market Analysis by Mordor Intelligence
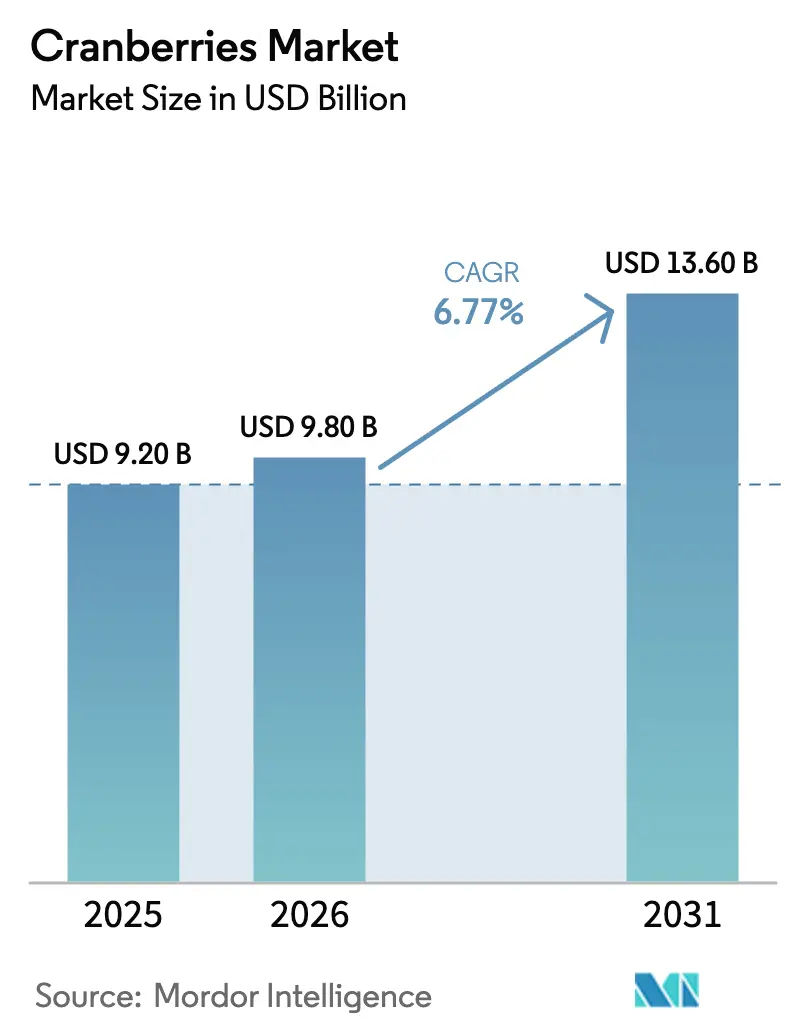
The cranberries market size is projected to expand from USD 9.2 billion in 2025 and USD 9.8 billion in 2026 to USD 13.6 billion by 2031, registering a CAGR of 6.77% between 2026 to 2031. The increasing demand for clean-label ingredients in nutraceuticals, beverages, and snacks is expanding the consumer base for cranberries. North America held a significant share of the global consumption value in 2025, led by the United States, which combines the largest global harvest with strong domestic demand. The Asia-Pacific region is the fastest-growing consumer market, driven by China's simplified regulations for importing frozen fruit and enhanced cold-chain infrastructure. Challenges such as limited pollination resources and regional fertilizer constraints are increasing production costs. Nevertheless, advancements in precision irrigation, drone scouting, and carbon credit programs are improving farm profitability. Additionally, the growing awareness of the health benefits associated with cranberries, including their antioxidant properties and their role in maintaining urinary tract health, is further driving demand. The increasing incorporation of cranberries in functional foods and beverages is also contributing to market growth, as consumers seek products that offer both nutritional value and convenience.
Key Report Takeaways
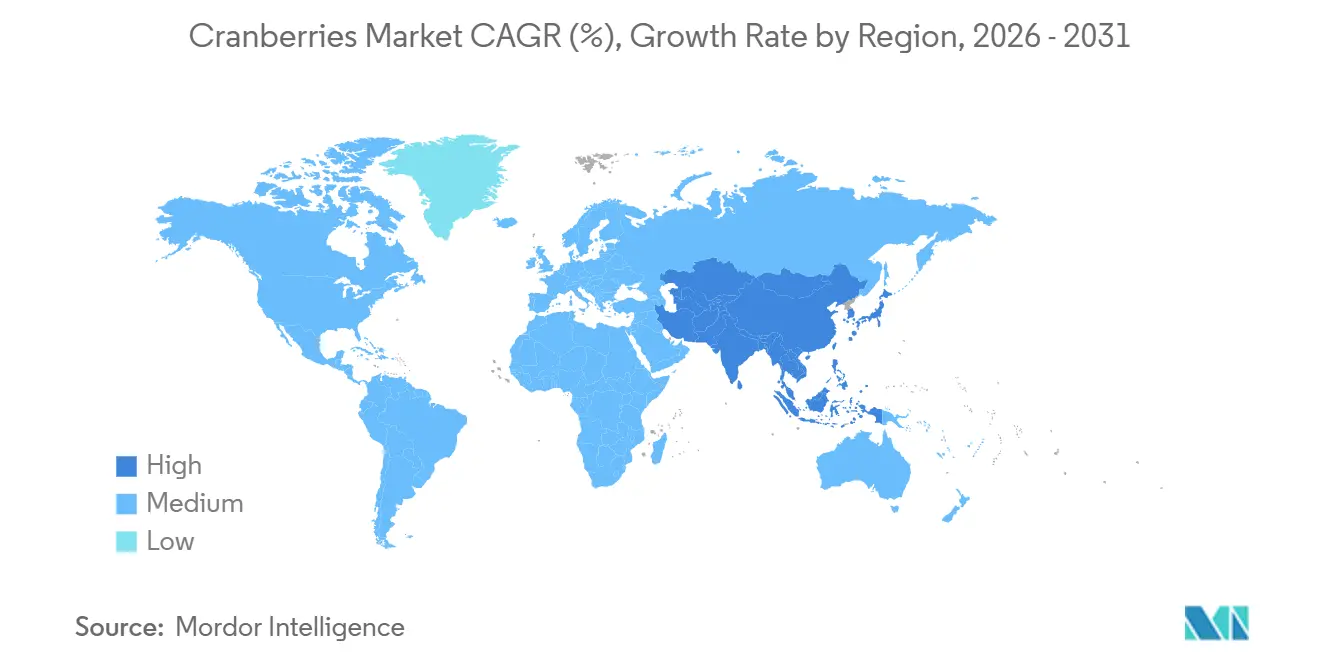
By geography, North America accounted for 46% of the cranberries market size in 2025, whereas the Asia-Pacific region is poised for the fastest 11.0% CAGR through 2031.
Note: Market size and forecast figures in this report are generated using Mordor Intelligence’s proprietary estimation framework, updated with the latest available data and insights as of January 2026.
Global Cranberries Market Trends and Insights
Drivers Impact Analysis*
| Driver | (~) % Impact on CAGR Forecast | Geographic Relevance | Impact Timeline |
|---|---|---|---|
| Accelerating demand from nutraceutical and functional beverage formulators | +1.8% | North America and Europe | Medium term (2-4 years) |
| Growing popularity of dried‐cranberry substitutes driving fresh brand visibility | +1.2% | North America and Asia-Pacific | Short term (≤ 2 years) |
| Rising adoption of cranberries as natural antioxidants and colorants | +1.5% | Europe and North America | Medium term (2-4 years) |
| Expansion of direct-to-consumer e-commerce for bulk produce | +0.9% | Asia-Pacific spillover to North America | Short term (≤ 2 years) |
| Precision-flood harvesting boosting yields in colder latitudes | +0.7% | United States, Canada, Netherlands, and Russia | Long term (≥ 4 years) |
| Wetland carbon-credit programs increasing bog profitability | +0.5% | North America and Europe | Long term (≥ 4 years) |
| Source: Mordor Intelligence | |||
Accelerating Demand from Nutraceutical and Functional Beverage Formulators
Manufacturers are incorporating cranberry extracts rich in A-type proanthocyanidins into supplement capsules, ready-to-drink beverages, and protein powders to address consumer demand for clinically supported urinary tract health benefits. Clinical studies validate the effectiveness of proanthocyanidins (PACs) in reducing the recurrence of urinary tract infections. The European Food Safety Authority declined to approve a health claim for Pacran in prior evaluations, citing insufficient mechanistic data [1]Source: European Food Safety Authority, “Scientific Opinions on Health Claims,” EFSA.EUROPA.EU. This regulatory caution has not dampened commercial interest. Beverage companies are reformulating products with cranberry juice concentrate as a substitute for synthetic ascorbic acid, aiming to capitalize on clean-label preferences. Fresh cranberries provide anthocyanin and flavonol profiles, which are extracted by processors for these applications, creating a competing demand channel alongside juice-processing allocations. This trend is particularly evident in North America and Europe, where supplement usage exceeds 50% of adults, and functional beverage launches experienced double-digit growth in 2024 and 2025.
Precision-Flood Harvesting Boosting Yields in Colder Latitudes
Growers in regions such as Wisconsin, Quebec, and the Netherlands are utilizing soil moisture sensors, weather station networks, and automated flood control gates to optimize water application during frost protection and flood irrigation during harvest. These precision techniques reduce water waste by 20% to 30% and enhance berry quality by preventing over-saturation, which can dilute anthocyanin content. The United States Department of Agriculture (USDA), through projects running from 2020 to 2025, has validated frost-protection models that growers now integrate into decision-support software. Quebec achieved record yields of 26,000 pounds per acre in 2024, partly due to the adoption of these systems, which enable growers to align flood timing with varietal phenology. In Massachusetts, a 25% tax credit, capped at USD 100,000, is available for bog renovation and irrigation automation, encouraging capital investment. This technology has limited applicability in Chile and other warmer regions where frost risk is negligible, restricting its geographic adoption.
Wetland Carbon-Credit Programs Increasing Bog Profitability
Cranberry bogs are recognized as wetland ecosystems under voluntary carbon-certification frameworks, including the European Union Carbon Certification Framework established by Regulation 2024/3012. This framework requires five-year project commitments, verification of additionality, and third-party monitoring[2]Source: European Commission, “Agricultural Statistics,” EC.EUROPA.EU . Growers in regions such as Massachusetts and Quebec are participating in carbon-offset programs that provide payments ranging from USD 15 to USD 30 per metric ton of CO2-equivalent sequestered annually. These payments serve as a supplementary income source, enhancing the financial viability of maintaining cranberry bogs rather than converting them into solar installations or residential developments. The European Union framework emphasizes soil emission reductions and biodiversity co-benefits, which align well with the low-tillage and perennial characteristics of cranberry production. Program participation remains limited, with less than 10% of total acreage enrolled. This is primarily due to the administrative burden of documentation and uncertainties surrounding credit pricing. As corporate net-zero commitments increase, the demand for high-quality agricultural carbon credits is projected to grow, potentially doubling offset prices by 2028.
Growing Popularity of Dried-Cranberry Substitutes Driving Fresh Brand Visibility
The retail expansion of dried cranberries in trail mixes, granola bars, and snack packs has familiarized consumers with cranberry flavor profiles, thereby lowering barriers to fresh-fruit trial. Grocers report that shoppers who purchase dried cranberries exhibit 30% higher conversion rates for fresh berries during harvest season, as they seek whole-fruit alternatives to sugar-infused dried variants. This cross-category halo effect is particularly strong in the Asia-Pacific region, where cranberries were historically a niche product. E-commerce platforms in China now feature fresh cranberries in premium gift boxes during the Lunar New Year, capitalizing on the berry's red color and health associations. The August 2024 removal of quarantine requirements for frozen cranberries in China further accelerated this trend, enabling year-round availability and reducing logistics friction.
Restraints Impact Analysis*
| Restraint | (~) % Impact on CAGR Forecast | Geographic Relevance | Impact Timeline |
|---|---|---|---|
| High capital and operating costs of commercial bog cultivation | −1.1% | North America and Europe | Long term (≥ 4 years) |
| Low consumer awareness in developing economies | −0.8% | Africa, Middle East, and South America | Medium term (2-4 years) |
| Declining native-bee populations raising pollination costs | −0.6% | Global, acute in North America | Short term (≤ 2 years) |
| Fertilizer-sulfate restrictions disrupting yield optimization | −0.4% | Massachusetts, Cape Cod, and Europe | Medium term (2-4 years) |
| Source: Mordor Intelligence | |||
Low Consumer Awareness in Developing Economies
Cranberries lack a culinary tradition in Africa, the Middle East, and much of South America, where local berries and tropical fruits are more prevalent in diets. Retail penetration remains below 5% in these regions, and fresh cranberries are often absent from supermarket produce sections, except in expatriate-focused stores. Consumer education campaigns are costly and require sustained investment, which small exporters cannot afford. Chile, despite being the third-largest producer, exports over 90% of its crop to North America and Europe, reflecting weak domestic demand. In Kenya and South Africa, imported cranberries face tariff and logistics costs that price them above local alternatives, such as Cape gooseberries. The Middle East exhibits modest growth potential, with Turkey and Azerbaijan experimenting with domestic cultivation, but production remains negligible. Without government-led nutrition programs or retailer-funded sampling initiatives, awareness will remain a binding constraint on demand growth in these geographies through 2031.
Fertilizer-Sulfate Restrictions Disrupting Yield Optimization
Cranberries thrive in acidic soils with a pH between 4.0 and 5.5, which is typically maintained through the application of elemental sulfur or ammonium sulfate. Massachusetts Department of Environmental Protection regulations limit sulfate loading near Cape Cod aquifers, where elevated sulfate levels pose a threat to drinking-water quality. Growers must adopt alternative acidification methods, such as sulfuric acid injection or organic amendments like peat moss, which are more expensive and labor-intensive. Nitrogen application is also restricted within setback zones of 3 meters from watercourses, which reduces fertilizer efficiency and forces growers to rely on precision application technologies. These constraints are most binding in Massachusetts, where 40% of bogs lie within regulated watersheds. Europe's Farm to Fork Strategy targets a 20% reduction in fertilizer use by 2030, adding pressure on Dutch and German growers to adopt nutrient-recycling systems.
*Our forecasts treat driver/restraint impacts as directional, not additive. The impact forecasts reflect baseline growth, mix effects, and variable interactions.
Geography Analysis
North America accounted for 46% of the cranberries market size in 2025, with the United States and Canada collectively dominating the majority. The region exhibits mature market dynamics, characterized by growth driven by premiumization, organic expansion, and export diversification. Quebec's 2024 production surge to 154,288 metric tons, driven by record yields of 26,000 pounds per acre, positions Canada to capture incremental export share in Europe and Asia [3]Source: Statistics Canada, “Fruit Production Statistics 2024,” STATCAN.GC.CA. The United States' 2025 production totaled 8.13 million barrels, reflecting a 9% decrease from 2024. This decline highlights the impact of weather volatility and emphasizes the importance of developing climate-resilient cultivars.
The Asia-Pacific region is expanding at 11% CAGR through 2031, driven by China's August 2024 removal of quarantine requirements for frozen fruit, which has unlocked a year-round supply. This has enabled e-commerce platforms like Alibaba's Freshippo to feature cranberries in premium gift assortments. Japan and South Korea are experiencing growth, with cranberries being positioned as functional ingredients in supplements and beverages that target urinary-tract health and antioxidant benefits. SF Express and JD Logistics are investing in cold-chain infrastructure, including the construction of new refrigerated warehouses, upgrading existing facilities, and expanding fleets of temperature-controlled vehicles. These investments aim to increase refrigerated capacity by 25% annually from 2024 to 2026. These efforts are reducing spoilage and facilitating direct-to-consumer deliveries within 24 hours in major cities.
Europe's cranberry market is influenced by Germany, the United Kingdom, and the Netherlands, which act as key re-export hubs. While the region experiences slower population growth and high baseline consumption, the European Union's Farm to Fork Strategy, aiming for a 50% reduction in pesticide use by 2030, is boosting demand for organic cranberries. These organic products typically command price premiums ranging from 30% to 50%. In South America, Chile plays a significant role in meeting counter-seasonal demand for organic cranberries in North America and Europe. In Africa and the Middle East, the market faces challenges due to low consumer awareness and limited retail penetration. However, Turkey's experimental cultivation efforts in the Rize and Artvin provinces could establish a regional supply by 2028.


Competitive Landscape
The cranberries market encompasses producers, importers, exporters, and other stakeholders. Ocean Spray Cranberries Inc. leads the market through its cooperative structure, which includes 700 family farmers across North America. This model ensures a consistent supply and facilitates product distribution to over 70 countries. While the cooperative structure shields Ocean Spray from spot-price volatility, it restricts flexibility in shifting toward high-margin fresh-market channels, as member growers prioritize volume contracts for juice and dried-fruit processing. Decas Cranberry Products Inc., a key market player, operates as an independent processor, enabling it to allocate fresh cranberries for applications such as natural colorant extraction and functional ingredient production, capitalizing on the clean-label segment. Cliffstar LLC, a subsidiary of Refresco, holds a significant share by sourcing fresh cranberries for contract beverage manufacturing. Additionally, Cape Cod Select LLC and Patience Fruit and Co. focus on premium fresh-pack retail and organic market niches, respectively.
The termination of the United States Department of Agriculture's Marketing Order No. 929 in July 2024 has decentralized collective promotional efforts, shifting export-market development costs to individual firms and state specialty crop block grants. Opportunities in the market include direct-to-consumer e-commerce, organic certification, and carbon credit monetization. Growers implementing precision irrigation and drone-based pest monitoring have reduced input costs by 15% to 20% while enhancing berry quality, providing a competitive edge in fresh-market channels. The European Union Carbon Certification Framework, effective as of 2024, enables cranberry bogs to generate offset credits. Early adopters in Massachusetts and Quebec have enrolled acreage, earning USD 15 to USD 30 per metric ton of CO2-equivalent, further strengthening their market position.
Smaller players, such as Fruit d'Or Inc. in Quebec and Cran Chile SA, are expanding organic production to meet the demand from European processors, who are replacing synthetic colorants with cranberry anthocyanins. Technology adoption across the industry remains uneven. Larger cooperatives are investing in automated harvesting equipment and upgrading their cold storage facilities, while smaller growers often rely on manual labor and third-party logistics. This reliance limits their ability to meet retailer quality standards for fresh berries, presenting challenges in the competitive market landscape.
Recent Industry Developments
- September 2025: The Cranberry Institute has appointed Orissa International to assist in launching a United States cranberry marketing program in Southeast Asia. The program seeks to raise awareness and promote the consumption of United States cranberries in key markets, including Malaysia, Singapore, Thailand, and Vietnam, through strategic partnerships and consumer education initiatives. This initiative aims to expand export opportunities and strengthen the presence of the United States' cranberries in the growing Southeast Asian fruit market.
- July 2024: USDA Agricultural Marketing Service terminated Marketing Order No. 929, which regulated cranberry handling in Massachusetts, Rhode Island, Connecticut, New Jersey, Wisconsin, Michigan, Minnesota, Oregon, Washington, and Long Island, New York. The order's suspension followed a failed referendum on continuance in October 2023, reflecting insufficient producer support for collective assessment and marketing activities. This termination shifts export-promotion and market-development costs onto individual firms and state specialty-crop block grants, fragmenting industry coordination.
- August 2024: China's General Administration of Customs has eliminated quarantine requirements for frozen fruit imports, specifically permitting frozen cranberries to enter the country with simplified phytosanitary certification. This regulatory change reduces logistical challenges and facilitates a year-round supply to e-commerce platforms such as Alibaba's Freshippo and JD Fresh, driving increased demand for cranberries.


Research Methodology Framework and Report Scope
Market Definitions and Key Coverage
Our study defines the cranberries market as the annual value, in manufacturer-level US dollars, of fresh cranberries and all direct fruit-based derivatives, frozen berries, sweetened dried pieces, pure juices, juice concentrates, sauces, powders, and standardized extracts, sold through retail, food-service, ingredient, and nutraceutical channels worldwide.
Scope exclusion: Products flavored solely with synthetic cranberry aroma that contain no fruit solids lie outside the scope.
Segmentation Overview
- By Geography
- North America
- United States
- Production Analysis (Area Harvested, Yield, and Production Volume)
- Consumption Analysis (Consumption Value and Volume)
- Import Market Analysis (Import Value, Volume, and Key Supplying Markets)
- Export Market Analysis (Export Value, Volume, and Key Destination Markets)
- Wholesale Price Trend Analysis and Forecast
- Regulatory Framework
- List of Key Players
- Logistics and Infrastructure
- Seasonality Analysis
- Canada
- Production Analysis (Area Harvested, Yield, and Production Volume)
- Consumption Analysis (Consumption Value and Volume)
- Import Market Analysis (Import Value, Volume, and Key Supplying Markets)
- Export Market Analysis (Export Value, Volume, and Key Destination Markets)
- Wholesale Price Trend Analysis and Forecast
- Regulatory Framework
- List of Key Players
- Logistics and Infrastructure
- Seasonality Analysis
- Mexico
- Production Analysis (Area Harvested, Yield, and Production Volume)
- Consumption Analysis (Consumption Value and Volume)
- Import Market Analysis (Import Value, Volume, and Key Supplying Markets)
- Export Market Analysis (Export Value, Volume, and Key Destination Markets)
- Wholesale Price Trend Analysis and Forecast
- Regulatory Framework
- List of Key Players
- Logistics and Infrastructure
- Seasonality Analysis
- United States
- Europe
- Germany
- Production Analysis (Area Harvested, Yield, and Production Volume)
- Consumption Analysis (Consumption Value and Volume)
- Import Market Analysis (Import Value, Volume, and Key Supplying Markets)
- Export Market Analysis (Export Value, Volume, and Key Destination Markets)
- Wholesale Price Trend Analysis and Forecast
- Regulatory Framework
- List of Key Players
- Logistics and Infrastructure
- Seasonality Analysis
- United Kingdom
- Production Analysis (Area Harvested, Yield, and Production Volume)
- Consumption Analysis (Consumption Value and Volume)
- Import Market Analysis (Import Value, Volume, and Key Supplying Markets)
- Export Market Analysis (Export Value, Volume, and Key Destination Markets)
- Wholesale Price Trend Analysis and Forecast
- Regulatory Framework
- List of Key Players
- Logistics and Infrastructure
- Seasonality Analysis
- Spain
- Production Analysis (Area Harvested, Yield, and Production Volume)
- Consumption Analysis (Consumption Value and Volume)
- Import Market Analysis (Import Value, Volume, and Key Supplying Markets)
- Export Market Analysis (Export Value, Volume, and Key Destination Markets)
- Wholesale Price Trend Analysis and Forecast
- Regulatory Framework
- List of Key Players
- Logistics and Infrastructure
- Seasonality Analysis
- Netherlands
- Production Analysis (Area Harvested, Yield, and Production Volume)
- Consumption Analysis (Consumption Value and Volume)
- Import Market Analysis (Import Value, Volume, and Key Supplying Markets)
- Export Market Analysis (Export Value, Volume, and Key Destination Markets)
- Wholesale Price Trend Analysis and Forecast
- Regulatory Framework
- List of Key Players
- Logistics and Infrastructure
- Seasonality Analysis
- Russia
- Production Analysis (Area Harvested, Yield, and Production Volume)
- Consumption Analysis (Consumption Value and Volume)
- Import Market Analysis (Import Value, Volume, and Key Supplying Markets)
- Export Market Analysis (Export Value, Volume, and Key Destination Markets)
- Wholesale Price Trend Analysis and Forecast
- Regulatory Framework
- List of Key Players
- Logistics and Infrastructure
- Seasonality Analysis
- Germany
- Asia-Pacific
- China
- Production Analysis (Area Harvested, Yield, and Production Volume)
- Consumption Analysis (Consumption Value and Volume)
- Import Market Analysis (Import Value, Volume, and Key Supplying Markets)
- Export Market Analysis (Export Value, Volume, and Key Destination Markets)
- Wholesale Price Trend Analysis and Forecast
- Regulatory Framework
- List of Key Players
- Logistics and Infrastructure
- Seasonality Analysis
- Japan
- Production Analysis (Area Harvested, Yield, and Production Volume)
- Consumption Analysis (Consumption Value and Volume)
- Import Market Analysis (Import Value, Volume, and Key Supplying Markets)
- Export Market Analysis (Export Value, Volume, and Key Destination Markets)
- Wholesale Price Trend Analysis and Forecast
- Regulatory Framework
- List of Key Players
- Logistics and Infrastructure
- Seasonality Analysis
- China
- South America
- Chile
- Production Analysis (Area Harvested, Yield, and Production Volume)
- Consumption Analysis (Consumption Value and Volume)
- Import Market Analysis (Import Value, Volume, and Key Supplying Markets)
- Export Market Analysis (Export Value, Volume, and Key Destination Markets)
- Wholesale Price Trend Analysis and Forecast
- Regulatory Framework
- List of Key Players
- Logistics and Infrastructure
- Seasonality Analysis
- Peru
- Production Analysis (Area Harvested, Yield, and Production Volume)
- Consumption Analysis (Consumption Value and Volume)
- Import Market Analysis (Import Value, Volume, and Key Supplying Markets)
- Export Market Analysis (Export Value, Volume, and Key Destination Markets)
- Wholesale Price Trend Analysis and Forecast
- Regulatory Framework
- List of Key Players
- Logistics and Infrastructure
- Seasonality Analysis
- Brazil
- Production Analysis (Area Harvested, Yield, and Production Volume)
- Consumption Analysis (Consumption Value and Volume)
- Import Market Analysis (Import Value, Volume, and Key Supplying Markets)
- Export Market Analysis (Export Value, Volume, and Key Destination Markets)
- Wholesale Price Trend Analysis and Forecast
- Regulatory Framework
- List of Key Players
- Logistics and Infrastructure
- Seasonality Analysis
- Chile
- Middle East
- Turkey
- Production Analysis (Area Harvested, Yield, and Production Volume)
- Consumption Analysis (Consumption Value and Volume)
- Import Market Analysis (Import Value, Volume, and Key Supplying Markets)
- Export Market Analysis (Export Value, Volume, and Key Destination Markets)
- Wholesale Price Trend Analysis and Forecast
- Regulatory Framework
- List of Key Players
- Logistics and Infrastructure
- Seasonality Analysis
- Azerbaijan
- Production Analysis (Area Harvested, Yield, and Production Volume)
- Consumption Analysis (Consumption Value and Volume)
- Import Market Analysis (Import Value, Volume, and Key Supplying Markets)
- Export Market Analysis (Export Value, Volume, and Key Destination Markets)
- Wholesale Price Trend Analysis and Forecast
- Regulatory Framework
- List of Key Players
- Logistics and Infrastructure
- Seasonality Analysis
- Turkey
- Africa
- South Africa
- Production Analysis (Area Harvested, Yield, and Production Volume)
- Consumption Analysis (Consumption Value and Volume)
- Import Market Analysis (Import Value, Volume, and Key Supplying Markets)
- Export Market Analysis (Export Value, Volume, and Key Destination Markets)
- Wholesale Price Trend Analysis and Forecast
- Regulatory Framework
- List of Key Players
- Logistics and Infrastructure
- Seasonality Analysis
- South Africa
- North America
Detailed Research Methodology and Data Validation
Primary Research
Mordor analysts interviewed grower cooperatives in Wisconsin and British Columbia, juice blenders in Germany and Japan, dried-fruit exporters in Chile and Poland, and supplement formulators in South Korea. These discussions confirmed acreage moves, processor margins, and shifting regional demand that desk work only hinted at.
Desk Research
We started by compiling harvested area, yield, and utilization statistics from USDA NASS, Statistics Canada, FAOSTAT, and Eurostat. We then verified cross-border flows on UN Comtrade and ITC Trade Map. Trade association bulletins, peer-reviewed journals on polyphenol stability, and commodity price trackers helped refine processing loss factors and end-use splits. Financial filings, investor decks, and pricing dashboards housed in D&B Hoovers, Dow Jones Factiva, and Volza provided recent revenue splits and average selling prices. These sources are illustrative; many other open and subscription references were consulted to ground every assumption.
Market-Sizing & Forecasting
A top-down production and trade reconstruction converts harvested volumes into fresh-equivalent tons, applies yield factors for each processed form, and multiplies by channel-specific ASP benchmarks. Select bottom-up checks, processor roll-ups and sampled ASP × volume from major packers, fine-tune totals. Key drivers tracked include planted acreage, five-year yield trend, dried cranberry wholesale price, single-strength juice brix premium, per-capita juice intake in North America, and tariff changes on Chilean exports. A multivariate regression, supported by scenario analysis around climate-related yield swings, produces the 2025-2030 outlook.
Data Validation & Update Cycle
Outputs pass anomaly checks against import values, grower payment pools, and price indices before senior review. Reports refresh annually, with interim updates triggered when events such as crop failure, trade policy change, or major acquisition alter any core driver. After this, a fresh analyst pass ensures clients receive the latest view.
Why Mordor's Cranberries Baseline Deserves Decision Maker Confidence
Published figures often diverge because firms differ in product mix, base year, markup level, and refresh cadence.
Our model uses clear fruit-derived boundaries, an annually updated 2025 base, and dual-path validation, which together minimize variance.
Benchmark comparison
| Market Size | Anonymized source | Primary gap driver |
|---|---|---|
| USD 3.20 B (2025) | Mordor Intelligence | - |
| USD 2.32 B (2024) | Global Consultancy A | Fresh and dried only, older baseline, limited field verification |
| USD 4.32 B (2024) | Industry Tracker B | Adds extracts for cosmetics, broad value-chain markups, sparse primary input |
| USD 2.18 B (2023) | Trade Journal C | Customs data only, FOB valuation, no processor margin adjustment |
The comparison shows that our disciplined scope selection, yearly refresh, and balanced validation give decision-makers a dependable, transparent baseline for planning.


Key Questions Answered in the Report
What is the projected market size of cranberries in 2026?
The cranberries market size reached USD 9.8 billion in 2026 and is set to grow at a 6.77% CAGR through 2031.
Which region is expanding fastest in cranberry demand?
Asia-Pacific is growing at 11% CAGR through 2031, with China driving double-digit gains after import rules eased.
Who is the leading player in the global cranberries market?
Ocean Spray Cranberries Inc. led with significant revenue in 2025, supported by a cooperative of 700 farms.
What technological shifts are boosting cranberry yields?
Precision-flood harvesting and drone-based pest monitoring are cutting water use and pesticides while elevating berry quality.
Page last updated on:


