Ginger Market Size and Share
Ginger Market Analysis by Mordor Intelligence
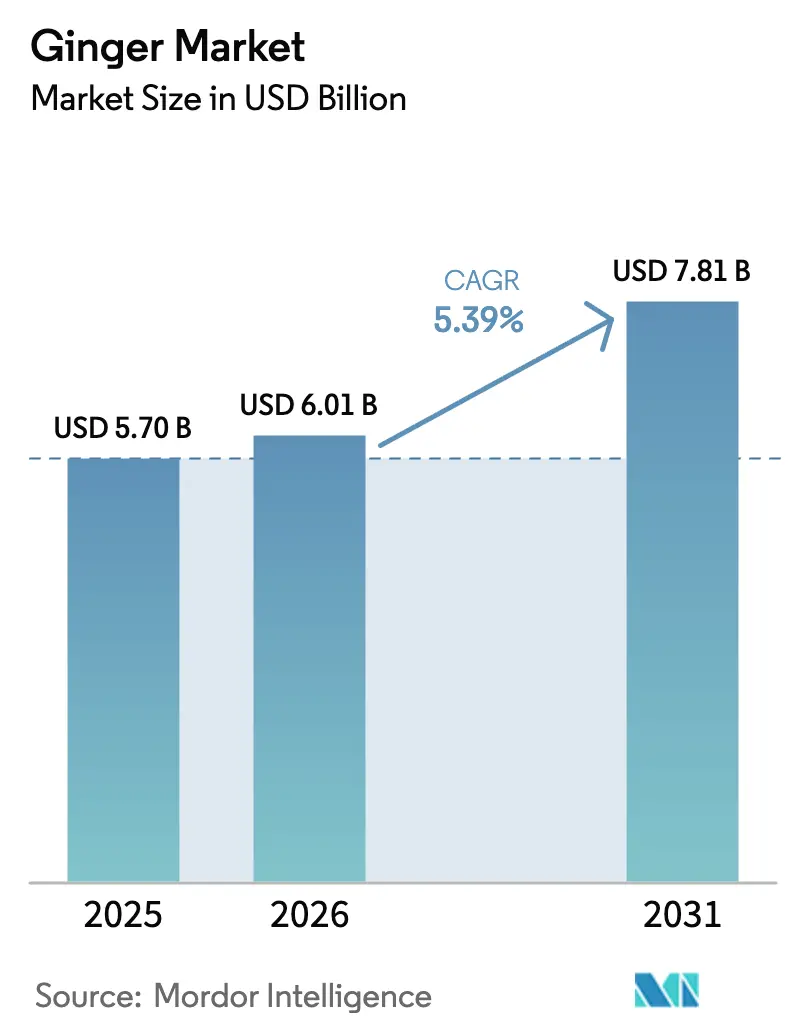
Ginger Market size market size in 2026 is estimated at USD 6.01 billion, growing from 2025 value of USD 5.70 billion with 2031 projections showing USD 7.81 billion, growing at 5.39% CAGR over 2026-2031. The ginger market growth is driven by its use as both a culinary spice and a source of bioactive compounds that support immune, digestive, and anti-inflammatory functions. The demand is increasing in functional beverages, nutraceuticals, and natural personal care products as consumers seek plant-based wellness solutions. While Asia-Pacific remains the primary production and processing hub, North America and Europe show higher volume growth due to increased adoption of Asian cuisine and health-focused beverages[1]Source: Wei Zhang & Jun Li, “Biological Mechanisms, Pharmacological and Pathological Effects of Ginger Constituents,” ScienceDirect, sciencedirect.com. Advanced extraction methods, sustainable farming practices, and genome-edited varieties are improving value generation throughout the supply chain.
Key Report Takeaways
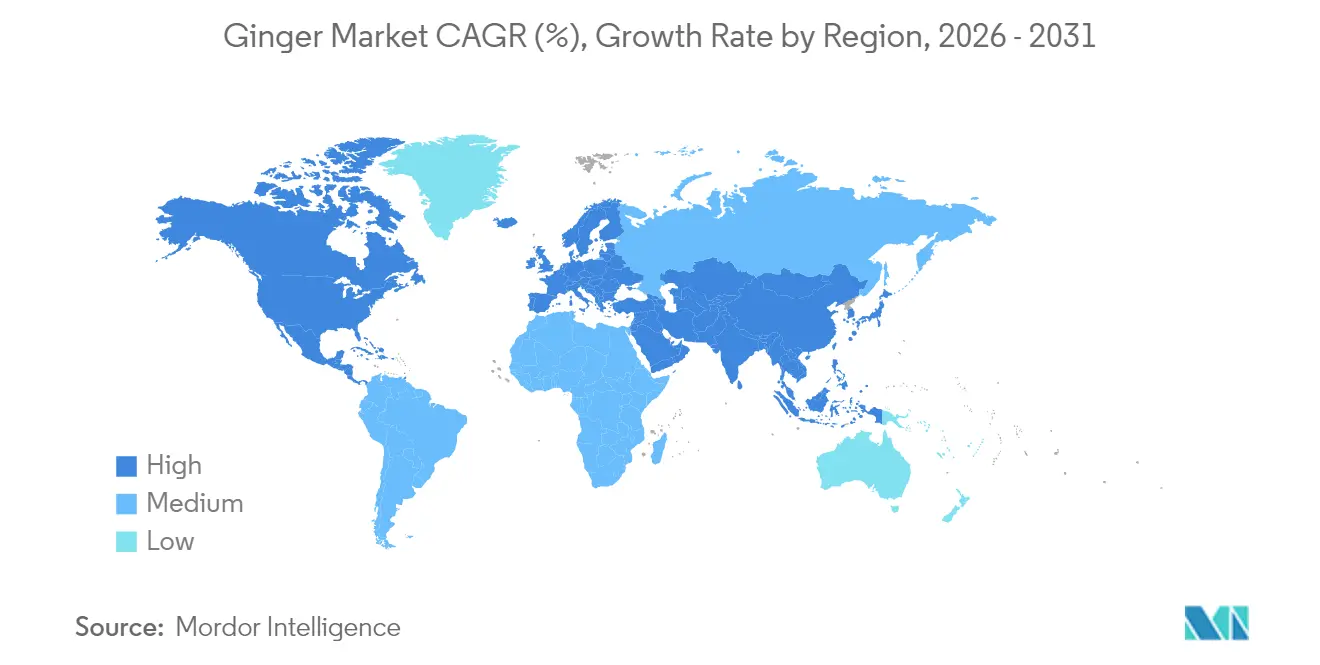
- By geography, Asia-Pacific held 41.25% of the ginger market share in 2025, while North America is the fastest-growing market.
Note: Market size and forecast figures in this report are generated using Mordor Intelligence’s proprietary estimation framework, updated with the latest available data and insights as of 2026.
Global Ginger Market Trends and Insights
Drivers Impact Analysis*
| Driver | (~) % Impact on CAGR Forecast | Geographic Relevance | Impact Timeline |
|---|---|---|---|
| Rising consumer focus on natural functional ingredients | +1.8% | Global, strongest in North America and Europe | Medium term (2-4 years) |
| Expanding nutraceutical an herbal supplement penetration | +1.2% | North America, Europe, urban Asia-Pacific | Medium term (2-4 years) |
| Accelerating demand from clean-label beverage formulators | +0.9% | North America, Europe | Short term (≤2 years) |
| Mainstreaming of Asian cuisines in western food service | +0.7% | North America, Europe | Short term (≤2 years) |
| Genome-edited high-oleoresin cultivars | +0.5% | India, China; global spillover | Long term (≥4 years) |
| Carbon-credit premiums for regenerative farming | +0.3% | Global; early Asia-Pacific uptake | Long term (≥4 years) |
| Source: Mordor Intelligence | |||
Rising Consumer Focus on Natural Functional Ingredients
The growing consumer demand for scientifically supported botanical ingredients has increased ginger's importance in supplements, functional foods, and cosmeceuticals. This expanded market presence drives product development in gummies, shots, and topical balms, increasing product value and demand for concentrated oleoresins. With ongoing studies validating ginger's effectiveness, manufacturers are establishing long-term supply contracts to manage raw material price fluctuations.
Expanding Nutraceutical an Herbal Supplement Penetration
Rapid growth in the global nutraceutical arena creates a sizable addressable market for ginger-derived actives. Supplement manufacturers leverage gingerols for joint-support, digestive-ease, and motion-sickness products, often combining them with curcumin or probiotics for multi-ingredient formats. Multinational dietary-supplement players are ramping up regional sourcing partnerships to assure traceability and organic certification, reinforcing ginger’s position as a high-margin bioactive.
Accelerating Demand from Clean-Label Beverage Formulators
Beverage manufacturers are incorporating ginger as both a natural flavoring agent and a health ingredient. Premium beverage brands, including soda, kombucha, and ready-to-drink tea producers, use fresh ginger juice and standardized extracts to achieve spicy flavor profiles without artificial ingredients. The ingredient's popularity has expanded into cocktail mixers, particularly in low-sugar formulations, resulting in partnerships between breweries and ginger beer producers. Manufacturers differentiate their products through origin labeling, organic certification, and regenerative agriculture claims, increasing the demand for sustainably grown ginger.
Mainstreaming of Asian Cuisines in Western Food Service
The growing popularity of Asian cuisine in fast-casual restaurants and meal-kit services has increased the demand for ginger as a key ingredient in dishes like stir-fries, ramen, sushi, and curry. Food service businesses value ginger for its flavor profile, storage longevity, and health benefits. The increasing presence of Asian dishes in restaurants has familiarized consumers with ginger, driving retail demand for fresh and dried ginger roots, as well as prepared pastes. This relationship between restaurant and retail consumption has increased sales of premium ginger products, leading to investments in specialized storage and distribution infrastructure.
Restraints Impact Analysis*
| Restraint | (~) % Impact on CAGR Forecast | Geographic Relevance | Impact Timeline |
|---|---|---|---|
| Yield loss from erratic monsoon | -0.7% | India, Southeast Asia | Medium term (2-4 years) |
| Farm-gate price volatility and speculative hoarding | -0.5% | Global; highest in Asia-Pacific | Short term (≤2 years) |
| Phytosanitary rejections in high-margin export markets | -0.3% | EU, United States, Japan | Medium term (2-4 years) |
| Plateauing arable land in producer nations | -0.2% | China, India | Long term (≥4 years) |
| Source: Mordor Intelligence | |||
Yield Loss from Erratic Monsoon
Ginger cultivation requires balanced rainfall, as both prolonged drought and waterlogging reduce yields and oleoresin content. The irregular monsoon patterns in South Asia and Southeast Asia have decreased rhizome production and increased quality-rejection rates at domestic auction yards. Also, limited capital among smallholder farmers restricts widespread adoption of tech-efficient irrigation practices, creating production uncertainty that affects the export supply chain.
Farm-Gate Price Volatility and Speculative Hoarding
The ginger supply chain faces volatility due to brief harvest periods, insufficient cold storage capacity, and disconnected logistics networks. Small-scale farmers, without access to price hedging mechanisms, often reduce their agricultural inputs during periods of low prices, creating supply and demand mismatches in the following seasons. While governments and agricultural cooperatives are testing digital market information platforms and warehouse financing programs to reduce price speculation, these initiatives are still in early stages.
*Our forecasts treat driver/restraint impacts as directional, not additive. The impact forecasts reflect baseline growth, mix effects, and variable interactions.
Geography Analysis
Asia-Pacific generated 64.60% of global rhizome output in 2025, translating into the region’s dominant 41.25% ginger market size within overall trade value. China and India constitute a major production share of the Asia-Pacific market, underscoring a supply base highly concentrated along tropical and subtropical belts Lower labor costs, agro-climatic suitability, and rapidly expanding extraction facilities anchor the region’s competitive edge. Intra-regional demand is robust, with culinary use remaining entrenched in China, Japan, and Korea, and overlaps with established phytotherapy traditions. Processors are capturing more value through supercritical CO₂ extraction that yields high-purity oil and oleoresin for export to pharmaceutical and personal-care industries.
North America and Europe account for a significant share of global consumption in 2025 and are projected to maintain growth. The expansion in these regions stems from health-focused beverage launches, rising vegan food consumption, and growing e-commerce supplement sales. Distributors use product traceability and organic certifications to address higher procurement costs. Importers form long-term supply agreements with Peruvian, Nigerian, and Indian exporters to minimize climate-related risks in primary growing regions. The market growth has prompted greenhouse production initiatives to shorten supply chains and improve product freshness.


Recent Industry Developments
- March 2025: PepsiCo acquired Poppi, a prebiotic soda brand featuring ginger-infused beverages, for USD 1.95 billion, expanding its functional-beverage footprint.
- January 2025: Molson Coors Beverage Company signed a strategic partnership with Fever-Tree, obtaining exclusive U.S. rights to the latter’s ginger-beer range and purchasing an 8.5% equity stake.
- January 2025: India’s Department of Biotechnology announced field-ready genome-edited ginger cultivars with higher oleoresin yield and resistance to Ralstonia wilt.
- May 2024: The Guam Department of Agriculture issued its Agriculture Master Plan, listing ginger among focus crops for import substitution and climate-smart production.


Research Methodology Framework and Report Scope
Market Definitions and Key Coverage
Our study defines the ginger market as trade and consumption of the raw rhizome (Zingiber officinale) in fresh, dried, powdered, and minimally processed forms that preserve the root's identity. Values reflect factory-gate or first-handler prices converted to constant 2024 USD so regional production, import, and export flows align.
Scope Exclusion: Derivative extracts such as ginger oil and oleoresin are analyzed in a separate Mordor Intelligence report and therefore are not counted here.
Segmentation Overview
- Geography
- North America
- United States
- Production Analysis
- Consumption Analysis and Market Value
- Import Market Analysis (Volume and Value)
- Export Market Analysis (Volume and Value)
- Price Trend Analysis
- Canada
- Production Analysis
- Consumption Analysis and Market Value
- Import Market Analysis (Volume and Value)
- Export Market Analysis (Volume and Value)
- Price Trend Analysis
- United States
- Europe
- United Kingdom
- Production Analysis
- Consumption Analysis and Market Value
- Import Market Analysis (Volume and Value)
- Export Market Analysis (Volume and Value)
- Price Trend Analysis
- Germany
- Production Analysis
- Consumption Analysis and Market Value
- Import Market Analysis (Volume and Value)
- Export Market Analysis (Volume and Value)
- Price Trend Analysis
- Netherlands
- Production Analysis
- Consumption Analysis and Market Value
- Import Market Analysis (Volume and Value)
- Export Market Analysis (Volume and Value)
- Price Trend Analysis
- Spain
- Production Analysis
- Consumption Analysis and Market Value
- Import Market Analysis (Volume and Value)
- Export Market Analysis (Volume and Value)
- Price Trend Analysis
- France
- Production Analysis
- Consumption Analysis and Market Value
- Import Market Analysis (Volume and Value)
- Export Market Analysis (Volume and Value)
- Price Trend Analysis
- United Kingdom
- Asia-Pacific
- China
- Production Analysis
- Consumption Analysis and Market Value
- Import Market Analysis (Volume and Value)
- Export Market Analysis (Volume and Value)
- Price Trend Analysis
- India
- Production Analysis
- Consumption Analysis and Market Value
- Import Market Analysis (Volume and Value)
- Export Market Analysis (Volume and Value)
- Price Trend Analysis
- Japan
- Production Analysis
- Consumption Analysis and Market Value
- Import Market Analysis (Volume and Value)
- Export Market Analysis (Volume and Value)
- Price Trend Analysis
- Thailand
- Production Analysis
- Consumption Analysis and Market Value
- Import Market Analysis (Volume and Value)
- Export Market Analysis (Volume and Value)
- Price Trend Analysis
- Vietnam
- Production Analysis
- Consumption Analysis and Market Value
- Import Market Analysis (Volume and Value)
- Export Market Analysis (Volume and Value)
- Price Trend Analysis
- Indonesia
- Production Analysis
- Consumption Analysis and Market Value
- Import Market Analysis (Volume and Value)
- Export Market Analysis (Volume and Value)
- Price Trend Analysis
- China
- South America
- Brazil
- Production Analysis
- Consumption Analysis and Market Value
- Import Market Analysis (Volume and Value)
- Export Market Analysis (Volume and Value)
- Price Trend Analysis
- Peru
- Production Analysis
- Consumption Analysis and Market Value
- Import Market Analysis (Volume and Value)
- Export Market Analysis (Volume and Value)
- Price Trend Analysis
- Brazil
- Africa
- South Africa
- Production Analysis
- Consumption Analysis and Market Value
- Import Market Analysis (Volume and Value)
- Export Market Analysis (Volume and Value)
- Price Trend Analysis
- Nigeria
- Production Analysis
- Consumption Analysis and Market Value
- Import Market Analysis (Volume and Value)
- Export Market Analysis (Volume and Value)
- Price Trend Analysis
- South Africa
- Middle East
- United Arab Emirates
- Production Analysis
- Consumption Analysis and Market Value
- Import Market Analysis (Volume and Value)
- Export Market Analysis (Volume and Value)
- Price Trend Analysis
- United Arab Emirates
- North America
Detailed Research Methodology and Data Validation
Primary Research
Mordor analysts interviewed growers in India, Peru, and Nigeria, global traders in Rotterdam and Dubai, and ingredient buyers at beverage and nutraceutical firms across North America and Europe. These discussions validated yield assumptions, typical moisture-loss factors, and price mark-ups between wholesale and processor gates, plugging gaps left by secondary data.
Desk Research
We began with public datasets that anchor physical supply: FAOSTAT harvested area and yield trends, UN Comtrade HS-0910 shipment volumes, and USDA GATS import reports which signal U.S. demand shifts. Policy and price signals were tracked through the Centre for the Promotion of Imports (CBI), India's Spices Board statistics, and Codex Alimentarius pesticide-residue limits that influence export acceptance. Company filings and trade-press articles gathered via Dow Jones Factiva and D&B Hoovers supplied processor margins and contract prices that refine average selling prices. The sources listed illustrate our inputs and are not exhaustive.
Market-Sizing & Forecasting
We applied a top-down reconstruction that scales national production and net-trade balances into apparent domestic use, then weights each geography by average ex-farm or CIF price to arrive at 2024 market value. Select bottom-up supplier roll-ups and sampled ASP × volume checks help reconcile outliers. Key variables fed into the model include planted acreage, three-year average yield, import share in high-consumption economies, ginger price indices from APOI, consumer health-supplement spending, and regional GDP per capita. Forecasts to 2030 use multivariate regression blended with ARIMA to project acreage response to price signals and income growth, while scenario analysis captures climate volatility on yields. When bottom-up evidence is thin, we adjust coefficients, never the raw data, to retain traceability.
Data Validation & Update Cycle
Outputs pass variance checks against historical price-volume elasticities, and any anomaly above five percentage points triggers analyst re-work. A senior reviewer signs off before publication. We refresh the entire dataset annually and issue interim revisions when material trade policy or climate events emerge.
Why Mordor's Ginger Market Baseline Commands Reliability
Published figures differ because firms pick different product sets, assume contrasting price points, or refresh at uneven intervals. By anchoring on traded physical mass first, then layering defensible price series, Mordor keeps scope transparent and currency effects neutral.
Benchmark comparison
| Market Size | Anonymized source | Primary gap driver |
|---|---|---|
| USD 5.70 B (2025) | Mordor Intelligence | - |
| USD 5.19 B (2025) | Global Consultancy A | Includes ginger oils and concentrates which lift value artificially |
| USD 4.01 B (2024) | Strategic Advisory B | Uses five-year-old production averages and excludes informal cross-border trade |
| USD 3.78 B (2024) | Industry Data Provider C | Relies on retail scan prices without reconciling back to producer level |
The comparison shows how scope drift, dated baselines, and price-level mismatches pull estimates apart. Mordor's disciplined variable set, annual refresh, and dual validation steps give decision-makers a balanced, reproducible baseline they can trust.


Key Questions Answered in the Report
What is the current size of the ginger market?
The ginger market stands at USD 6.01 billion in 2026 and is projected to reach USD 7.81 billion by 2031.
Which region leads global production of ginger?
Asia-Pacific provides about 64.60% of total harvest volume, with China, India and Indonesia accounting for three-quarters of global output.
Why are functional beverages important for ginger demand?
Clean-label drinks use ginger for its distinctive flavor and health benefits, and this segment is growing at 6.95% CAGR through 2031.
How do climate factors influence ginger supply?
Erratic monsoon patterns in South and Southeast Asia reduce yields and quality, trimming projected CAGR by 0.7% points.
What role do genome-edited cultivars play in the market?
New disease-resistant, high-oleoresin varieties raise extraction yields and could reduce cultivation footprints, adding a 0.5% boost to long-term growth.
Page last updated on:


