Mango Market Size and Share
Mango Market Analysis by Mordor Intelligence
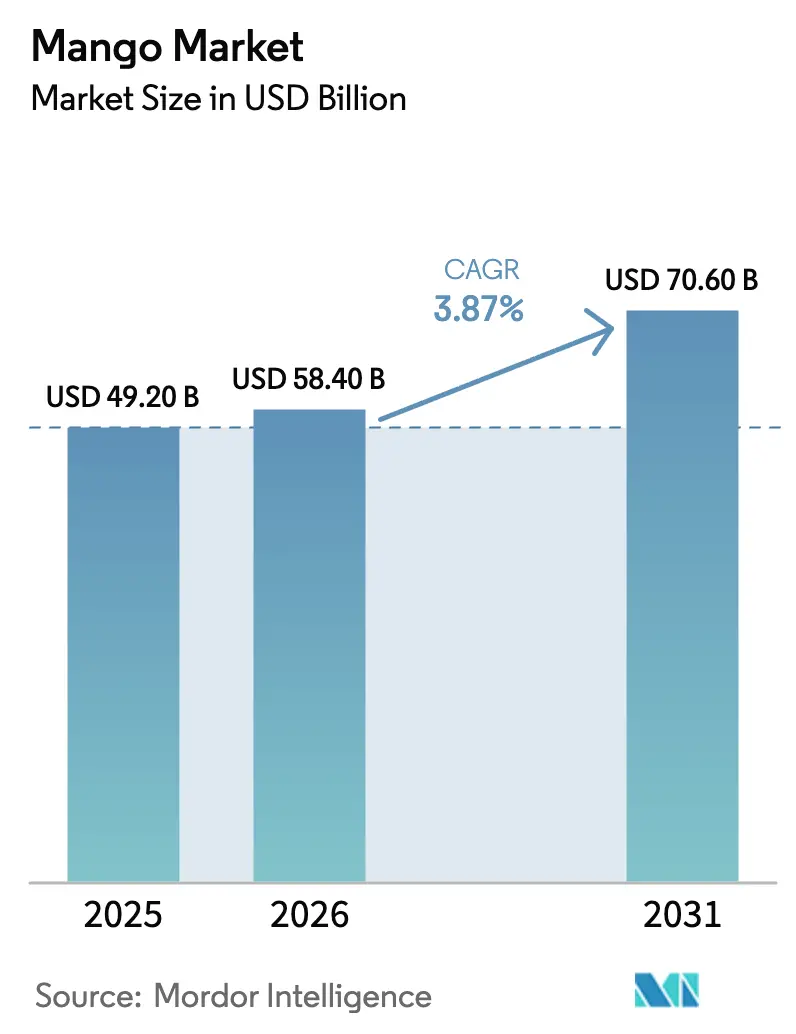
The mango market is projected to grow from USD 49.20 billion in 2025 to USD 58.40 billion in 2026 and is forecast to reach USD 70.60 billion by 2031 at a 3.87% CAGR over 2026-2031. Robust retail and food-service demand, production gains under acreage-expansion subsidies in India, Mexico, and Kenya, and controlled-atmosphere shipping that cuts post-harvest losses continue to steer growth [1]Source: Food and Agriculture Organization, “FAOSTAT Database,” fao.org. Supply-side improvements combine with rising household incomes in Asia-Pacific, a widening plant-based beverage base in North America and Europe, and digital marketplaces that compress broker margins to create fresh avenues for value capture. At the same time, technology adoption lowers sea-freight costs and expands route options, allowing exporters to reach distant buyers without compromising firmness or color attributes. Price trends remain seasonally volatile, spot values for Brazilian shipments slipped, while Peruvian fruit appreciated on tighter volumes, yet multi-origin programs help large traders hedge exposure. Imports into high-income Gulf states, coupled with China’s off-season sourcing from Vietnam, underpin a resilient demand floor even when weather shocks disrupt South American supply lines.
Key Report Takeaways
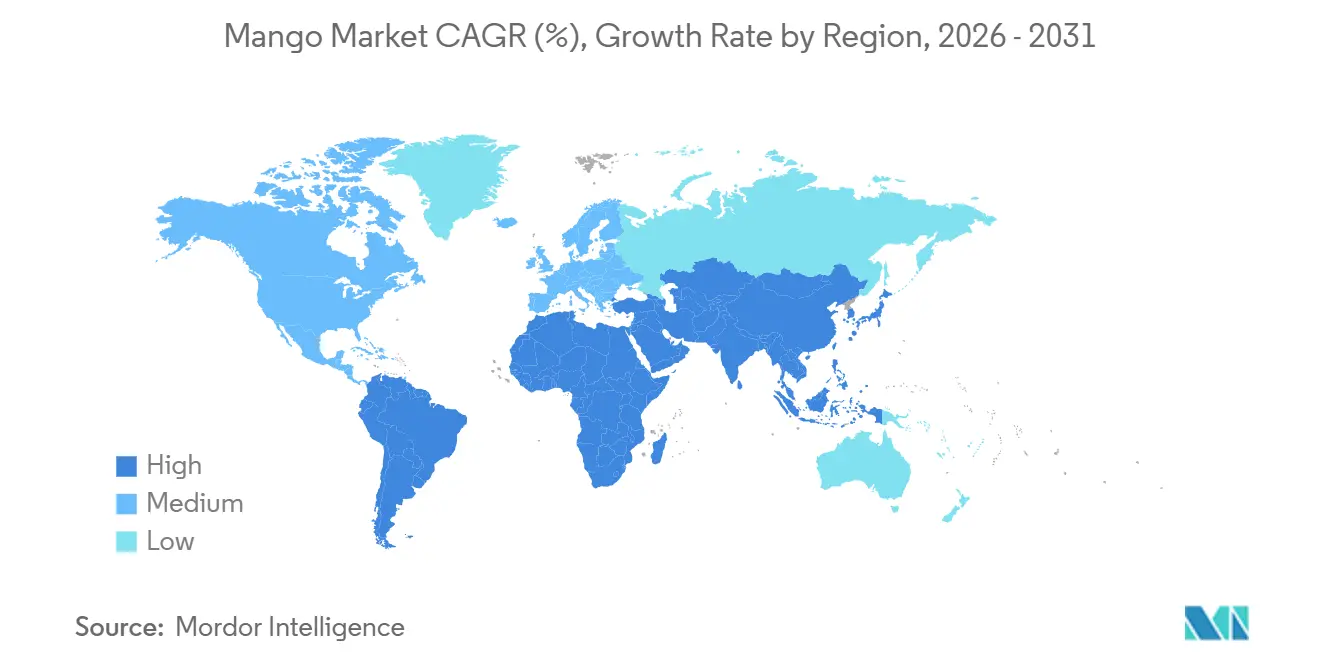
- By geography, Asia-Pacific accounted for 45% of the 2025 mango market share, and is projected to record a 6.7% CAGR during the forecast period (2026-2031).
Note: Market size and forecast figures in this report are generated using Mordor Intelligence’s proprietary estimation framework, updated with the latest available data and insights as of January 2026.
Global Mango Market Trends and Insights
Drivers Impact Analysis*
| Driver | (~) % Impact on CAGR Forecast | Geographic Relevance | Impact Timeline |
|---|---|---|---|
| Sustained demand for fresh-cut mango in health focused products | +1.2% | Global, with concentration in North America and Europe | Medium term (2-4 years) |
| Rapid acreage expansion under government subsidies | +1.4% | Asia-Pacific, Africa, and North America | Long term (≥ 4 years) |
| Controlled-atmosphere shipping lowering post-harvest losses | +0.9% | Global, particularly Asia-Pacific to Middle East and North America routes | Short term (≤ 2 years) |
| Higher household income boosting premium varietal uptake | +0.8% | Asia-Pacific core, spill-over to Middle East | Medium term (2-4 years) |
| Plant-based beverage growth using mango purée | +0.7% | North America, Europe, emerging in Asia-Pacific | Medium term (2-4 years) |
| Digital produce marketplaces shortening supply chains | +0.5% | Global, early adoption in Asia-Pacific and Africa | Short term (≤ 2 years) |
| Source: Mordor Intelligence | |||
Sustained Demand For Fresh-Cut Mango In Health Focused Products
Ready-to-eat fruit cups have been gaining shelf space in supermarkets, with food-service volumes in the United States increasing further since 2024 as consumers show a growing preference for portion-controlled snacks[2]. Fresh Del Monte operates 25 fresh-cut facilities, highlighting the margin lift in value-added formats. Processors prefer Kent and Keitt varieties meeting firmness and soluble-solids thresholds that maintain texture throughout extended cold-chain journeys. QR-code packaging launched by Freska Produce for mango in November 2025 links buyers to ripening tips, building brand loyalty at the point of purchase. Convenience, traceability, and labor-saving benefits together insulate the fresh-cut channel from raw-fruit price swings.
Rapid Acreage Expansion under Government Subsidies
India’s Mission for Integrated Development of Horticulture offers significant financial support, including assistance for establishing new orchards, spurring drip-irrigated plantings that raise yields and extend harvest windows. Kenya channels World Bank funding into irrigation, cold-rooms and mobile finance across several counties, targeting export-grade fruit quality. Mexico’s Michoacán growers leverage 40-year pack-house networks to scale Tommy Atkins and Ataulfo exports, reinforcing their lead supplier status to the United States. Subsidies accelerate volume growth but heighten oversupply risk when new hectares outpace cold-chain capacity.
Controlled-Atmosphere Shipping Lowering Post-Harvest Losses
Nitrogen-flush reefer containers that maintain 3% oxygen and 6% carbon-dioxide at 13 degrees Celsius extend shelf life to six weeks, enabling sea freight in place of costlier air cargo. Thailand exporters adopted the technology and trimmed logistics spending by up to 50% on Europe-bound loads. Peruvian and Brazilian shippers now reach Middle Eastern buyers on four-week voyages using ethylene-scrubbing liners that cut waste, strengthening margins during tight freight-space cycles. Dole noted that canal disruptions pushed 2024 shipping costs higher, yet its investment in controlled-atmosphere hardware preserved netbacks by limiting transit spoilage.
Digital Produce Marketplaces Shortening Supply Chains
Platforms such as Tridge and Cogoport connect growers to importers and freight options, trimming commission layers by 10–15%. Kenya’s growers leverage mobile-money services to aggregate supply and negotiate higher export offers, while Vietnamese shippers employ blockchain traceability via iTrace247 to satisfy European Union audit requirements. Real-time pricing and container-tracking data improve contract reliability, yet uptake depends on rural internet access and digital literacy. For fragmented producer bases, digital tools offer the quickest path to professionalized trade without heavy capital outlays.
Restraints Impact Analysis*
| Restraint | (~) % Impact on CAGR Forecast | Geographic Relevance | Impact Timeline |
|---|---|---|---|
| More frequent cyclones and droughts | -1.1% | Asia-Pacific, South America, North America | Medium term (2-4 years) |
| Rising phytosanitary rejections in top markets | -0.8% | Global, concentrated in Asia-Pacific and Africa exports to European Union and North America | Short term (≤ 2 years) |
| Volatile freight container availability and costs | -0.6% | Global, particularly Asia-Pacific to North America and Europe routes | Short term (≤ 2 years) |
| Substitution by processed tropical fruit | -0.4% | North America and Europe, emerging in Asia-Pacific | Medium term (2-4 years) |
| Source: Mordor Intelligence | |||
More Frequent Cyclones and Droughts
Nature Climate Change projects a 1.5-fold rise in hot-and-dry monsoon extremes under worst-case emissions scenarios, cutting mango yields 3–6% annually in India’s belt. Dole reported USD 25 million in rehabilitation costs after tropical storm Sara hit Honduras in 2025, showing the financial strain even on capital-rich multinationals. Crop loss spikes spot prices but also undermines smallholder livelihoods when trees suffer long-term stress. Limited access to affordable irrigation in rain-fed zones magnifies vulnerability, widening the performance gap between integrated estates and fragmented cooperatives.
Rising Phytosanitary Rejections in Top Markets
The United States paused Michoacán inspections in 2024, stalling Mexico’s main export channel. European Union pest controls add 10-15% to shipment costs, hurting smallholders. Compliance capacity now defines competitive access. The near-term drag on shipments weighs on the mango market yet also rewards certified suppliers. Exporters in Peru and India are implementing vapor heat treatment and electronic traceability systems to comply with evolving standards. However, delays in harmonizing global protocols create uncertainty for emerging exporters seeking to enter premium markets.
*Our forecasts treat driver/restraint impacts as directional, not additive. The impact forecasts reflect baseline growth, mix effects, and variable interactions.
Geography Analysis
In 2025, the Asia-Pacific region accounted for 45% of the mango market revenue and is projected to grow at a CAGR of 6.7% through 2031. India drives this growth, with Uttar Pradesh contributing a significant share of the country's mango production. However, exports remain constrained due to stringent United States irradiation regulations, which impose additional costs on small pack-houses. In early 2025, China’s import expenses increased significantly as Vietnam exported 40,700 metric tons of mangoes at USD 700 per metric ton, undercutting Thai competitors by utilizing an off-season harvest window and VietGAP certification. During the same period, Thai mango exports declined by 70%, highlighting how proximity and quality certifications can disrupt established trade routes. Additionally, rising disposable incomes across Southeast and East Asia are driving premium demand for varieties such as Alphonso, Honey Gold, and Nam Dok Mai. In India, the Mission for Integrated Development of Horticulture (MIDH) subsidy of INR 125,000 per hectare (USD 1,490) continues to support drip-irrigated orchards and tissue-culture nurseries.
North America is projected to hold a moderate share of the mango commodity market in 2025, with regional demand projected to grow through 2031. The United States plans to import 25.2 million four-kilogram boxes during the 2025–2026 season, representing an 8% year-over-year decline due to weather-affected crops in Peru and Mexico. Michoacán growers commenced the 2024 harvest with high-quality Tommy Atkins and Ataulfo varieties, supporting established supermarket and food-service programs. Suppliers such as Freska Produce and Fresh Del Monte have implemented multi-origin supply chains and established dedicated trucking and ripening hubs, reducing lead times and mitigating United States Department of Agriculture Animal and Plant Health Inspection Service (USDA APHIS) rejections related to fruit-fly interceptions.
The Middle East is projected to grow as the United Arab Emirates re-exports premium fruits from India and Pakistan across the Gulf Cooperation Council, driven by an 88% expatriate population with strong demand for tropical fruits. Iranian produce often enters the United Arab Emirates at a container cost of USD 2,200 and is re-labeled for further shipment, highlighting the region's adaptable trade framework. Europe accounted for substantial market share of global consumption in 2025, paying premiums for Global Good Agricultural Practices (GlobalG.A.P)-certified and organic consignments, despite stricter European Union Plant Health regulations increasing inspection frequency. Africa's growth, supported by Kenya's irrigated farmland and Egypt's Keitt mango expansion, targets European buyers through tariff-relief Economic Partnership Agreements. South American exporters, particularly in Peru and Brazil, leverage counter-seasonal harvests to address Northern Hemisphere supply gaps, a strategy bolstered by Mission Produce's vertically integrated farms and Freska's joint venture with Tallanes Packers.
Mordor Intelligence provides coverage of the mango market across other key regional markets. Detailed country-level analysis extends to India incorporating local coverage and market participation, as required.


Competitive Landscape
Competitive intensity is high, with the top five firms holding only a fragmented share of revenue in 2025, indicating a mango commodity industry structure driven by thousands of regional growers and pack-houses. Fresh Del Monte led, leveraging several acres under cultivation, 12 owned vessels, and 25 fresh-cut plants to command routes across the North and South Americas, Europe, and Asia-Pacific[3]Source: Fresh Del Monte Produce Inc., “Investor Presentation Oct 2024,” freshdelmonte.com . Dole’s share stems from multiproduct farms in Brazil and ripening hubs in Denmark, yet tropical storm Sara damage in Honduras during 2025 revealed the vulnerability of centralized estates to climate events. Freska Produce bolstered vertical integration by taking control of Mexican trucking fleets and launched an organic dried line that monetizes cull fruit, reflecting a nimble strategy among mid-tier players.
Strategic thrusts cluster around cold-chain investments, digital traceability, and multi-origin sourcing to mitigate weather and freight disruptions. Vietnam’s rapid ascent in China spotlights how timing advantages can upend incumbents when paired with certification and cost leadership. Blockchain pilots such as IBM Food Trust verify orchard-to-shelf data for premium European retailers who increasingly demand QR-enabled transparency. Meanwhile, post-harvest solution providers such as AgroFresh Solutions supply 1-MCP ethylene blockers to extend shelf life, deepening their influence over exporter value propositions even without owning orchards.
Mergers focus on complementary geography and format capabilities rather than outright scale consolidation, given regulatory diversity and phytosanitary complexity across origins. Investors eye processing plays, in purée, dried fruit and cosmetic derivatives, because they capture higher gross margins and diversify risk away from fresh-market price swings. Nonetheless, the mango market remains structurally fragmented, top companies lack the purchasing clout to dictate global farm-gate prices, leaving room for digital marketplaces to improve smaller-grower access to buyers.
Recent Industry Developments
- October 2025: The Andhra Pradesh government has disbursed INR 185.02 crore (USD 22 million) in subsidies to 40,795 farmers who sold Totapuri mangoes during the previous marketing season. The funds were directly transferred to the beneficiaries' bank accounts under the state’s farmer welfare initiative, designed to support horticulture growers impacted by market fluctuations.
- July 2025: Starting from the 2024-25 season, the Government of India has strengthened the Market Intervention Scheme (MIS), a part of the Pradhan Mantri Annadata Aay Sanrakshan Abhiyan (PM-AASHA), to provide improved support to farmers during periods of surplus production, particularly for perishable commodities such as mangoes.
- May 2025: Bangladesh initiated its first mango exports to China with an initial shipment of 50 metric tons in May. The country is actively pursuing additional export orders with Chinese authorities. The export initiative received positive responses from local growers and industry associations, who emphasized the competitive pricing, organic cultivation methods, and potential revenue growth opportunities.


Global Mango Market Report Scope
The Mango Market Report is Segmented by Geography (North America, Europe, Asia-Pacific, South America, The Middle East, and Africa). The Report Includes Production Analysis (Volume), Consumption Analysis (Value and Volume), Export Analysis (Value and Volume), Import Analysis (Value and Volume), Wholesale Price Trend Analysis and Forecast, Regulatory Framework, List of Key Players, Logistics and Infrastructure, and Seasonality Analysis. The Market Forecasts are Provided in Terms of Value (USD) and Volume (Metric Tons).
| North America | United States | Production Analysis (Area Harvested, Yield, and Production Volume) |
| Consumption Analysis (Consumption Value and Volume) | ||
| Import Market Analysis (Import Value, Volume, and Key Supplying Markets) | ||
| Export Market Analysis (Export Value, Volume, and Key Destination Markets) | ||
| Wholesale Price Trend Analysis and Forecast | ||
| Regulatory Framework | ||
| List of Key Players | ||
| Logistics and Infrastructure | ||
| Seasonality Analysis | ||
| Mexico | Production Analysis (Area Harvested, Yield, and Production Volume) | |
| Consumption Analysis (Consumption Value and Volume) | ||
| Import Market Analysis (Import Value, Volume, and Key Supplying Markets) | ||
| Export Market Analysis (Export Value, Volume, and Key Destination Markets) | ||
| Wholesale Price Trend Analysis and Forecast | ||
| Regulatory Framework | ||
| List of Key Players | ||
| Logistics and Infrastructure | ||
| Seasonality Analysis | ||
| Dominican Republic | Production Analysis (Area Harvested, Yield, and Production Volume) | |
| Consumption Analysis (Consumption Value and Volume) | ||
| Import Market Analysis (Import Value, Volume, and Key Supplying Markets) | ||
| Export Market Analysis (Export Value, Volume, and Key Destination Markets) | ||
| Wholesale Price Trend Analysis and Forecast | ||
| Regulatory Framework | ||
| List of Key Players | ||
| Logistics and Infrastructure | ||
| Seasonality Analysis | ||
| Guatemala | Production Analysis (Area Harvested, Yield, and Production Volume) | |
| Consumption Analysis (Consumption Value and Volume) | ||
| Import Market Analysis (Import Value, Volume, and Key Supplying Markets) | ||
| Export Market Analysis (Export Value, Volume, and Key Destination Markets) | ||
| Wholesale Price Trend Analysis and Forecast | ||
| Regulatory Framework | ||
| List of Key Players | ||
| Logistics and Infrastructure | ||
| Seasonality Analysis | ||
| Costa Rica | Production Analysis (Area Harvested, Yield, and Production Volume) | |
| Consumption Analysis (Consumption Value and Volume) | ||
| Import Market Analysis (Import Value, Volume, and Key Supplying Markets) | ||
| Export Market Analysis (Export Value, Volume, and Key Destination Markets) | ||
| Wholesale Price Trend Analysis and Forecast | ||
| Regulatory Framework | ||
| List of Key Players | ||
| Logistics and Infrastructure | ||
| Seasonality Analysis | ||
| Europe | United Kingdom | Production Analysis (Area Harvested, Yield, and Production Volume) |
| Consumption Analysis (Consumption Value and Volume) | ||
| Import Market Analysis (Import Value, Volume, and Key Supplying Markets) | ||
| Export Market Analysis (Export Value, Volume, and Key Destination Markets) | ||
| Wholesale Price Trend Analysis and Forecast | ||
| Regulatory Framework | ||
| List of Key Players | ||
| Logistics and Infrastructure | ||
| Seasonality Analysis | ||
| Germany | Production Analysis (Area Harvested, Yield, and Production Volume) | |
| Consumption Analysis (Consumption Value and Volume) | ||
| Import Market Analysis (Import Value, Volume, and Key Supplying Markets) | ||
| Export Market Analysis (Export Value, Volume, and Key Destination Markets) | ||
| Wholesale Price Trend Analysis and Forecast | ||
| Regulatory Framework | ||
| List of Key Players | ||
| Logistics and Infrastructure | ||
| Seasonality Analysis | ||
| Netherlands | Production Analysis (Area Harvested, Yield, and Production Volume) | |
| Consumption Analysis (Consumption Value and Volume) | ||
| Import Market Analysis (Import Value, Volume, and Key Supplying Markets) | ||
| Export Market Analysis (Export Value, Volume, and Key Destination Markets) | ||
| Wholesale Price Trend Analysis and Forecast | ||
| Regulatory Framework | ||
| List of Key Players | ||
| Logistics and Infrastructure | ||
| Seasonality Analysis | ||
| Spain | Production Analysis (Area Harvested, Yield, and Production Volume) | |
| Consumption Analysis (Consumption Value and Volume) | ||
| Import Market Analysis (Import Value, Volume, and Key Supplying Markets) | ||
| Export Market Analysis (Export Value, Volume, and Key Destination Markets) | ||
| Wholesale Price Trend Analysis and Forecast | ||
| Regulatory Framework | ||
| List of Key Players | ||
| Logistics and Infrastructure | ||
| Seasonality Analysis | ||
| France | Production Analysis (Area Harvested, Yield, and Production Volume) | |
| Consumption Analysis (Consumption Value and Volume) | ||
| Import Market Analysis (Import Value, Volume, and Key Supplying Markets) | ||
| Export Market Analysis (Export Value, Volume, and Key Destination Markets) | ||
| Wholesale Price Trend Analysis and Forecast | ||
| Regulatory Framework | ||
| List of Key Players | ||
| Logistics and Infrastructure | ||
| Seasonality Analysis | ||
| Asia-Pacific | China | Production Analysis (Area Harvested, Yield, and Production Volume) |
| Consumption Analysis (Consumption Value and Volume) | ||
| Import Market Analysis (Import Value, Volume, and Key Supplying Markets) | ||
| Export Market Analysis (Export Value, Volume, and Key Destination Markets) | ||
| Wholesale Price Trend Analysis and Forecast | ||
| Regulatory Framework | ||
| List of Key Players | ||
| Logistics and Infrastructure | ||
| Seasonality Analysis | ||
| India | Production Analysis (Area Harvested, Yield, and Production Volume) | |
| Consumption Analysis (Consumption Value and Volume) | ||
| Import Market Analysis (Import Value, Volume, and Key Supplying Markets) | ||
| Export Market Analysis (Export Value, Volume, and Key Destination Markets) | ||
| Wholesale Price Trend Analysis and Forecast | ||
| Regulatory Framework | ||
| List of Key Players | ||
| Logistics and Infrastructure | ||
| Seasonality Analysis | ||
| Japan | Production Analysis (Area Harvested, Yield, and Production Volume) | |
| Consumption Analysis (Consumption Value and Volume) | ||
| Import Market Analysis (Import Value, Volume, and Key Supplying Markets) | ||
| Export Market Analysis (Export Value, Volume, and Key Destination Markets) | ||
| Wholesale Price Trend Analysis and Forecast | ||
| Regulatory Framework | ||
| List of Key Players | ||
| Logistics and Infrastructure | ||
| Seasonality Analysis | ||
| Thailand | Production Analysis (Area Harvested, Yield, and Production Volume) | |
| Consumption Analysis (Consumption Value and Volume) | ||
| Import Market Analysis (Import Value, Volume, and Key Supplying Markets) | ||
| Export Market Analysis (Export Value, Volume, and Key Destination Markets) | ||
| Wholesale Price Trend Analysis and Forecast | ||
| Regulatory Framework | ||
| List of Key Players | ||
| Logistics and Infrastructure | ||
| Seasonality Analysis | ||
| Vietnam | Production Analysis (Area Harvested, Yield, and Production Volume) | |
| Consumption Analysis (Consumption Value and Volume) | ||
| Import Market Analysis (Import Value, Volume, and Key Supplying Markets) | ||
| Export Market Analysis (Export Value, Volume, and Key Destination Markets) | ||
| Wholesale Price Trend Analysis and Forecast | ||
| Regulatory Framework | ||
| List of Key Players | ||
| Logistics and Infrastructure | ||
| Seasonality Analysis | ||
| Indonesia | Production Analysis (Area Harvested, Yield, and Production Volume) | |
| Consumption Analysis (Consumption Value and Volume) | ||
| Import Market Analysis (Import Value, Volume, and Key Supplying Markets) | ||
| Export Market Analysis (Export Value, Volume, and Key Destination Markets) | ||
| Wholesale Price Trend Analysis and Forecast | ||
| Regulatory Framework | ||
| List of Key Players | ||
| Logistics and Infrastructure | ||
| Seasonality Analysis | ||
| South America | Brazil | Production Analysis (Area Harvested, Yield, and Production Volume) |
| Consumption Analysis (Consumption Value and Volume) | ||
| Import Market Analysis (Import Value, Volume, and Key Supplying Markets) | ||
| Export Market Analysis (Export Value, Volume, and Key Destination Markets) | ||
| Wholesale Price Trend Analysis and Forecast | ||
| Regulatory Framework | ||
| List of Key Players | ||
| Logistics and Infrastructure | ||
| Seasonality Analysis | ||
| Peru | Production Analysis (Area Harvested, Yield, and Production Volume) | |
| Consumption Analysis (Consumption Value and Volume) | ||
| Import Market Analysis (Import Value, Volume, and Key Supplying Markets) | ||
| Export Market Analysis (Export Value, Volume, and Key Destination Markets) | ||
| Wholesale Price Trend Analysis and Forecast | ||
| Regulatory Framework | ||
| List of Key Players | ||
| Logistics and Infrastructure | ||
| Seasonality Analysis | ||
| Colombia | Production Analysis (Area Harvested, Yield, and Production Volume) | |
| Consumption Analysis (Consumption Value and Volume) | ||
| Import Market Analysis (Import Value, Volume, and Key Supplying Markets) | ||
| Export Market Analysis (Export Value, Volume, and Key Destination Markets) | ||
| Wholesale Price Trend Analysis and Forecast | ||
| Regulatory Framework | ||
| List of Key Players | ||
| Logistics and Infrastructure | ||
| Seasonality Analysis | ||
| Middle East | Saudi Arabia | Production Analysis (Area Harvested, Yield, and Production Volume) |
| Consumption Analysis (Consumption Value and Volume) | ||
| Import Market Analysis (Import Value, Volume, and Key Supplying Markets) | ||
| Export Market Analysis (Export Value, Volume, and Key Destination Markets) | ||
| Wholesale Price Trend Analysis and Forecast | ||
| Regulatory Framework | ||
| List of Key Players | ||
| Logistics and Infrastructure | ||
| Seasonality Analysis | ||
| Africa | Egypt | Production Analysis (Area Harvested, Yield, and Production Volume) |
| Consumption Analysis (Consumption Value and Volume) | ||
| Import Market Analysis (Import Value, Volume, and Key Supplying Markets) | ||
| Export Market Analysis (Export Value, Volume, and Key Destination Markets) | ||
| Wholesale Price Trend Analysis and Forecast | ||
| Regulatory Framework | ||
| List of Key Players | ||
| Logistics and Infrastructure | ||
| Seasonality Analysis | ||
| By Geography | North America | United States | Production Analysis (Area Harvested, Yield, and Production Volume) |
| Consumption Analysis (Consumption Value and Volume) | |||
| Import Market Analysis (Import Value, Volume, and Key Supplying Markets) | |||
| Export Market Analysis (Export Value, Volume, and Key Destination Markets) | |||
| Wholesale Price Trend Analysis and Forecast | |||
| Regulatory Framework | |||
| List of Key Players | |||
| Logistics and Infrastructure | |||
| Seasonality Analysis | |||
| Mexico | Production Analysis (Area Harvested, Yield, and Production Volume) | ||
| Consumption Analysis (Consumption Value and Volume) | |||
| Import Market Analysis (Import Value, Volume, and Key Supplying Markets) | |||
| Export Market Analysis (Export Value, Volume, and Key Destination Markets) | |||
| Wholesale Price Trend Analysis and Forecast | |||
| Regulatory Framework | |||
| List of Key Players | |||
| Logistics and Infrastructure | |||
| Seasonality Analysis | |||
| Dominican Republic | Production Analysis (Area Harvested, Yield, and Production Volume) | ||
| Consumption Analysis (Consumption Value and Volume) | |||
| Import Market Analysis (Import Value, Volume, and Key Supplying Markets) | |||
| Export Market Analysis (Export Value, Volume, and Key Destination Markets) | |||
| Wholesale Price Trend Analysis and Forecast | |||
| Regulatory Framework | |||
| List of Key Players | |||
| Logistics and Infrastructure | |||
| Seasonality Analysis | |||
| Guatemala | Production Analysis (Area Harvested, Yield, and Production Volume) | ||
| Consumption Analysis (Consumption Value and Volume) | |||
| Import Market Analysis (Import Value, Volume, and Key Supplying Markets) | |||
| Export Market Analysis (Export Value, Volume, and Key Destination Markets) | |||
| Wholesale Price Trend Analysis and Forecast | |||
| Regulatory Framework | |||
| List of Key Players | |||
| Logistics and Infrastructure | |||
| Seasonality Analysis | |||
| Costa Rica | Production Analysis (Area Harvested, Yield, and Production Volume) | ||
| Consumption Analysis (Consumption Value and Volume) | |||
| Import Market Analysis (Import Value, Volume, and Key Supplying Markets) | |||
| Export Market Analysis (Export Value, Volume, and Key Destination Markets) | |||
| Wholesale Price Trend Analysis and Forecast | |||
| Regulatory Framework | |||
| List of Key Players | |||
| Logistics and Infrastructure | |||
| Seasonality Analysis | |||
| Europe | United Kingdom | Production Analysis (Area Harvested, Yield, and Production Volume) | |
| Consumption Analysis (Consumption Value and Volume) | |||
| Import Market Analysis (Import Value, Volume, and Key Supplying Markets) | |||
| Export Market Analysis (Export Value, Volume, and Key Destination Markets) | |||
| Wholesale Price Trend Analysis and Forecast | |||
| Regulatory Framework | |||
| List of Key Players | |||
| Logistics and Infrastructure | |||
| Seasonality Analysis | |||
| Germany | Production Analysis (Area Harvested, Yield, and Production Volume) | ||
| Consumption Analysis (Consumption Value and Volume) | |||
| Import Market Analysis (Import Value, Volume, and Key Supplying Markets) | |||
| Export Market Analysis (Export Value, Volume, and Key Destination Markets) | |||
| Wholesale Price Trend Analysis and Forecast | |||
| Regulatory Framework | |||
| List of Key Players | |||
| Logistics and Infrastructure | |||
| Seasonality Analysis | |||
| Netherlands | Production Analysis (Area Harvested, Yield, and Production Volume) | ||
| Consumption Analysis (Consumption Value and Volume) | |||
| Import Market Analysis (Import Value, Volume, and Key Supplying Markets) | |||
| Export Market Analysis (Export Value, Volume, and Key Destination Markets) | |||
| Wholesale Price Trend Analysis and Forecast | |||
| Regulatory Framework | |||
| List of Key Players | |||
| Logistics and Infrastructure | |||
| Seasonality Analysis | |||
| Spain | Production Analysis (Area Harvested, Yield, and Production Volume) | ||
| Consumption Analysis (Consumption Value and Volume) | |||
| Import Market Analysis (Import Value, Volume, and Key Supplying Markets) | |||
| Export Market Analysis (Export Value, Volume, and Key Destination Markets) | |||
| Wholesale Price Trend Analysis and Forecast | |||
| Regulatory Framework | |||
| List of Key Players | |||
| Logistics and Infrastructure | |||
| Seasonality Analysis | |||
| France | Production Analysis (Area Harvested, Yield, and Production Volume) | ||
| Consumption Analysis (Consumption Value and Volume) | |||
| Import Market Analysis (Import Value, Volume, and Key Supplying Markets) | |||
| Export Market Analysis (Export Value, Volume, and Key Destination Markets) | |||
| Wholesale Price Trend Analysis and Forecast | |||
| Regulatory Framework | |||
| List of Key Players | |||
| Logistics and Infrastructure | |||
| Seasonality Analysis | |||
| Asia-Pacific | China | Production Analysis (Area Harvested, Yield, and Production Volume) | |
| Consumption Analysis (Consumption Value and Volume) | |||
| Import Market Analysis (Import Value, Volume, and Key Supplying Markets) | |||
| Export Market Analysis (Export Value, Volume, and Key Destination Markets) | |||
| Wholesale Price Trend Analysis and Forecast | |||
| Regulatory Framework | |||
| List of Key Players | |||
| Logistics and Infrastructure | |||
| Seasonality Analysis | |||
| India | Production Analysis (Area Harvested, Yield, and Production Volume) | ||
| Consumption Analysis (Consumption Value and Volume) | |||
| Import Market Analysis (Import Value, Volume, and Key Supplying Markets) | |||
| Export Market Analysis (Export Value, Volume, and Key Destination Markets) | |||
| Wholesale Price Trend Analysis and Forecast | |||
| Regulatory Framework | |||
| List of Key Players | |||
| Logistics and Infrastructure | |||
| Seasonality Analysis | |||
| Japan | Production Analysis (Area Harvested, Yield, and Production Volume) | ||
| Consumption Analysis (Consumption Value and Volume) | |||
| Import Market Analysis (Import Value, Volume, and Key Supplying Markets) | |||
| Export Market Analysis (Export Value, Volume, and Key Destination Markets) | |||
| Wholesale Price Trend Analysis and Forecast | |||
| Regulatory Framework | |||
| List of Key Players | |||
| Logistics and Infrastructure | |||
| Seasonality Analysis | |||
| Thailand | Production Analysis (Area Harvested, Yield, and Production Volume) | ||
| Consumption Analysis (Consumption Value and Volume) | |||
| Import Market Analysis (Import Value, Volume, and Key Supplying Markets) | |||
| Export Market Analysis (Export Value, Volume, and Key Destination Markets) | |||
| Wholesale Price Trend Analysis and Forecast | |||
| Regulatory Framework | |||
| List of Key Players | |||
| Logistics and Infrastructure | |||
| Seasonality Analysis | |||
| Vietnam | Production Analysis (Area Harvested, Yield, and Production Volume) | ||
| Consumption Analysis (Consumption Value and Volume) | |||
| Import Market Analysis (Import Value, Volume, and Key Supplying Markets) | |||
| Export Market Analysis (Export Value, Volume, and Key Destination Markets) | |||
| Wholesale Price Trend Analysis and Forecast | |||
| Regulatory Framework | |||
| List of Key Players | |||
| Logistics and Infrastructure | |||
| Seasonality Analysis | |||
| Indonesia | Production Analysis (Area Harvested, Yield, and Production Volume) | ||
| Consumption Analysis (Consumption Value and Volume) | |||
| Import Market Analysis (Import Value, Volume, and Key Supplying Markets) | |||
| Export Market Analysis (Export Value, Volume, and Key Destination Markets) | |||
| Wholesale Price Trend Analysis and Forecast | |||
| Regulatory Framework | |||
| List of Key Players | |||
| Logistics and Infrastructure | |||
| Seasonality Analysis | |||
| South America | Brazil | Production Analysis (Area Harvested, Yield, and Production Volume) | |
| Consumption Analysis (Consumption Value and Volume) | |||
| Import Market Analysis (Import Value, Volume, and Key Supplying Markets) | |||
| Export Market Analysis (Export Value, Volume, and Key Destination Markets) | |||
| Wholesale Price Trend Analysis and Forecast | |||
| Regulatory Framework | |||
| List of Key Players | |||
| Logistics and Infrastructure | |||
| Seasonality Analysis | |||
| Peru | Production Analysis (Area Harvested, Yield, and Production Volume) | ||
| Consumption Analysis (Consumption Value and Volume) | |||
| Import Market Analysis (Import Value, Volume, and Key Supplying Markets) | |||
| Export Market Analysis (Export Value, Volume, and Key Destination Markets) | |||
| Wholesale Price Trend Analysis and Forecast | |||
| Regulatory Framework | |||
| List of Key Players | |||
| Logistics and Infrastructure | |||
| Seasonality Analysis | |||
| Colombia | Production Analysis (Area Harvested, Yield, and Production Volume) | ||
| Consumption Analysis (Consumption Value and Volume) | |||
| Import Market Analysis (Import Value, Volume, and Key Supplying Markets) | |||
| Export Market Analysis (Export Value, Volume, and Key Destination Markets) | |||
| Wholesale Price Trend Analysis and Forecast | |||
| Regulatory Framework | |||
| List of Key Players | |||
| Logistics and Infrastructure | |||
| Seasonality Analysis | |||
| Middle East | Saudi Arabia | Production Analysis (Area Harvested, Yield, and Production Volume) | |
| Consumption Analysis (Consumption Value and Volume) | |||
| Import Market Analysis (Import Value, Volume, and Key Supplying Markets) | |||
| Export Market Analysis (Export Value, Volume, and Key Destination Markets) | |||
| Wholesale Price Trend Analysis and Forecast | |||
| Regulatory Framework | |||
| List of Key Players | |||
| Logistics and Infrastructure | |||
| Seasonality Analysis | |||
| Africa | Egypt | Production Analysis (Area Harvested, Yield, and Production Volume) | |
| Consumption Analysis (Consumption Value and Volume) | |||
| Import Market Analysis (Import Value, Volume, and Key Supplying Markets) | |||
| Export Market Analysis (Export Value, Volume, and Key Destination Markets) | |||
| Wholesale Price Trend Analysis and Forecast | |||
| Regulatory Framework | |||
| List of Key Players | |||
| Logistics and Infrastructure | |||
| Seasonality Analysis | |||


Key Questions Answered in the Report
How big is the mango market in 2026 and what is the growth outlook to 2031?
The mango market size is USD 58.40 billion in 2026 and is set to reach USD 70.60 billion by 2031 at a 3.87% CAGR.
Which country produces the most mangoes?
India leads with the mango production, supported by diverse agro-climatic zones.
Who is the largest exporter of mangoes?
Mexico tops exports, leveraging proximity to United States buyers.
Where is import demand growing the fastest?
China records the quickest import rise driven by urban income growth and e-grocery expansion.
Page last updated on:


