Maqui Berries Market Size and Share
Market Overview
| Study Period | 2021 - 2031 |
|---|---|
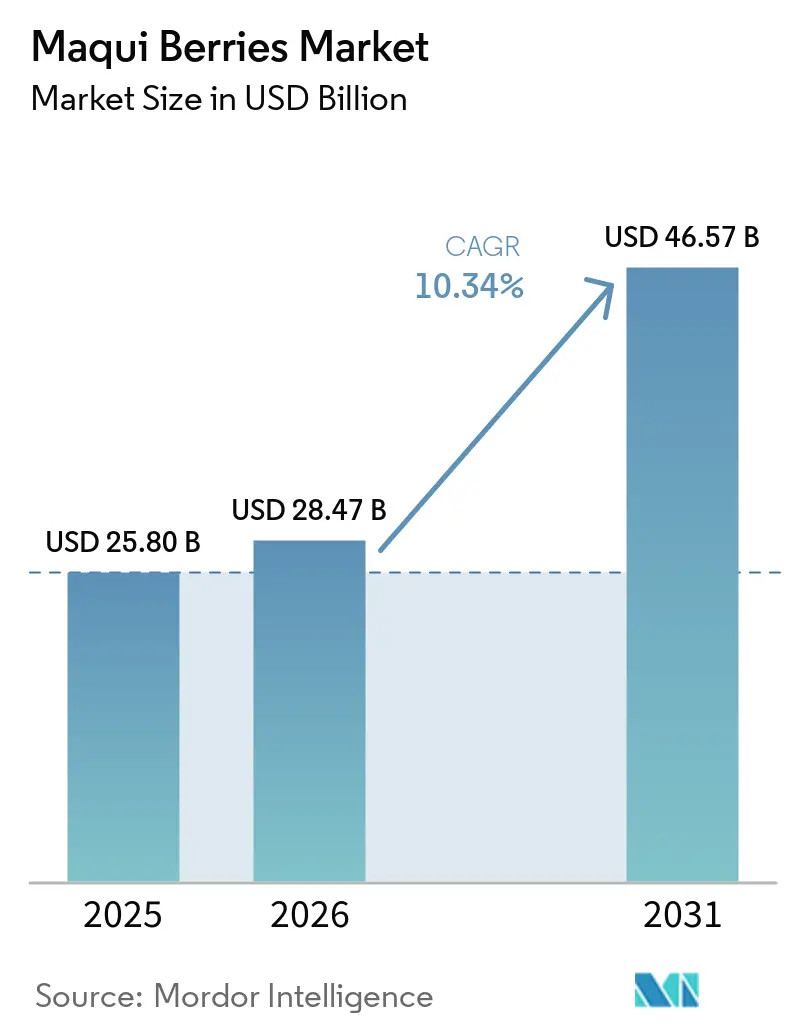
| Market Size (2026) | USD 28.47 Billion |
| Market Size (2031) | USD 46.57 Billion |
| Growth Rate (2026 - 2031) | 10.34% CAGR |
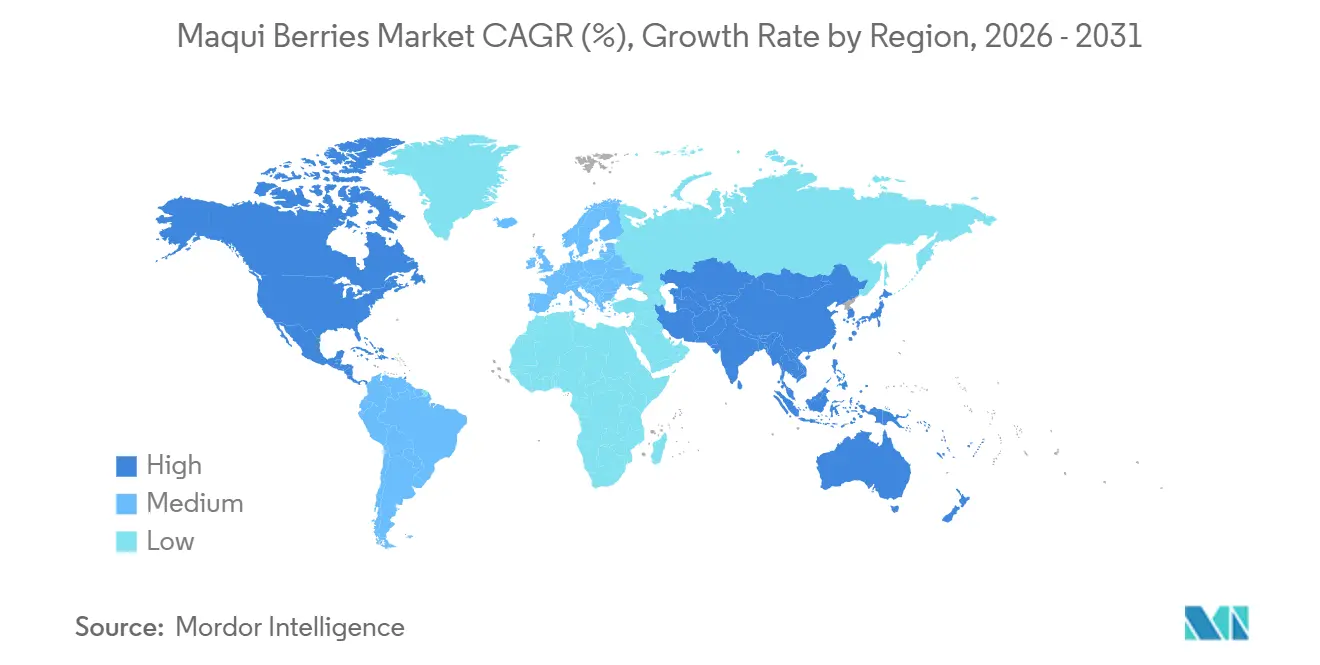
| Fastest Growing Market | Asia-Pacific |
| Largest Market | North America |
| Market Concentration | Medium |
Major Players *Disclaimer: Major Players sorted in no particular order Image © Mordor Intelligence. Reuse requires attribution under CC BY 4.0. | |
Maqui Berries Market Analysis by Mordor Intelligence
The maqui berries market size is valued at USD 25.80 billion in 2025 and is anticipated to grow from USD 28.47 billion in 2026 to USD 46.57 billion by 2031, registering a 10.34% CAGR through the forecast period (2026-2031). The maqui berry market is driven by growing demand for processed ingredient formats that ensure shelf stability, consistent anthocyanin content, and ease of use in supplements, pharmaceuticals, and functional foods. Key applications such as blood glucose support, eye health, cardiometabolic wellness, and clean-label nutrition are driving the prominence of premium extract formats. North America’s mature supplement ecosystem and the rapid growth in Asia-Pacific, following China’s regulatory expansion for maqui anthocyanins in 2025, are further boosting the market. Online retail is expanding consumer access, while organic-certified supply is gaining importance as procurement standards tighten in Europe and North America. The semi-consolidated market structure, reliance on wild-harvested materials, and stricter substantiation requirements are positioning vertically integrated Chilean processors and extract developers with strong supply chain control and clinical documentation as pivotal in shaping the market’s future.
Key Report Takeaways
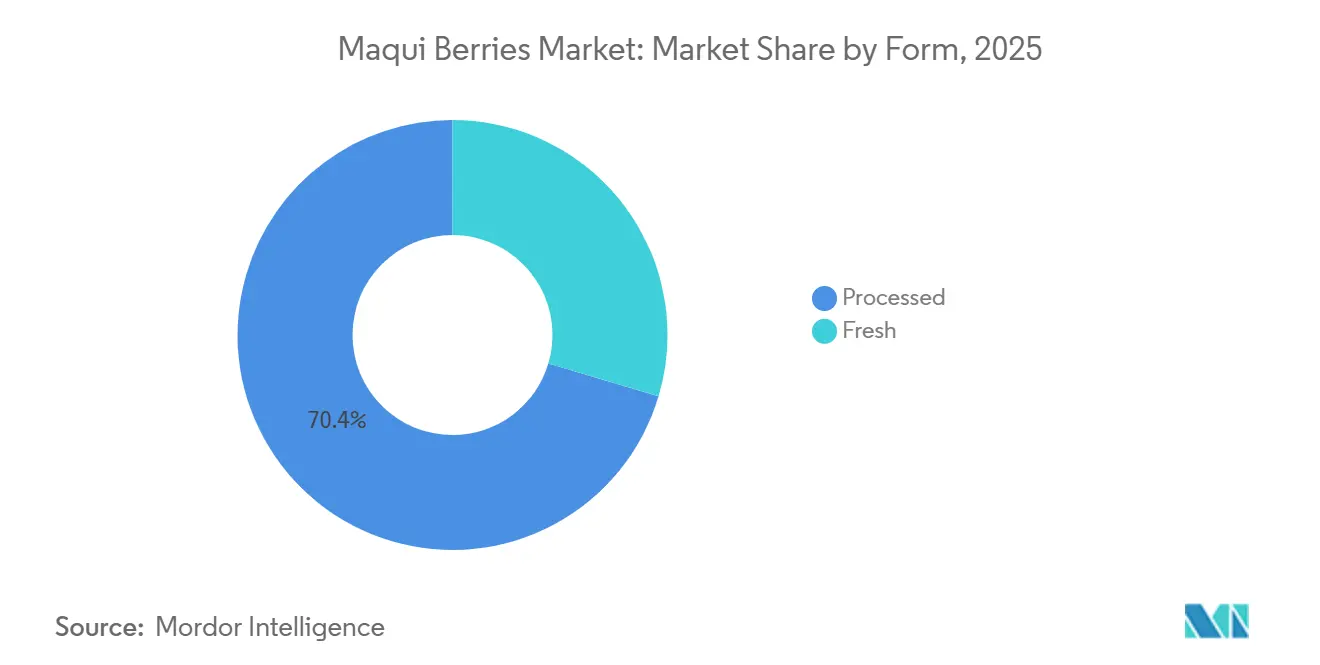
- By form, processed formats held the largest 70.4% share of the maqui berries market size in 2025 and also projected at the fastest CAGR at 11.3% through 2026-2031.
- By nature, conventional ingredients held 59% of the maqui berries market share in 2025, while organic ingredients are projected to grow at 11.0% CAGR through 2026-2031.
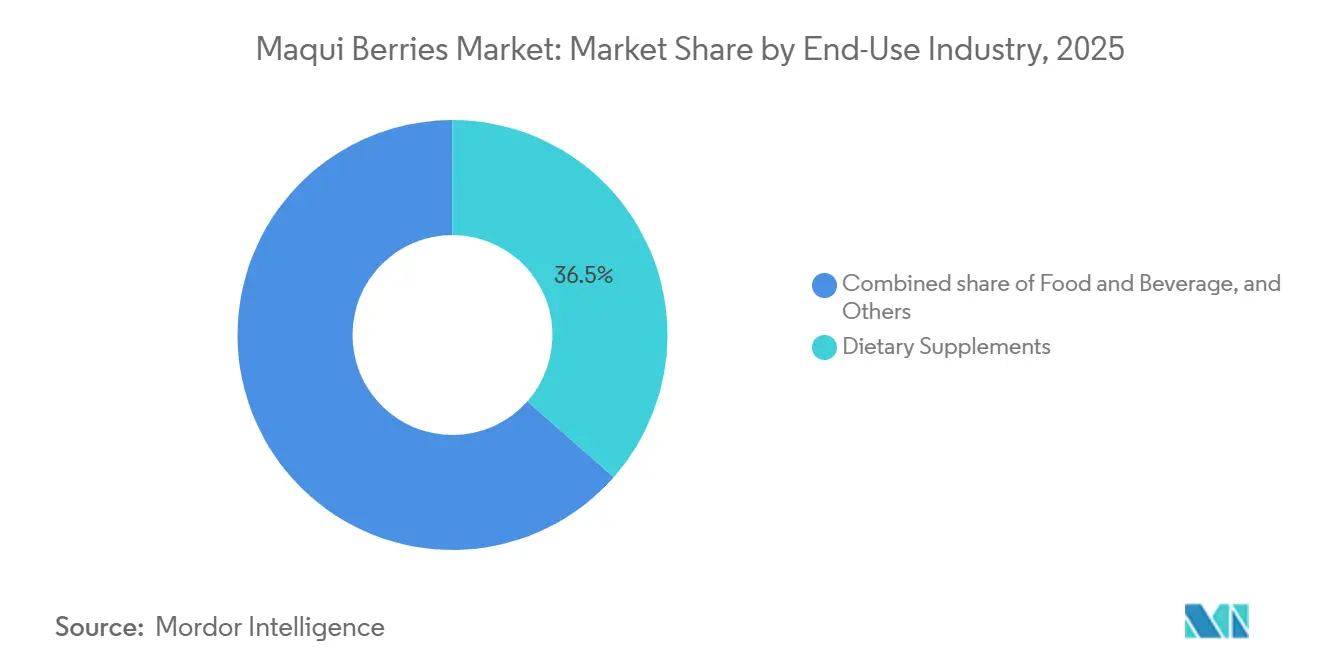
- By end-use industry, dietary supplements held 36.5% of the maqui berries market size in 2025, while pharmaceutical and nutraceutical applications are projected to grow at 13.0% CAGR through 2026-2031.
- By distribution channel, business-to-business ingredient supply held 42% of the maqui berries market share in 2025, while online retail are projected to grow at 14.8% CAGR through 2026-2031.
- By geography, North America held 31.6% of the maqui berries market share in 2025, while Asia-Pacific are projected to grow at 11.2% CAGR through 2026-2031.
Note: Market size and forecast figures in this report are generated using Mordor Intelligence’s proprietary estimation framework, updated with the latest available data and insights as of 2026.
Global Maqui Berries Market Trends and Insights
Drivers Impact Analysis*
| Driver | (~) % Impact on CAGR Forecast | Geographic Relevance | Impact Timeline |
|---|---|---|---|
| Rising superfruit demand in wellness products | +2.5% | Global, with North America and Europe as core markets | Medium term (2-4 years) |
| Plant-based and clean-label consumption growth | +1.8% | North America and Europe | Medium term (2-4 years) |
| Standardized glycemic-control extract adoption | +1.5% | Global, primarily North America, Europe, and the Asia-Pacific | Long term (≥ 4 years) |
| E-commerce and direct-to-consumer channel expansion | +1.2% | North America, Europe, and the Asia-Pacific core | Short term (≤ 2 years) |
| Natural anthocyanin colorant substitution demand | +0.9% | Europe and North America | Medium term (2-4 years) |
| Eye-health and digital-fatigue formulation uptake | +0.8% | Japan, South Korea, and North America | Medium term (2-4 years) |
| Source: Mordor Intelligence | |||
Rising Superfruit Demand in Wellness Products
The maqui berry market is growing as consumers increasingly prefer nutrient-rich botanical ingredients offering multiple health benefits in a single formulation. Known for its anthocyanin content, maqui berry is linked to blood sugar regulation, eye health, and antioxidant protection, making it a strong candidate for premium product positioning. This is particularly relevant for preventive nutrition products targeting consumers seeking specific, well-defined benefits. According to the International Diabetes Federation, 589 million adults worldwide are anticipated to be living with diabetes in 2024, along with 634.8 million adults with impaired glucose tolerance. This underscores the sustained demand for glycemic support ingredients[1]Source: International Diabetes Federation, “IDF Diabetes Atlas, 11th Edition,” diabetesatlas.org. As a result, the maqui berry market is leveraging the broader superfruit trend, particularly through scientifically validated, standardized, and consistently dosed product formats, solidifying its position as a valuable ingredient in wellness products.
Plant-Based and Clean-Label Consumption Growth
The maqui berries market is closely tied to the rise of plant-based and clean-label product development, particularly in the United States and Europe, where ingredient transparency is a key consumer demand. The Plant Based Foods Association reported in 2025 that plant-based products achieved 59% household penetration and a 79% repeat purchase rate in the United States grocery retail, driving demand for superfruit powders and extracts[2]Source: Plant Based Foods Association, “2025 Retail Sales Data,” plantbasedfoods.org. Plant-based supplement protein powders and liquid formats also grew by 11% in dollar value and 13% in unit volume, reaching USD 450 million in 2025, creating opportunities for maqui ingredients in wellness mixes and green blends. With clean-label requirements driving minimal processing, maqui berry extract and freeze-dried powder are well-positioned to meet these expectations. This adaptability allows the maqui berries market to grow through both stand-alone products and integration into broader plant-based formulations, solidifying its role in the evolving consumer market.
Standardized Glycemic-Control Extract Adoption
The maqui berries market is growing for standardized extracts used for blood glucose management. Millions of adults were in a state of impaired glucose tolerance, representing a larger preventive population compared to diagnosed diabetics and highlighting significant opportunities for nutritional applications. Standardized maqui extracts, such as Delphinol, with defined anthocyanin content, enable compliant product claims for glucose regulation. A January 2026 study in Food and Function reported that maqui berry extract inhibits dipeptidyl peptidase IV, supporting its role in modulating postprandial glycemia. These advancements are driving the market toward targeted nutraceutical and pharmaceutical applications, solidifying its relevance beyond antioxidant positioning.
Natural Anthocyanin Colorant Substitution Demand
The maqui berry market is also supported by growing interest in reformulating natural color systems, especially in food and beverage applications, where synthetic additives are under closer review. The European Food Safety Authority continues to work within the framework of European Union Regulation No. 1333/2008, and that regulatory backdrop continues to put pressure on manufacturers to consider alternative color solutions in selected categories[3]Source: European Food Safety Authority, “Re-evaluation of Synthetic Food Colorants Under EU Regulation No. 1333/2008,” efsa.europa.eu. Maqui berry concentrate and extract add commercial value here because they can deliver both anthocyanin color and a functional nutrition story in a single ingredient. That combination is useful for beverage and snack manufacturers looking to avoid adding one ingredient for color and another for wellness positioning. The maqui berries market, therefore, gains most clearly from colorant-substitution demand in premium products, where natural labeling and added health value can justify a higher ingredient cost.
Restraint Impact Analysis*
| Restraint | (~) % Impact on CAGR Forecast | Geographic Relevance | Impact Timeline |
|---|---|---|---|
| Wild-harvest dependence and limited scalable supply | -1.5% | Global, impact concentrated in Chilean sourcing regions | Long term (≥ 4 years) |
| Premium pricing versus mainstream berry ingredients | -1.2% | Asia-Pacific and price-sensitive emerging markets | Medium term (2-4 years) |
| Anthocyanin degradation and energy-intensive processing | -0.8% | Global | Medium term (2-4 years) |
| Batch variability and claims-standardization hurdles | -0.6% | Global, particularly in Europe, the United States, and Japan | Long term (≥ 4 years) |
| Source: Mordor Intelligence | |||
Wild-Harvest Dependence and Limited Scalable Supply
The maqui berry market still faces a fundamental supply constraint because most commercial fruit comes from wild-harvested sources in southern Chile rather than from large-scale cultivated orchards. This limits expansion because global buyers depend on a narrow harvest window and on sourcing networks that can collect, aggregate, and process fruit fast enough to preserve anthocyanin quality. Research published in Foods in 2024 identified 21 Chilean companies involved in maqui export and marketing, but much of that structure still reflects trading and aggregation rather than full supply control from cultivation through extraction. That means climate events, labor availability, and harvest yield variability can move directly into price swings and availability gaps for downstream formulators. The maqui berries market, therefore, rewards suppliers that have deeper cooperative networks, stronger procurement discipline, and better processing assets near the harvest base.
Premium Pricing Versus Mainstream Berry Ingredients
The maqui berries market is held back in some applications by a clear price gap versus blueberry, acai, elderberry, and other berry ingredients that are easier to source at scale. This gap is hard to close because wild-harvest collection, single-origin dependence, freeze-drying, and standardization all add cost before the ingredient reaches a finished product manufacturer. The issue is most visible in mainstream foods and beverages, where formulation budgets are tightly managed and where the marketing value of maqui may not offset the higher input cost. Price-sensitive regions also have local herbal or fruit alternatives that can fill a similar wellness position at a lower price point, even if the scientific support is weaker. For the maqui berries market, this means premium clinical segments remain more attractive than mass retail categories until supply becomes broader and cost structures improve.
*Our forecasts treat driver/restraint impacts as directional, not additive. The impact forecasts reflect baseline growth, mix effects, and variable interactions.
Segment Analysis
By Form: Processed Formats Consolidate Ingredient Commercialization
Processed formats held a 70.4% share of the maqui berry market in 2025 and are forecast to expand at a 11.3% CAGR through 2026-2031. This makes processed formats both the largest and fastest-growing segment in the maqui berries market, underscoring how central ingredient conversion has become to commercialization. The strongest demand lies in freeze-dried powder, juice concentrate, and standardized extract, as these formats better fit supplement, pharmaceutical, and functional food production than fresh fruit. Buyers also prefer them because they offer more stable anthocyanin levels and easier dosage control across large production runs. In the maqui berries industry, processing capability is no longer a supporting function, but the main gateway to participation in higher-value channels.
Freeze-dried powder continues to lead in volume adoption within processed formats because it balances anthocyanin retention with broader use across powders, capsules, mixes, and premium foods. Standardized extracts such as Delphinol sit at the high end because they carry clinical documentation and a more defensible branded position in the maqui berry market. Juice and liquid concentrates remain relevant when formulators seek both natural color and functional positioning in beverages and foods. Fresh berry supply accounts for less than 30% of 2025 value, and its role stays limited by perishability and Chile’s single annual harvest cycle. This leaves the maqui berry market increasingly split between commodity-processed formats on one side and contract-based, clinical-grade extracts on the other.


By Nature: Organic Certification Reshapes Premium Supply Access
Conventional ingredients held 59% of the maqui berries market share in 2025, while organic ingredients are projected to grow at a 11.0% CAGR through 2026-2031. This combination shows that most current supply still comes from conventional channels, but premium growth is moving faster toward certified organic products. The reason is straightforward because buyers in Europe and North America increasingly use certification as a screening tool for premium shelf placement and for branded online supplement stacks. Organic supply is still limited because small harvest and processing networks in southern Chile must meet stricter traceability and documentation requirements before they can access these channels. The maqui berries market is therefore creating a two-tier structure in which certified suppliers gain access to higher-value contracts, while uncertified operators compete more aggressively on bulk pricing.
The trend is strongest in Germany, the United Kingdom, and the Netherlands, where procurement teams are increasingly combining organic requirements with broader sustainability expectations. The European Commission’s Farm to Fork Strategy, which aims to achieve 25% of agricultural land in the European Union as organic by 2030, is reinforcing that procurement direction across food supply chains. Buyers are also increasingly requesting proof of responsible wild harvest and of community benefits linked to Chilean sourcing. That additional scrutiny raises compliance costs, but it also gives well-documented suppliers a stronger position in the maqui berries market. Over time, certified traceability is likely to matter almost as much as anthocyanin content for entry into premium channels.
By End-Use Industry: Supplements Lead as Pharma and Nutraceutical Gains Ground
Dietary supplements accounted for 36.5% of revenue in 2025, making them the largest end-use segment in the maqui berries market. The pharmaceutical and nutraceutical segment is the fastest segment, with a projected 13.0% CAGR through 2026-2031. Supplements led by maqui berry align with established demand areas such as blood glucose support, eye health, healthy aging, and cardiometabolic wellness. It also fits well into capsules, tablets, powders, and newer chewable formats, allowing a clinical-dose narrative without heavy reformulation. Across the maqui berries industry, this gives supplement brands the clearest route to monetize the ingredient’s science-led positioning.
The growth case is even stronger in pharmaceutical and nutraceutical use because standardized extracts can be presented with tighter specifications and more structured documentation. The International Diabetes Federation’s 2024 numbers keep this pathway relevant by pointing to a very large preventive consumer pool for glucose-related products. At the same time, eye-health formulations built around branded maqui extracts are widening the application base beyond glycemic management. Food and beverage applications still offer significant volume potential for powders and concentrates, but thermal stability issues limit their use in some mainstream formats. Personal care and animal nutrition remain smaller, but both could open new routes for the maqui berries market, where antioxidant and photoprotective properties carry commercial value.
By Distribution Channel: B2B Anchors Volume While Online Retail Drives Value Growth
Business-to-business (B2B) ingredient supply accounted for 42% of 2025 revenue, which made it the largest distribution channel in the maqui berries market. Online retail is the fastest channel, with a projected 14.8% CAGR through 2026-2031. This pairing shows that bulk ingredient trade still carries the market on a volume basis, but value growth is shifting toward digital consumer-facing sales. Chilean exporters, global ingredient distributors, and formulation houses remain central because most maqui volume still enters the value chain as an input rather than as a branded finished good. Even so, the maqui berries market is clearly moving toward more visible consumer products built on clinical storytelling and focused health outcomes.
Online retail is expanding quickly because engaged supplement buyers search for ingredient data, dosage, and origin before making a purchase. That shopping behavior suits maqui berry well, as its strongest commercial forms rely on evidence-based positioning rather than low-price convenience. Specialty health stores and pharmacies remain important because they provide premium products with a more trusted shelf presence, especially in eye health and blood sugar support categories. Supermarkets and hypermarkets see higher traffic, but current penetration remains limited because maqui products compete with lower-cost superfruit alternatives that enjoy better mainstream recognition. The maqui berries market will likely reward suppliers that keep strong B2B relationships while also supporting digital brand launches with claims guidance, marketing assets, and technical education.
Geography Analysis
North America held 31.6% of the maqui berries market share in 2025, supported by established supplement retail, high willingness to pay for science-led botanicals, and strong ingredient distribution networks. The region also benefits from early commercial use of branded extracts such as Delphinol and MaquiBright in practitioner-recommended and consumer supplement lines. Those products tend to hold shelf space longer because their positioning is tied to specific health outcomes rather than to a general antioxidant message. This gives North America a stable demand base even as newer regions accelerate.
Asia-Pacific is the fastest regional cluster, with an 11.2% CAGR through 2026-2031. Japan and South Korea add depth through established supplement demand, particularly in eye-health formats, while India and Australia are moving gradually into the consideration set for functional food formulators. The Middle East and Africa remain the smallest combined base in the maqui berries market, but Saudi Arabia, the United Arab Emirates, South Africa, and Egypt are the main early demand points, supported in part by chronic disease reduction agendas such as Saudi Vision 2030.
South America has a different role because it combines origin, processing, and rising domestic consumption in the same regional system. Chile remains the core supply base, but domestic commercialization is increasingly important as local processors seek to capture additional value through finished products rather than just ingredient exports. That shift matters because it shows how origin-market companies are beginning to build export and domestic revenue simultaneously. For the maqui berries market, South America is not only a source region but also a testing ground for more integrated commercial models. Europe is projected to grow, driven by strong demand for organic-certified, traceable botanical ingredients. The European Food Safety Authority’s regulatory environment and the continued policy direction on ingredient scrutiny encourage reformulation toward cleaner, more natural input systems in selected categories.

Competitive Landscape
The maqui berries market is projected to remain moderate, with key players including South-Am Freeze Dry SpA (Van Drunen Farms), Bayas del Sur S.A., HP Ingredients Corp., Maqui New Life S.A., and Sunfood Corporation dominating the market in 2025. This structure gives leading suppliers the scale they need, but it still leaves enough room for regional formulators, distributors, and private-label operators to compete in selected niches. Competition is split across two broad models in the maqui berries market. One model depends on harvest access, freeze-drying capacity, and Chile-based processing control. The other depends on branded extracts, intellectual property, and clinical dossiers that support premium pricing and stronger regulatory positioning.
Maqui New Life S.A. stands out in the second group because its Delphinol and MaquiBright ingredients are tied closely to clinical differentiation and specification-driven selling. That model is hard to copy quickly because evidence generation takes time and because regulatory acceptance depends on consistent product profiles. Anklam Extrakt adopted a different approach in May 2025, partnering with Huisong Pharmaceuticals to distribute maqui anthocyanin extracts in China following the new raw material approval there. This kind of partnership allows faster entry into new regions without the cost and delay of building local manufacturing from the ground up. In the maqui berries market, these moves show that channel access and documentation are becoming as important as raw ingredient availability.
An important development in the market is the shift toward finished consumer products designed for specialized use cases. This trend reflects growing consumer demand for tailored products that address specific needs, such as health benefits or functional applications. While smaller trading firms remain active, they are likely to face increased margin pressure if Chilean processors continue to establish direct brand relationships and as digital procurement becomes more prevalent. These changes are reshaping the competitive landscape, emphasizing the importance of adaptability and strategic partnerships. Consequently, the maqui berries market favors companies that can ensure supply reliability, maintain specification control, and provide commercial support for finished-product launches, enabling them to meet evolving market demands effectively.
Maqui Berries Industry Leaders
South-Am Freeze Dry SpA (Van Drunen Farms)
Bayas del Sur S.A.
HP Ingredients Corp.
Maqui New Life S.A.
Sunfood Corporation
- *Disclaimer: Major Players sorted in no particular order


Recent Industry Developments
- February 2026: NOW Health Group, Inc. launched the Eye Moisturize with MaquiBright veg capsule line, a 60 mg standardized maqui berry extract formulation targeting tear production support and digital eye fatigue, marking a significant expansion of MaquiBright-based consumer products in North American pharmacy and online retail channels.
- May 2025: Anklam Extrakt GmbH and Huisong Pharmaceuticals established a distribution partnership for maqui berry anthocyanin extracts targeting the Chinese market, directly capitalizing on the China National Health Commission new food raw material approval and positioning Anklam as an early mover in the world’s largest food ingredient market.
- February 2025: China’s National Health Commission officially approved maqui berry anthocyanins as a new food raw material, requiring a minimum 35% total anthocyanin content and permitting use across general food product categories, effectively creating a new commercial regulatory lane for maqui berry ingredient suppliers in China.


Research Methodology Framework and Report Scope
Market Definitions and Key Coverage
Our study defines the maqui berries market as the global trade and consumption of whole fresh fruit and processed derivatives, including powders, extracts, juices, and oils, sourced from Aristotelia chilensis and sold for food, beverage, nutraceutical, personal care, and animal nutrition applications.
Scope exclusion: wild-harvested berries entering informal local barter networks are excluded because documented volumes and pricing are unavailable.
Segmentation Overview
- By Form
- Fresh
- Processed
- Freeze-Dried Powder
- Juice and Liquid Concentrate
- Standardized Extract
- Dried Whole Berry and Flakes
- By Nature
- Organic
- Conventional
- By End-Use Industry
- Food and Beverage
- Dietary Supplements
- Pharmaceutical and Nutraceutical
- Personal Care and Cosmetics
- Animal Nutrition
- By Distribution Channel
- B2B Ingredient Suppliers
- Supermarkets and Hypermarkets
- Specialty Health Stores
- Pharmacies and Drug Stores
- Online Retail
- By Geography
- North America
- United States
- Canada
- Mexico
- Rest of North America
- South America
- Chile
- Brazil
- Argentina
- Rest of South America
- Europe
- Germany
- United Kingdom
- France
- Spain
- Italy
- Netherlands
- Denmark
- Russia
- Rest of Europe
- Asia-Pacific
- China
- Japan
- India
- South Korea
- Australia
- New Zealand
- Rest of Asia-Pacific
- Middle East
- Saudi Arabia
- United Arab Emirates
- Turkey
- Rest of Middle East
- Africa
- South Africa
- Egypt
- Rest of Africa
- North America
Detailed Research Methodology and Data Validation
Primary Research
We spoke with Chilean exporters, North American supplement formulators, European private-label beverage buyers, and Asia-Pacific online health food retailers. Their inputs refined volume conversion factors, typical contract prices, and emerging channel preferences, allowing us to bridge gaps left by desk sources and to cross-check early model outputs.
Desk Research
Mordor analysts first assembled publicly available agriculture and trade data from Chile's ODEPA, UN Comtrade, and the USDA Foreign Agricultural Service, which quantify export tonnage and average unit values. We then reviewed food safety notifications from the European Commission's RASFF, patent filings in Questel for maqui-based functional claims, and position papers from the International Berry Health Association to map ingredient demand trends.
Next, annual reports of listed super fruit suppliers, investor presentations of specialty ingredient blenders, and press releases covering freeze-dry capacity expansions provided indicative price points and capacity additions. Paid databases such as D&B Hoovers and Dow Jones Factiva supplied revenue splits and shipment news that helped benchmark leading vendors' scale. This list is illustrative; many other authoritative publications were referenced for data validation and contextual insight.
Market-Sizing & Forecasting
A blended top-down and bottom-up approach underpins our model. Global harvest volumes and export flows were reconstructed from customs data, adjusted for moisture loss and standard processing yields, then valued using a weighted average selling price that our team validated through supplier interviews. Select bottom-up checks, such as sampled brand sales and ingredient roll-ups in key countries, served to stress-test totals.
Key variables include cultivated acreage in Chilean Regions IX and XIV, freeze-dry throughput, functional beverage launch counts, e-commerce penetration of superfoods, and regional disposable income shifts. A multivariate regression integrates these drivers, while scenario analysis captures extreme weather shocks that could curb supply.
Data Validation & Update Cycle
Before publication, secondary metrics like antioxidant-rich product launches and retail price trackers are compared against model trends. Variances beyond set thresholds trigger re-checks, followed by a two-step peer review. Reports refresh annually; material events, such as crop failures, tariff changes, or major M&A, prompt interim updates so clients receive the most current baseline.
Why Mordor's Maqui Berries Baseline Commands Reliability
Published estimates often diverge because firms vary ingredient scope, processing yield assumptions, and update cadence.
Key gap drivers include whether revenues from cosmetic actives are counted, the choice of fresh-to-powder conversion ratios, treatment of wholesale versus retail pricing, and the currency conversion month each publisher uses. Our study states every assumption, updates figures yearly, and revisits them when droughts or policy shifts alter supply.
Benchmark comparison
| Market Size | Anonymized source | Primary gap driver |
|---|---|---|
| USD 25.80 billion (2025) | Mordor Intelligence | - |
| USD 29.09 billion (2024) | Global Consultancy A | Includes projected cosmetic actives and double counts private-label sales |
| USD 0.66 billion (2024) | Industry Journal B | Excludes processed powders; values harvest only at farm gate rates |
The comparison shows how differing scopes and price anchors create wide swings. By selecting transparent variables, validating them with market actors, and refreshing the model on a fixed schedule, Mordor Intelligence delivers a balanced, decision-ready baseline clients can trace and reproduce.


Key Questions Answered in the Report
What is the 2026 value of maqui berries sales globally?
The maqui berries market is valued at USD 28.47 billion in 2026.
Which form leads commercial demand for maqui berry ingredients?
Processed formats are the largest segment, accounting for 70.4% of the 2025 value.
Why are dietary supplements the main use case for maqui berry?
Dietary supplements led with 36.5% of 2025 revenue because maqui berry aligns well with glycemic support, eye health, and healthy aging product demand.
Which region is growing the fastest for maqui berry products?
Asia-Pacific is the fastest-growing region, with a 11.2% CAGR between 2026-2031, driven by China’s 2025 approval of maqui berry anthocyanins as a new food raw material.
What is limiting wider adoption in foods and beverages?
Premium pricing, reliance on wild-harvested ingredients, and anthocyanin sensitivity during processing make broad food and beverage adoption slower than that of supplements.
Page last updated on:


