
Fruits And Vegetables Market Analysis by Mordor Intelligence
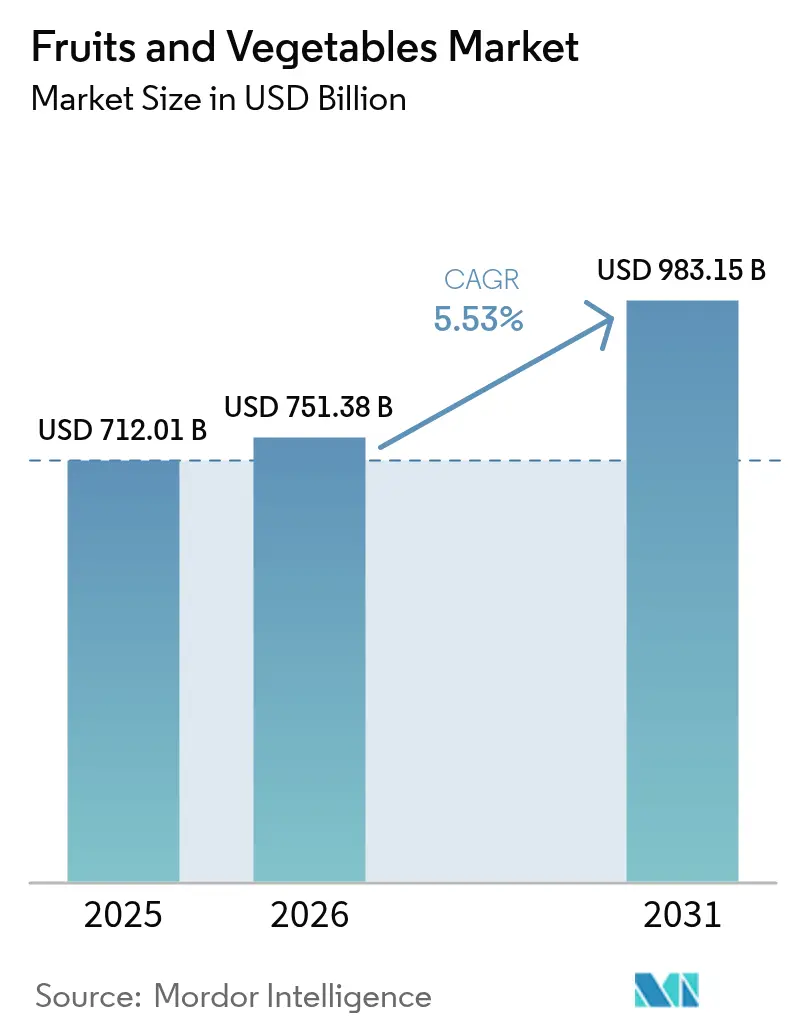
fruits and vegetables market size in 2026 is estimated at USD 751.38 billion, growing from 2025 value of USD 712.01 billion with 2031 projections showing USD 983.15 billion, growing at 5.53% CAGR over 2026-2031. Expanding controlled-environment agriculture (CEA), robust cross-border e-commerce, and rising investments in cold-chain infrastructure continue to reshape supply-demand dynamics, stabilizing volumes and margins across the value chain. Asia-Pacific retains scale advantages through integrated logistics corridors, while Africa is moving from subsistence production toward export-oriented growth on the back of mobile-enabled payment ecosystems and improving phytosanitary compliance. Innovations such as gene-edited, longer-lasting cultivars and blockchain-based traceability are helping suppliers command price premiums, even as regulators enforce stricter maximum residue limits and climate-driven soil salinity pressures intensify production risks.
Key Report Takeaways
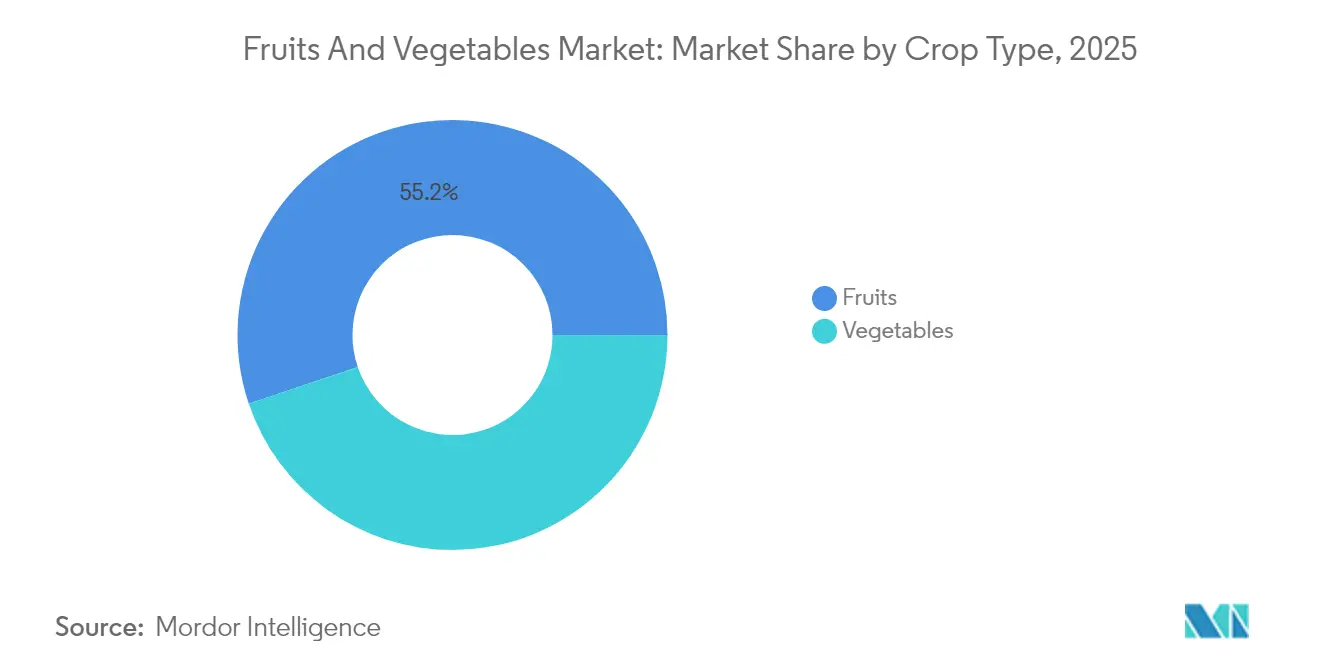
- By crop type, fruits led with 55.18% of the fruits and vegetables market share in 2025, while vegetables are projected to grow at a 7.46% CAGR from 2026 to 2031.
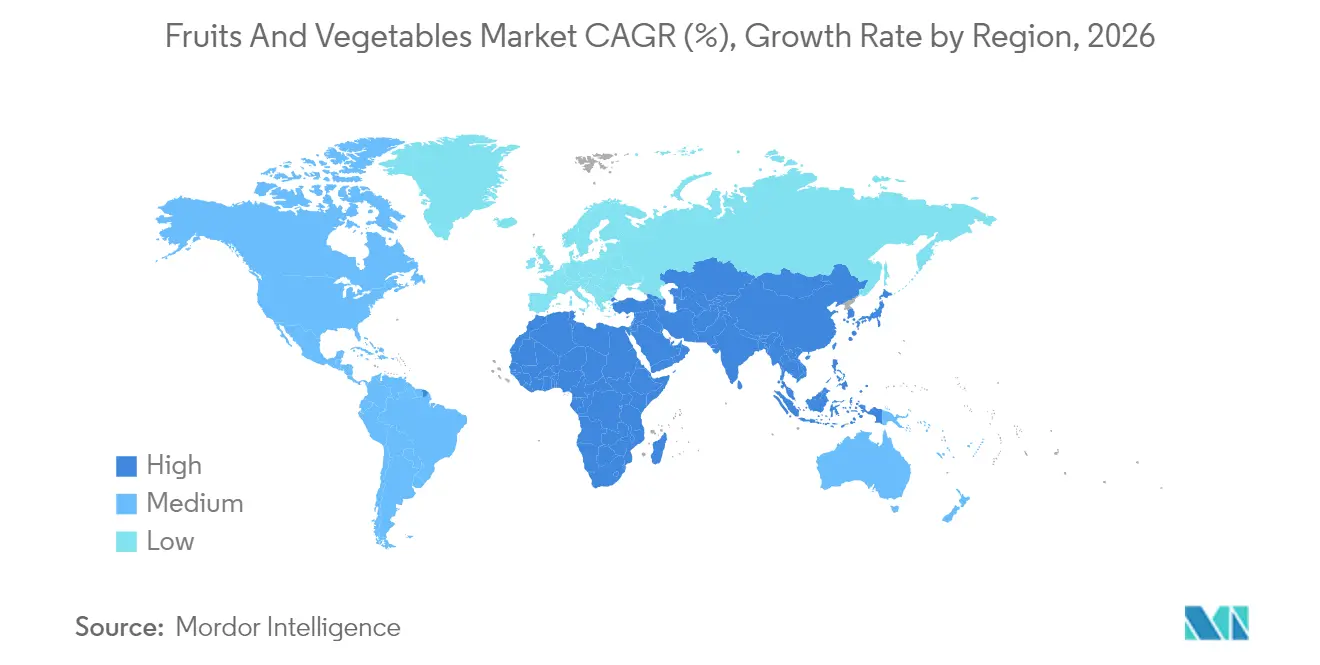
- By geography, Asia-Pacific held 42.25% of the fruits and vegetables market size in 2025, whereas Africa is projected to post the fastest 6.11% CAGR through 2031.
Note: Market size and forecast figures in this report are generated using Mordor Intelligence’s proprietary estimation framework, updated with the latest available data and insights as of 2026.
Fruits And Vegetables Market Trends and Insights
Drivers Impact Analysis*
| Driver | (~)% Impact on CAGR Forecast | Geographic Relevance | Impact Timeline |
|---|---|---|---|
| Expansion of controlled-environment agriculture (CEA) acreage | +1.2% | Global, with concentration in North America, Europe, and East Asia | Medium term (2-4 years) |
| Surge in cross-border e-commerce for fresh produce | +0.8% | Global, strongest in Asia-Pacific and North America | Short term (≤ 2 years) |
| Adoption of gene-edited fruit cultivars with longer shelf life | +0.6% | North America, Europe, with gradual expansion to the Asia-Pacific | Long term (≥ 4 years) |
| Large-scale public campaigns linking produce intake with immunity | +0.9% | Global, with emphasis on developed markets | Medium term (2-4 years) |
| Development of cold-chain corridors in emerging economies | +1.1% | Africa, South America, and Southeast Asia | Medium term (2-4 years) |
| Retailer commitments to zero-plastic packaging driving demand for sturdy produce | +0.4% | Europe and North America | Short term (≤ 2 years) |
| Source: Mordor Intelligence | |||
Expansion of controlled-environment agriculture (CEA) acreage
CEA capacity is transitioning from traditional greenhouse setups to fully automated vertical farms capable of operating in dense urban centers. The United States Department of Agriculture projects 35% annual growth in CEA acreage through 2027, with the global count of vertical farming installations rising from 2,000 in 2024 to 8,500 by 2030[1]Source: USDA Economic Research Service, “Controlled Environment Agriculture Expansion Projections,” ers.usda.gov. Such systems mitigate the weather-related crop losses that historically undermined the fruits and vegetables market and ensure year-round output of pesticide-free leafy greens and herbs that capture price premiums at retail. Below-average land and water footprints further reinforce adoption, while proximity to urban demand centers shortens distribution, lowering spoilage and logistics costs.
Surge in cross-border e-commerce for fresh produce
Digital marketplaces have unlocked farm-to-consumer channels beyond domestic borders, with cross-border e-commerce shipments of perishable produce rising 45% year-over-year in 2024 across key Asian corridors[2]Source: Asian Development Bank, “Cross-Border E-Commerce Growth in Fresh Produce Markets,” adb.org. Advanced cold-chain networks now guarantee 48-72-hour delivery windows over continental distances, enabling rapid scaling of premium varieties that were once limited by seasonality. Producers realize 10-15 percentage-point margin lifts by bypassing traditional wholesale layers, while consumers have a price reduction for comparable quality, supporting sustained volume growth in the fruits and vegetables market.
Adoption of gene-edited fruit cultivars with longer shelf life
Gene-editing technologies are creating fruit varieties with significantly extended shelf life, addressing the USD 400 billion annual global food waste problem concentrated in perishable produce categories. Tropic Biosciences' non-browning banana varieties, approved for cultivation in multiple markets during 2024, maintain quality for 14-21 days compared to 5-7 days for conventional varieties. These innovations particularly benefit emerging market producers seeking to access premium export markets where extended shelf life translates directly into higher farmgate prices and expanded geographic reach.
Large-scale public campaigns linking produce intake with immunity
The Centers for Disease Control and Prevention highlighted the immune benefits of fruit and vegetable consumption in 2024, coinciding with a 12% spike in category purchases during the first quarter of 2025[3]Source: Centers for Disease Control and Prevention, “Nutrition Guidelines and Immunity Enhancement,” cdc.gov. WHO revised dietary guidelines recommend 5-7 servings of fruits and vegetables per day, increased from the previous 5-serving recommendation. This change increases demand in markets where consumers follow these guidelines, particularly among older populations in developed nations. Additionally, government health initiatives and public awareness campaigns promoting these dietary guidelines are anticipated to further drive market expansion in both developed and developing regions.
Restraints Impact Analysis*
| Restraint | (~) % Impact on CAGR Forecast | Geographic Relevance | Impact Timeline |
|---|---|---|---|
| Intensifying labor shortages in harvesting and post-harvest handling | -1.8% | Global, acute in North America, Europe, and Australia | Short term (≤ 2 years) |
| Soil salinity escalation in coastal farmlands | -0.9% | Coastal regions globally, particularly the Mediterranean, California, and Southeast Asia | Long term (≥ 4 years) |
| Rising rejection rates at borders due to maximum residue limits | -0.7% | Global trade routes affect exporters to Europe, Japan, and North America | Medium term (2-4 years) |
| Geopolitical shocks are causing fertilizer price spikes | -1.2% | Global, with a severe impact on import-dependent regions | Short term (≤ 2 years) |
| Source: Mordor Intelligence | |||
Intensifying labor shortages in harvesting and post-harvest handling
North American and European growers saw harvesting capacity fall 12-15% in 2024 as tightening immigration rules, aging rural populations, and pandemic-accelerated worker attrition converged. Georgia’s fruit farms left 30% of peaches unpicked, equating to USD 150 million in lost value, while Canada’s Seasonal Agricultural Worker Program delivered 25% fewer workers than requested. Mechanical harvesters mitigate shortages for robust crops yet remain unsuitable for delicate berries and leafy greens, forcing producers to scale back acreage or risk quality degradation. Post-harvest packing houses ran at utilization, amplifying downstream bottlenecks, shrinking supply, and tempering growth prospects for the fruits and vegetables market.
Soil salinity escalation in coastal farmlands
Rising sea levels and saltwater intrusion are degrading agricultural soils in coastal farming regions that produce significant portions of the global fresh produce supply. Research indicates that 20% of coastal farmlands globally now experience soil salinity levels that reduce crop yields compared to optimal growing conditions. California’s Central Valley has already lost 180,000 acres of productive land, jeopardizing its 40% share of the United States' fruits and vegetables output. Mediterranean growers in Spain and Italy now funnel USD 2.2 billion annually into drainage, gypsum application, and salt-tolerant seed research to safeguard harvests, yet remediation offers only incremental relief and remains cost-prohibitive for smallholders.
*Our forecasts treat driver/restraint impacts as directional, not additive. The impact forecasts reflect baseline growth, mix effects, and variable interactions.
Segment Analysis
By Crop Type: Vegetables Drive Growth Despite Fruit Market Leadership
Fruits retained a dominant 55.18% share of the fruits and vegetables market in 2025, due to premium exotics such as dragon fruit, sweet cherries, and imported berries that command higher unit prices. Vegetables, however, are projected to log a 7.46% CAGR over 2026-2031, outpacing overall category expansion as plant-based diets gain mainstream acceptance, especially among younger demographics and institutional food service operators seeking healthier menu rotations. Retail promotions and on-pack recipe ideas have further stimulated household penetration for pre-washed salad kits and snack-ready carrot sticks.
Innovations in post-harvest treatment underpin the surge. Apeel Sciences’ RipeTrack platform balances ethylene levels in transit, lowering spoilage by 30-40% and safeguarding shipment quality across long distances. Automated washing, cutting, and packaging lines now scale efficiently, channeling more supply into value-added ready-to-eat SKUs that carry 25-40% margins compared with bulk produce. Controlled-environment facilities continue to dominate leafy-green output, enabling pesticide-free claims that resonate with health-conscious shoppers and reinforcing vegetables’ contribution to the fruits and vegetables market size at the segment level.



Geography Analysis
Asia-Pacific commanded 42.25% of the fruits and vegetables market size in 2025 due largely to China’s domestic trade ecosystem and tariff-free intra-regional corridors that cut cross-border transaction costs. Government-backed cold-chain investments exceeding USD 50 billion each year have dampened spoilage rates and mobilized premium product flows across borders. Japan’s stringent 2024 residue limits initially disrupted supply chains but ultimately raised quality benchmarks, enabling compliant exporters to capture higher-margin niches in the fruits and vegetables market.
Africa, though smaller in absolute value, is expanding at a 6.11% CAGR through 2031, the fastest worldwide. Kenya’s avocado exports climbed in 2024, powered by new cargo agreements that slash door-to-door lead times to Europe. Nigeria’s mango growers, bolstered by Chinese-funded processing plants, now supply dried-fruit snacks to Middle Eastern chains, evidencing the value-addition’s role in regional economic diversification. South Africa’s citrus cluster continues to leverage advanced electronic phytosanitary certification that speeds customs clearance, cementing its gateway status for Southern African exporters.
North America and Europe demonstrate mature market characteristics with steady growth driven by premium product segments and sustainability initiatives. Europe’s retailer-led zero-plastic initiatives have catalyzed packaging redesign and encouraged adoption of sturdier cultivars, sustaining mid-single-digit volume growth despite demographic stagnation. Progressive carbon-border adjustment discussions in Brussels could eventually provide competitive advantage to low-carbon CEA producers, reshaping supply chains inside the fruits and vegetables market.

Regulatory Landscape
In Oman, fruits and vegetables sit under the oversight of the Ministry of Agriculture, Fisheries and Water Resources (MAFWR), with enforcement and supply-chain controls supported through the Food Safety and Quality Centre (FSQC). Imports of fresh produce generally require a phytosanitary certificate, and many items also need supporting pesticide residue analysis aligned with recognized maximum residue limits (MRLs) such as Codex or EU benchmarks. This approach increases the compliance burden for exporters targeting Omani retail and food service channels.
Border clearance and permitting are operationally handled through the Bayan electronic clearance system, which integrates approvals from controlling agencies and can affect lead times for perishables. Oman also applies the GCC Common External Tariff framework, under which many fruits and vegetables face a 5% duty rate (with exemptions or lower rates for selected basic foodstuffs). In April 2026, FSQC-linked implementation of new import rules introduced a tighter focus on official accreditation of supplying facilities, reinforcing facility-level assurance as a condition for market access.
Value Chain Analysis
Oman's fruits and vegetables value chain runs from input supply (seeds, protected cultivation materials, irrigation and fertigation) to on-farm production (open-field farms and greenhouse/controlled-environment systems), followed by aggregation, wholesale trading, and downstream retail and food service distribution. Public-sector coordination is led by MAFWR, while investment and off-take structures involve Oman Food Investment Holding Company (Nitaj) and subsidiaries such as Nakheel Oman Development, alongside private processors and traders. Contract farming is increasingly used to connect growers with organized buyers and stabilize volumes.
Post-harvest handling and distribution rely on national logistics nodes, including the Khazaen Fruit and Vegetable Central Market (Silal) and regional hubs such as Nizwa, with additional agro-logistics capacity under development in areas such as Najd (Saih al Khairat). Bottlenecks persist around transport costs, gaps in refrigerated storage, and seasonality-driven demand swings, which can raise shrink and price volatility for perishables. Successive national plans have also emphasized project-led capacity buildout and more data-driven governance, including standardizing farm-level data collection, to improve visibility from farm output to wholesale market flows.
Market Opportunities and Future Outlook
Investment-led food security programs are creating near-term headroom across protected cultivation, post-harvest infrastructure, and organized market access for fruits and vegetables in Oman. In April 2026, MAFWR announced a target of 400 food security projects under the Eleventh Five-Year Plan (2026-2030), framed around OMR 400 million (about USD 1 billion) in total investments. This supports opportunities for greenhouse and water-efficient production systems, packhouse upgrades, and integrated logistics capacity that reduces spoilage and helps stabilize supply.
Designated development platforms also broaden the addressable market for advanced horticulture and value-added handling. In June 2026, Oman broke ground on a USD 4.2 billion agricultural city near Saham to integrate hydroponics and aeroponics alongside broader agri-food activities, and master-plan disclosures for Al Najd Agricultural City in Dhofar introduced a zero-waste, clustered approach linking farms with processing. At the governorate and project level, initiatives such as the July 2026 Buraimi fruit cultivation project (figs, lemons, mangoes) point to a pipeline of investable horticulture sites. Meanwhile, reported high vegetable self-sufficiency (around 79%) indicates a shift in opportunity from basic output toward yield consistency, quality compliance, cold-chain coverage, and distribution efficiency into modern trade and food service.
Recent Industry Developments
- July 2026: Al Dhahirah Governorate reported 67 active food security projects totaling around RO 84 million in investments, alongside additional projects launched via the Tatweer platform during 2026. The update signals accelerating regional clustering of agriculture investments around logistics and organized market access, which supports more consistent supply for fresh produce channels.
- April 2026: Oman authorities advanced 11th-plan food security execution by launching investment/tender pathways for a new set of projects, and signed 18 usufruct contracts covering about 300 acres across multiple governorates for agricultural activities including vegetable and fruit farming. The move expands the pipeline of investable farm sites and increases demand for greenhouse inputs, agronomy services, and post-harvest handling capacity tied to newly contracted acreage.
- August 2024: F&S Fresh Foods purchased Calavo Growers' fresh-cut business for USD 180 million, strengthening value-added processing capacity and distribution reach into food service channels. The deal underscores the role of fresh-cut and ready-to-eat formats in capturing higher margins and tightening integration between sourcing, processing, and downstream distribution.


Research Methodology Framework and Report Scope
Market Definition and Coverage
For this methodology, the fruits and vegetables market is counted as the value of fruits and vegetables traded and consumed as food across major producing and consuming countries, tracked in both value (USD) and volume terms using standard crop groupings.
Scope exclusions: We do not count non-food uses (such as cosmetics inputs), and we avoid double counting by not adding the value of processed foods on top of the underlying crop value.
Segmentation Overview
- By Crop Type
- Fruits
- Vegetables
- By Geography
- North America
- United States
- Canada
- Mexico
- South America
- Brazil
- Argentina
- Colombia
- Europe
- Germany
- France
- Netherlands
- Russia
- Asia-Pacific
- China
- India
- Japan
- Indonesia
- Australia
- Philippines
- Middle East
- Saudi Arabia
- United Arab Emirates
- Africa
- Nigeria
- Kenya
- South Africa
- North America
Data Sources, Market Sizing, and Validation
Desk Research
Desk research was used to set the market boundary and to build consistent reference series that can be compared year to year. We relied on public agriculture and trade statistics such as FAOSTAT, USDA datasets, UN Comtrade, World Bank macro indicators, and national agriculture ministries and statistical offices for production, yield, harvested area, and trade flows.
To translate volume signals into value and to check directionality, we also reviewed price and crop outlook commentary from sources such as OECD-FAO outlook publications, selected customs and port updates, company filings and investor presentations from major growers, traders, and retailers, and reputable press coverage on weather disruptions and logistics constraints. In a few cases, a paid subscription was used for company financials and a shipment-level trade database was referenced to sanity check large importer and exporter patterns. These desk sources are illustrative and not exhaustive, and many additional public references were used for collection, validation, and clarification.
Primary Interviews and Surveys
Our fieldwork in Oman uses expert interviews and surveys with growers, importers, wholesalers, retailers, foodservice buyers, and logistics specialists. Respondents help test secondary data, fill gaps in crop volumes, prices, seasonality, and channel margins, and resolve conflicting assumptions before final analysis.
Distribution of primary research fieldwork respondents
| Company type | Respondent position |
|---|---|
| Top tier: 30% | CXOs: 18% |
| Mid tier: 45% | Functional/Unit leaders: 30% |
| Smaller Players: 25% | Managers: 52% |
Market-Sizing & Forecasting
Sizing starts with a top-down reconstruction where production volumes, trade balances, and apparent consumption are aligned at region level, and then value is derived using representative price series matched to the same crop groups and time window. Once that backbone is in place, we corroborate totals using selective bottom-up approximations, such as sampling export baskets for key corridors, using channel checks on wholesale-to-retail spreads, and applying observed price points to realistic volumes for priority crops.
A few inputs that matter a lot in this market were treated explicitly, including harvested area and yield shifts, weather-driven supply tightness, import dependence for out-of-season demand, cold chain availability that changes loss rates, and regional price dispersion between farmgate and wholesale markets. For forecasting, scenario analysis was used so supply shocks and price normalization could be handled without forcing a single smooth curve, and then the scenarios were reviewed with primary experts to select a realistic base case. When bottom-up checks were missing for smaller corridors, we filled gaps using proxy relationships from similar trade lanes and then revalidated them against total import and export values so the sum stayed consistent.
Data Validation & Update Cycle
Validation is done in layers so a single data series does not drive the answer. Model outputs are checked against independent signals like global trade totals, major crop output movements, and price trend direction, and then any large variances are traced back to the exact assumption that created them.
Before sign-off, a second analyst reviews the logic, the unit consistency, and the year-over-year movements for outliers, and follow-up calls are triggered if a key input sits outside what market participants consider normal. The report is refreshed annually, and if a material event occurs (for example, a major weather disruption or a trade restriction), we update the relevant assumptions and rerun the sizing so clients receive a current view at the time of delivery.
Mordor Intelligence's Fruits and Vegetables Industry Market Size Compared Against Other Published Estimates
Published market sizes for fruits and vegetables often differ because the boundary is not consistent across publishers, and because price and volume are blended differently. Discrepancies also come from whether the estimate is closer to farmgate value, wholesale traded value, or a retail value proxy, which can change the headline number even when physical volumes are similar.
By tracking production-to-trade reconciliation first and then refreshing price benchmarks at the same crop-group level, Mordor Intelligence keeps the estimate tied to observable supply and demand signals rather than combining downstream retail markups. Scope decisions also drive variance, where some estimates lean heavily toward fresh-only coverage while others fold in broader processed forms, and currency timing and base-year inflation treatment can widen the gap if not handled consistently.
Benchmark comparison
| Source | Market Size | Gaps in Research Methodology |
|---|---|---|
| Mordor Intelligence | USD 712.01 B (2025) | |
| Global Consultancy A | USD 887.54 B (2025) | This estimate is built around fresh fruits and vegetables and tends to reflect a broader end-use lens that can lean closer to retail-oriented value capture, which lifts the headline versus a traded and consumed crop value view. |
| Industry Publisher B | USD 784.80 B (2025) | This estimate appears to include a wider set of forms (fresh plus select frozen, canned, dried, and juices), which raises the total, and the longer forecast horizon can also bring different base-year price normalization choices. |
The spread in the table mainly comes down to what is counted as value, and how far downstream the pricing reference point sits. When the same crop and trade signals are used, the remaining differences usually trace back to fresh-only versus broader forms, and whether retail value proxies are implicitly included.


Key Questions Answered in the Report
What is the current valuation of the global fruits and vegetables market?
The fruits and vegetables market size reached USD 751.38 billion in 2026.
How fast is the market expected to grow over the next five years?
It is projected to register a 5.53% CAGR and reach USD 983.15 billion by 2031.
Which crop segment shows the strongest growth momentum?
Vegetables are forecast to expand at 7.46% CAGR between 2026 and 2031, outpacing fruits.
Why is Asia-Pacific the leading regional market?
Asia-Pacific benefits from integrated cold-chain investments and reduced cross-border trade barriers, giving it a 42.25% share in 2025.
What are the main challenges facing producers today?
Persistent labor shortages, rising soil salinity, stricter residue limits, and fertilizer price volatility are key headwinds.
How are companies leveraging technology to gain advantage?
Leading players deploy CEA, blockchain traceability, AI-driven quality assessment, and vertical integration to cut waste, assure provenance, and secure margins.
Page last updated on:





