Reciprocating Compressors Market Size and Share
Market Overview
| Study Period | 2020 - 2031 |
|---|---|
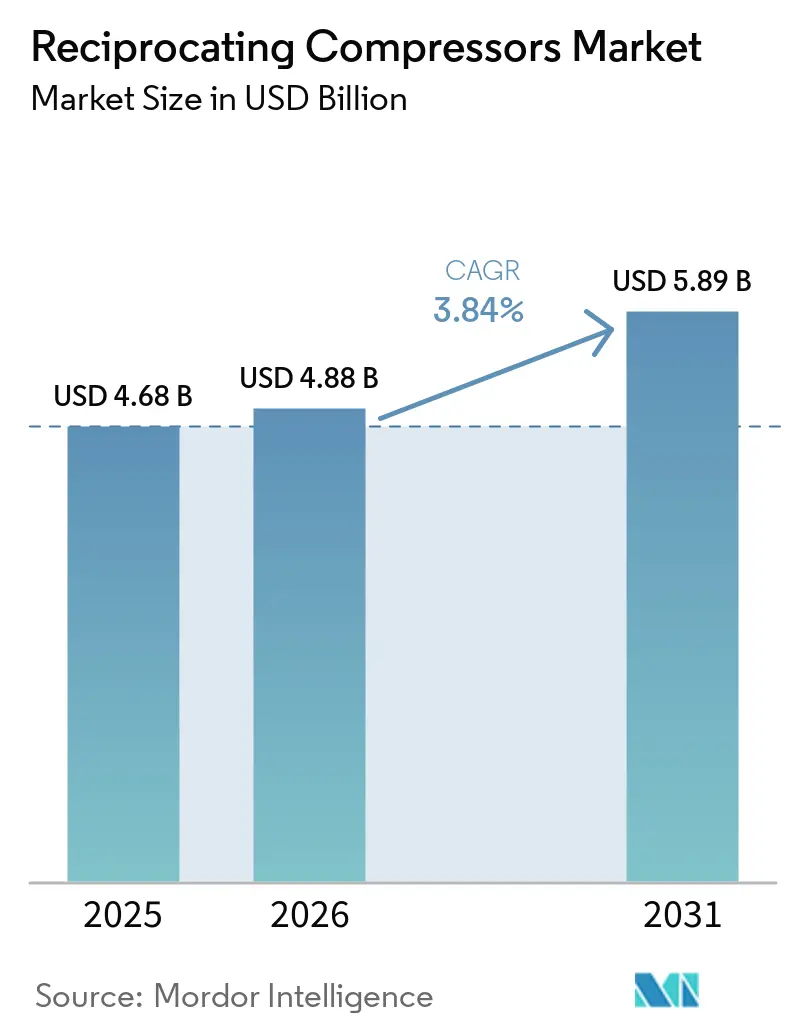
| Market Size (2026) | USD 4.88 Billion |
| Market Size (2031) | USD 5.89 Billion |
| Growth Rate (2026 - 2031) | 3.84% CAGR |
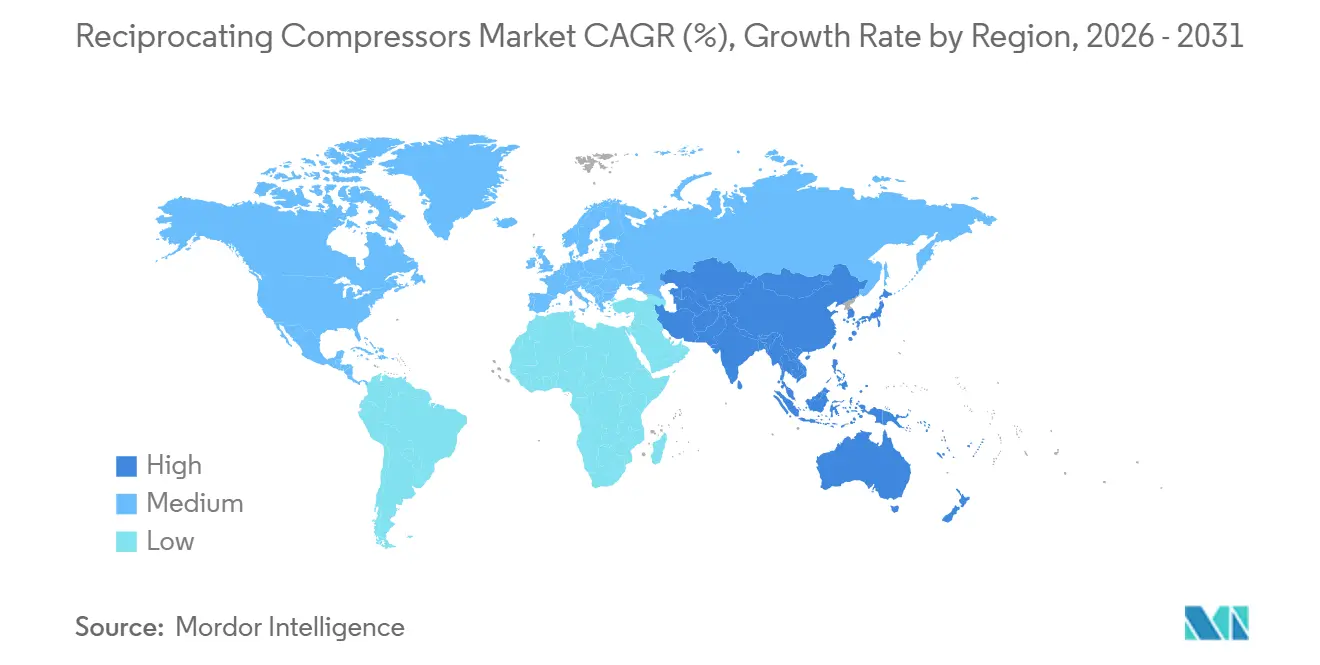
| Fastest Growing Market | Asia Pacific |
| Largest Market | Middle East |
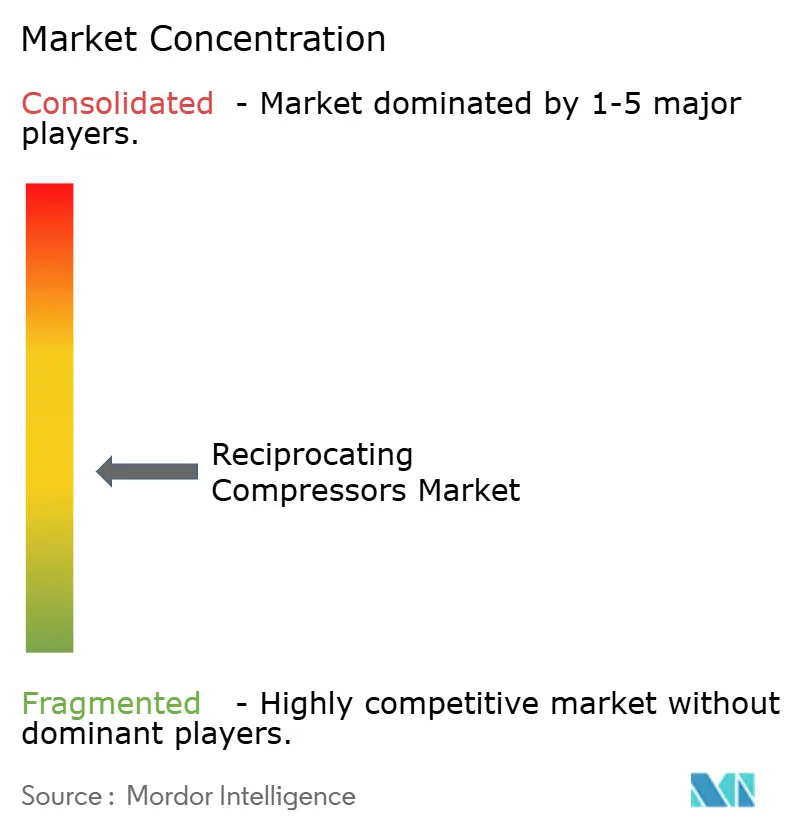
| Market Concentration | Medium |
Major Players *Disclaimer: Major Players sorted in no particular order Image © Mordor Intelligence. Reuse requires attribution under CC BY 4.0. | |
Reciprocating Compressors Market Analysis by Mordor Intelligence
The reciprocating compressors market size is projected to expand from USD 4.68 billion in 2025 and USD 4.88 billion in 2026 to USD 5.89 billion by 2031, registering a 3.84% CAGR between 2026 to 2031. Behind the steady headline numbers, owners are turning away from legacy gas-engine packages toward hybrid electric-motor configurations that wipe out on-site nitrogen-oxide emissions. Tight delivery slots Kodiak Gas Services reports lead times well above 100 weeks tilt new orders toward suppliers that hold modular skid inventory and predictive-maintenance platforms. Asia-Pacific holds the revenue lead on the back of Indian LNG terminals and Chinese petrochemical debottlenecking, while the Middle East is accelerating on blue-hydrogen and ammonia export projects that specify oil-free API 618 machines. Balanced-opposed frames stay dominant in gas gathering, yet diaphragm designs are scaling fastest thanks to hydrogen refuelling and pharmaceutical demand for zero-oil compression.
Key Report Takeaways
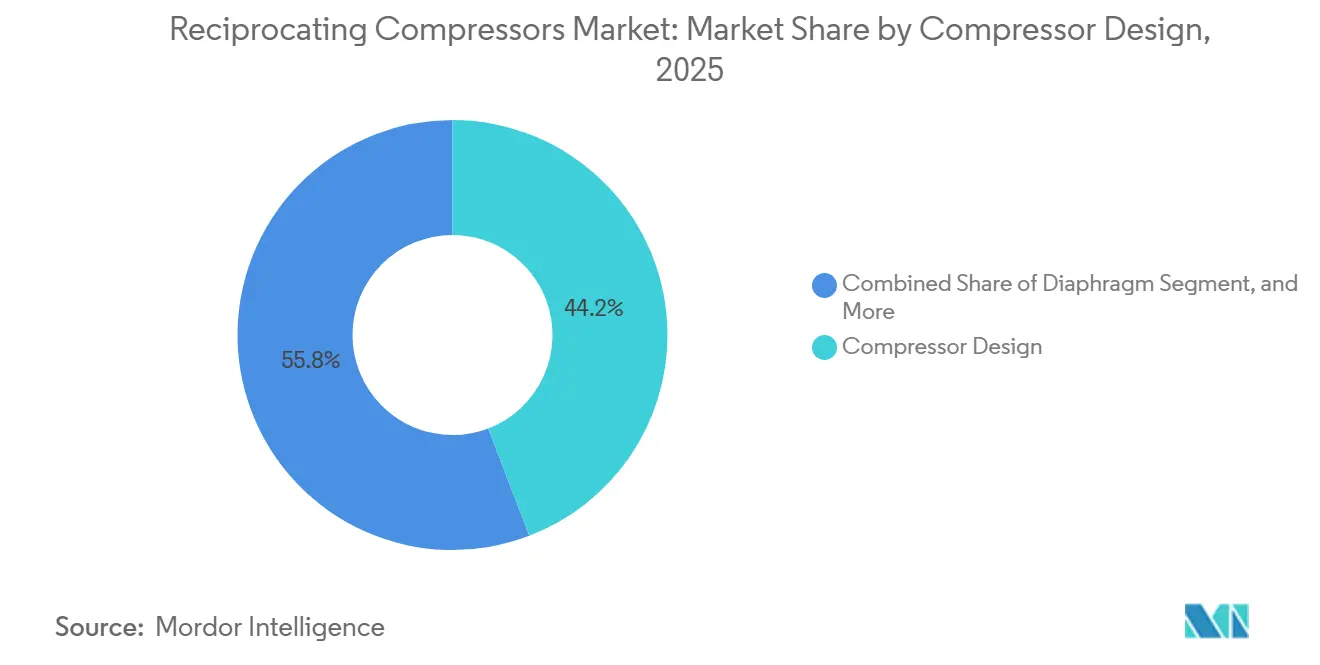
- By compressor design, horizontal balanced-opposed units led with 44.19% of 2025 revenue, whereas diaphragm compressors are set to expand at a 4.58% CAGR through 2031.
- By lubrication, oil-lubricated machines accounted for 63.63% share in 2025, while oil-free variants are advancing at a 4.23% CAGR between 2026 and 2031.
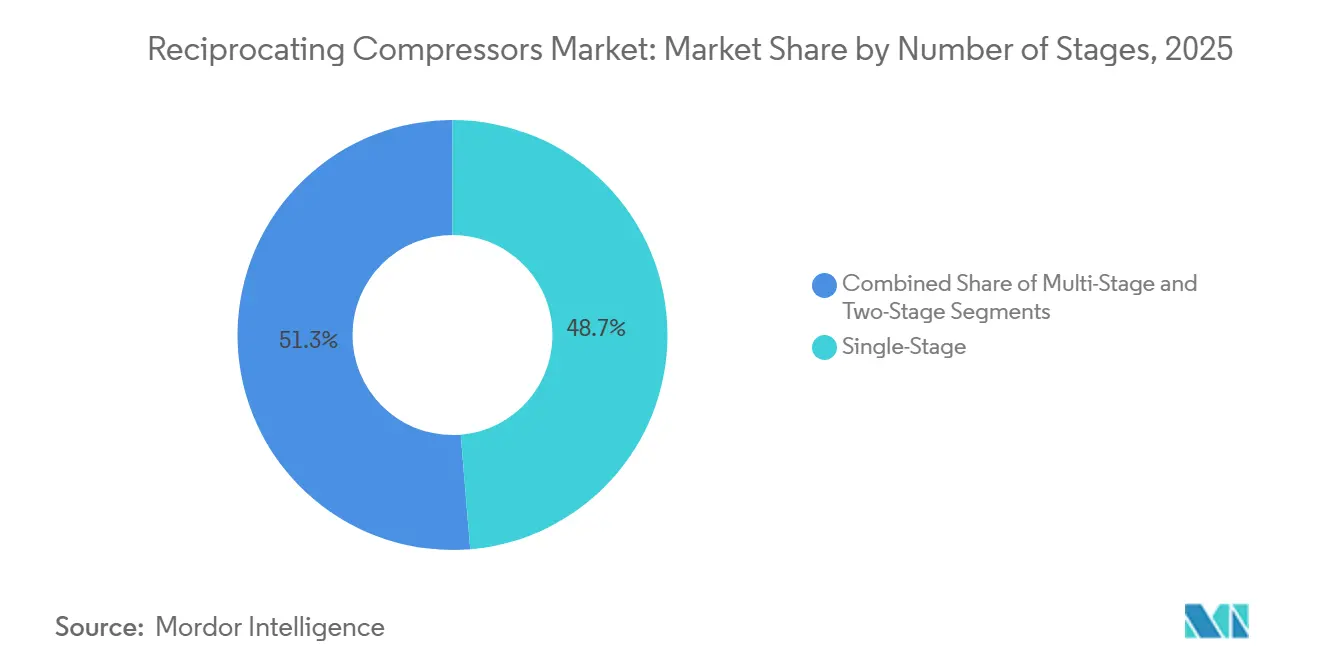
- By number of stages, single-stage models held 48.48% share in 2025; multi-stage units are forecast to grow at a 4.74% CAGR to 2031.
- By end-user industry, oil and gas comprised 41.52% demand in 2025, yet hydrogen refuelling stations are projected to grow at a 4.38% CAGR through 2031.
- By geography, Asia-Pacific captured 42.59% 2025 revenue, while the Middle East is projected to post a 4.44% CAGR through 2031.
Note: Market size and forecast figures in this report are generated using Mordor Intelligence’s proprietary estimation framework, updated with the latest available data and insights as of January 2026.
Global Reciprocating Compressors Market Trends and Insights
Drivers Impact Analysis*
| Driver | (~) % Impact on CAGR Forecast | Geographic Relevance | Impact Timeline |
|---|---|---|---|
| Renewed LNG Liquefaction Train Build-Out (Post-2025 FIDs) | +0.9% | Middle East, Asia-Pacific, North America Gulf Coast | Medium term (2-4 years) |
| Hydrogen Refueling Infrastructure Build-Out | +0.7% | Europe, North America, Japan, South Korea | Medium term (2-4 years) |
| Rise in Shale Gas Re-Fracturing Cycles (North America) | +0.5% | North America (Permian, Haynesville, Eagle Ford basins) | Short term (≤ 2 years) |
| Mandatory Energy-Efficiency Retrofits in Brown-Field Refineries | +0.4% | Global, with concentration in Europe, North America, Asia-Pacific coastal refineries | Long term (≥ 4 years) |
| AI-Enabled Predictive Maintenance Unlocking 3-5 pp Uptime Gains | +0.6% | Global, early adoption in North America and Europe | Short term (≤ 2 years) |
| OEM Shift to Modular Skid-Mounted Packages for Offshore FPSOs | +0.5% | South America (Brazil, Guyana), West Africa, Southeast Asia | Medium term (2-4 years) |
| Source: Mordor Intelligence | |||
Renewed LNG Liquefaction Train Build-Out
Large-frame reciprocating packages are returning to favour for boil-off-gas reliquefaction and refrigerant duty as post-2025 final-investment decisions push new LNG trains forward. The February 2025 Saudi Aramco Jafurah Phase 3 award for six gas-compression trains underscores the commitment to oil-free, high-pressure machines in the Middle East.[1]Baker Hughes, “Baker Hughes to Supply Gas Compression Trains for Jafurah Project,” BakerHughes.com Burckhardt Compression soon followed with Laby 4K165-3 orders for Abu Dhabi’s TA’ZIZ terminal, highlighting oil-free demand in cryogenic service. North Field East in Qatar and Gulf Coast expansions in the United States add a multiyear pipeline of orders exceeding 1,000 horsepower per unit. Owners increasingly specify electric-motor drives to meet greenhouse-gas targets, cutting methane slip inherent in gas-engine primaries. As supply chains strain, vendors that stock critical crankshafts and high-pressure valves secure pricing power.
Hydrogen Refuelling Infrastructure Build-Out
Mandated zero-emission truck corridors in Europe, California, Japan, and South Korea are scaling diaphragm and multi-stage reciprocating technology that can raise hydrogen from 200-500 bar storage to 350-700 bar dispensing. Siemens Energy’s January 2026 contract for Hamburg’s Green Hydrogen Hub typifies projects that need leak-tight, oil-free compression.[2]Siemens Energy, “Hamburg Green Hydrogen Hub Compressor Contract,” Siemens-Energy.com Hoerbiger’s HCP 500 diaphragm model extends service intervals to 8,000 hours by eliminating elastomer failure.[3]Hoerbiger, “HCP 500 High-Pressure Diaphragm Compressor,” Hoerbiger.com Ariel has already shipped more than 150 hydrogen units up to 6,000 psig for refuelling and pipeline injection.[4]Ariel Corporation, “Hydrogen Compressors Portfolio,” ArielCorp.com Because centrifugal and screw machines lose efficiency at very high heads, reciprocating frames dominate this niche. The resulting order book is on course to outpace the broader reciprocating compressors market through 2031.
AI-Enabled Predictive Maintenance Unlocking 3-5 Point Uptime Gains
Internet-of-Things sensors now feed vibration, temperature, and pressure data into machine-learning algorithms that warn of impending ring wear or valve failure. Burckhardt Compression’s PROGNOST-NT module, launched in 2025, claims 8-12% lifetime cost reductions. Ariel upgraded its Smart Compressor suite in October 2025 and has 1,600 digitalized units in service. Early adopters report mechanical availability improving from the industry’s 92-94% baseline to nearly 99%, directly boosting midstream cash flow. Vendors monetize the data through subscription portals, creating an annuity stream that cushions cyclical equipment sales. As asset owners see fast payback, predictive packages move from optional to standard specification, reshaping competition inside the reciprocating compressors market.
Rise in Shale Gas Re-Fracturing Cycles
United States operators are re-fracturing wells drilled between 2010 and 2018 to recover bypassed hydrocarbons, pushing incremental demand for trailer-mounted reciprocating units that field-boost low wellhead pressure. Kodiak Gas Services plans to add roughly 150,000 horsepower in 2026, yet crankshaft and rod shortages stretch delivery beyond 100 weeks. At USD 3 per MMBtu gas, ConocoPhillips reports re-fracturing economics rival greenfield wells, suggesting the activity rises to 5-7% of completions by 2027. Mobile balanced-opposed frames that can be redeployed basin-to-basin remain favoured, helping stabilize the United States share of the global reciprocating compressors market.
Restraints Impact Analysis*
| Restraint | (~) % Impact on CAGR Forecast | Geographic Relevance | Impact Timeline |
|---|---|---|---|
| Capex Deferments in Deep-Water Projects Below USD 65 per barrel | -0.6% | Global offshore (Brazil, West Africa, Gulf of Mexico, Southeast Asia) | Short term (≤ 2 years) |
| Shift from Gas Lift to Electric Submersible Pumps in Mature Fields | -0.4% | North America onshore, Middle East mature fields, North Sea | Medium term (2-4 years) |
| Industrial Move Toward Oil-Free Screw Units in Food and Pharma | -0.3% | Global, with concentration in Europe, North America, Japan | Medium term (2-4 years) |
| Stringent Urban Noise Codes Greater Than 75 dB-A Curbing Inner-City Installations | -0.2% | Europe, Japan, urban North America, select Asia-Pacific cities | Long term (≥ 4 years) |
| Source: Mordor Intelligence | |||
Capex Deferments in Deep-Water Projects Below USD 65 per Barrel
When Brent crude slips under USD 65 per barrel, operators freeze deepwater final-investment decisions, postponing compression packages for gas-lift, export, and vapor-recovery service. The International Energy Agency records a historic low in deepwater sanctions during prior downturns, highlighting macro exposure for OEM backlogs. Because floating production, storage, and offloading vessels need two to four years of engineering lead time, price weakness in 2026 would cascade into the late-2020s order funnel. Suppliers with onshore, petrochemical, and hydrogen exposure diversify risk.
Shift from Gas Lift to Electric Submersible Pumps in Mature Fields
Producers in the Permian, North Sea, and Middle East are swapping gas-lift for electric submersible pumps, which erase surface gas-compression spend and raise well output. A Reynolds Lift case shows production jumping from 400 to 3,300 barrels per day when switching, while operating cost pivots from fuel gas to grid power. Reciprocating demand in gas-lift is therefore projected to contract 2-3% annually through 2031, partly offset by growth in hydrogen and LNG niches. OEMs respond with retrofit kits that repurpose gas-lift compressors for vapor recovery or pipeline boosting, protecting installed-base value.
*Our forecasts treat driver/restraint impacts as directional, not additive. The impact forecasts reflect baseline growth, mix effects, and variable interactions.
Segment Analysis
By Compressor Design: Balanced-Opposed Frames Retain Throughput Leadership
Horizontal balanced-opposed machines commanded 44.19% 2025 revenue, evidencing their suitability for gas gathering volumes above 283,000 m³ per day. The reciprocating compressors market share is unlikely to erode quickly because pipeline operators prize the low vibration and simplified foundation these frames deliver. In contrast, diaphragm units, though just a sliver of 2025 totals, are slated for a 4.58% CAGR as hydrogen retail stations proliferate. Hoerbiger’s metal-diaphragm technology, rated 500 bars, removes permeation risks that plague elastomer membranes, expanding acceptance among fuel-cell vehicle corridors. V-type and in-line designs fill compact layouts in machine shops and small process units. Double-acting cylinders, still chosen for ammonia and methanol loops above 3,000 psig, illustrate why no single technology dominates every duty inside the reciprocating compressors market.
Diaphragm expansion is reinforced by stringent purity codes in pharmaceuticals and semiconductors, where ISO 8573-1 Class 0 air is mandatory. Asia-Pacific fabs scheduled for 2027 tape-out favour oil-free metal-diaphragm skids because screw or scroll machines struggle beyond 150 psig. Balanced-opposed OEMs counter with improved pulsation dampers and digital twins that cut commissioning time by 30%. As a result, the reciprocating compressors market size for balanced-opposed frames continues to inch forward even while faster niches steal headlines.


By Lubrication: Oil-Free Adoption Builds Under Purity Pressure
Oil-lubricated variants retained 63.63% volume in 2025, underpinning workshop air, midstream gas gathering, and LNG refrigeration where trace hydrocarbons are tolerated. Yet food, beverage, and electronics plants now budget premium pricing for Class 0 compliance, driving a 4.23% CAGR in oil-free reciprocating compressors. Burckhardt’s labyrinth-piston Laby line avoids cross-contamination during ammonia reliquefication, while ELGi and CompAir promote PTFE ring kits that drop oil carryover below instrument-detectable limits. Because consumer-facing brands face product-recall penalties, the capital premium is justified.
Manufacturers also weigh life-cycle electricity costs. Oil-free stages deliver higher discharge temperatures, so many installations integrate intercooler heat recovery that trims net plant energy intensity. The reciprocating compressors market tracks these efficiency gains as brownfield refinery retrofits coincide with carbon-pricing schemes in Europe and California. Although oil-lubricated units will remain the backbone of upstream and midstream fleets for the forecast window, product roadmaps clearly arc toward dry-sealed technologies.
By Number of Stages: Multi-Stage Packages Seize High-Pressure Niches
Single-stage frames captured 48.48% 2025 share on workshop and light-industrial duty, but multi-stage machines are projected to expand at 4.74% CAGR. LNG, petrochemical, and hydrogen applications call for discharge pressures above 1,000 psig, which multistage configurations meet efficiently via inter-stage cooling. Ariel’s KB-frame allows operators to add cylinders as reservoir head declines, stretching asset life without the need to buy completely new packages. Two-stage designs remain popular in natural-gas vehicle refuelling at city bus depots where 300-800 psig suffices.
Energy-efficiency policy also favours multi-stage adoption because fewer kilowatt-hours are consumed per unit of compressed gas once intercooling is optimized. Consequently, the reciprocating compressors market size for multi-stage equipment is likely to grow faster than the overall market curve through 2031.
By End-User Industry: Hydrogen Refuelling Emerges as the Fastest Grower
Oil and gas contributed 41.52% value in 2025 but faces structural headwinds from electric submersible pump uptake and deepwater capex volatility. By contrast, hydrogen refuelling is forecast as the swiftest end-user, logging a 4.38% CAGR as policy incentives stack up across the European Union and California. Ariel’s shipment of more than 150 hydrogen compressors to date illustrates technology readiness for 6,000 psig service. Chemical and petrochemical plants maintain a stable call on double-acting frames for ammonia, methanol, and ethylene loops.
Power generation, manufacturing, and HVAC collectively fill the rest of demand, with scroll and small-bore reciprocating sets powering district-cooling schemes and factory pneumatics. The reciprocating compressors market continues to rebalance from fossil-centric to diversified low-carbon applications.
Geography Analysis
Asia-Pacific commanded 42.59% 2025 revenue on LNG terminal builds in India and Chinese coastal refinery upgrades. The region’s governments add efficiency mandates India’s Bureau of Energy Efficiency tightens compressor standards in 2026 that spur replacement of sub-standard units. Vietnam and Indonesia industrial growth drives workshop air sales, reinforcing baseline demand. The reciprocating compressors market size in Asia-Pacific remains buoyant as domestic OEMs localize production to skirt import duties.
North America held roughly 28% share, underpinned by shale gas re-fracturing and associated gas gathering. Supply-chain pinch points in crankshafts and valves elevate equipment lease rates, advantaging incumbents that carry inventory. The United States also pilot’s hydrogen corridors from Texas to California, placing early orders for 700 bar diaphragm skids. Canada’s LNG Canada Phase 2 and Woodfibre LNG add future upside.
Europe generated about 18% revenue in 2025 but contends with stringent noise rules under EU Directive 2000/14/EC that cap sound power and force low-speed designs. Retrofitting acoustic wraps and variable-speed drives helps legacy units stay compliant but raises unit cost. Meanwhile, the Middle East, forecast at a 4.44% CAGR, accelerates with Jafurah, TA’ZIZ, and Qatar’s North Field East projects that bundle oil-free reciprocating compressors into blue-ammonia and hydrogen complexes. South America’s pre-salt developments in Brazil and compression plants linked to Argentina’s Vaca Muerta shale underpin incremental demand, while African growth hinges on deepwater discoveries off Namibia and Mozambique.

Competitive Landscape
The reciprocating compressors market exhibits moderate fragmentation, with Atlas Copco, Ingersoll Rand, Burckhardt Compression, Baker Hughes, and Siemens Energy jointly holding 35-40%. Atlas Copco is on an acquisition streak, taking Cypress Equipment Rental in March 2026, Air Compressor Works and Centroar in January 2026, bolstering rental reach across the Gulf Coast, Florida, and Brazil. Baker Hughes’ planned USD 210 per-share merger with Chart Industries fuses reciprocating compression with cryogenic LNG technology, positioning the combined group for integrated hydrogen and ammonia export terminals. Burckhardt focuses on oil-free and predictive analytics, rolling out PROGNOST-NT to safeguard its installed base.
Digital service portals that monetize uptime gains, API 618 fifth-edition compliance, and ISO 8573-1 Class 0 certifications act as competitive battlegrounds. Start-ups such as Everllence in Brazil carve space by packaging modular skid units for FPSOs, reducing offshore hook-up from six weeks to ten days. Given 35-40% combined share for the top five, tier-two regionals like Shenyang Blower Works Group, Kirloskar Pneumatic, and Mitsui EandS Machinery command localized loyalty but face scaling challenges on R&D. Suppliers that master low-noise, electric-motor-driven hybrids and predictive maintenance stand to widen margins inside the broader reciprocating compressors market.
Reciprocating Compressors Industry Leaders
Atlas Copco AB
Ingersoll Rand Inc.
Burckhardt Compression AG
Baker Hughes Company
Siemens Energy AG
- *Disclaimer: Major Players sorted in no particular order

Recent Industry Developments
- March 2026: Atlas Copco completed the USD 17.6 million purchase of Cypress Equipment Rental, expanding its portable compression fleet in the United States Gulf Coast.
- February 2026: Hitachi Global Air Power introduced the E425H electric portable compressor and OFE1550 oil-free model at ConExpo 2026, responding to higher energy prices and stricter emission rules.
- January 2026: Siemens Energy won a contract to supply compressor systems for Hamburg’s Green Hydrogen Hub, targeting maritime and trucking demand.
- January 2026: Atlas Copco acquired Air Compressor Works in Florida and Centroar in Brazil to deepen service density.


Global Reciprocating Compressors Market Report Scope
The Reciprocating Compressors Market Report is Segmented by Compressor Design (Horizontal Balanced-Opposed, Vertical In-Line, V-Type, Diaphragm, Double-Acting), Lubrication (Oil-Lubricated, Oil-Free), Number of Stages (Single-Stage, Two-Stage, Multi-Stage), End-User Industry (Oil and Gas, Chemicals and Petrochemicals, Power Generation, Manufacturing and Industrial, HVAC and Refrigeration, Others), and Geography (North America, South America, Europe, Asia-Pacific, Middle East and Africa). The Market Forecasts are Provided in Terms of Value (USD).
| Horizontal Balanced-Opposed |
| Vertical In-Line |
| V-Type |
| Diaphragm |
| Double-Acting |
| Oil-Lubricated |
| Oil-Free |
| Single-Stage |
| Two-Stage |
| Multi-Stage |
| Oil and Gas |
| Chemicals and Petrochemicals |
| Power Generation |
| Manufacturing and Industrial |
| HVAC and Refrigeration |
| Others End-User Industry (Healthcare, Food and Beverage) |
| North America | United States | |
| Canada | ||
| Mexico | ||
| South America | Brazil | |
| Argentina | ||
| Rest of South America | ||
| Europe | Germany | |
| France | ||
| United Kingdom | ||
| Italy | ||
| Spain | ||
| Rest of Europe | ||
| Asia-Pacific | China | |
| India | ||
| Japan | ||
| South Korea | ||
| Rest of Asia-Pacific | ||
| Middle East and Africa | Middle East | Saudi Arabia |
| United Arab Emirates | ||
| Rest of Middle East | ||
| Africa | South Africa | |
| Rest of Africa | ||
| By Compressor Design | Horizontal Balanced-Opposed | ||
| Vertical In-Line | |||
| V-Type | |||
| Diaphragm | |||
| Double-Acting | |||
| By Lubrication | Oil-Lubricated | ||
| Oil-Free | |||
| By Number of Stages | Single-Stage | ||
| Two-Stage | |||
| Multi-Stage | |||
| By End-User Industry | Oil and Gas | ||
| Chemicals and Petrochemicals | |||
| Power Generation | |||
| Manufacturing and Industrial | |||
| HVAC and Refrigeration | |||
| Others End-User Industry (Healthcare, Food and Beverage) | |||
| By Geography | North America | United States | |
| Canada | |||
| Mexico | |||
| South America | Brazil | ||
| Argentina | |||
| Rest of South America | |||
| Europe | Germany | ||
| France | |||
| United Kingdom | |||
| Italy | |||
| Spain | |||
| Rest of Europe | |||
| Asia-Pacific | China | ||
| India | |||
| Japan | |||
| South Korea | |||
| Rest of Asia-Pacific | |||
| Middle East and Africa | Middle East | Saudi Arabia | |
| United Arab Emirates | |||
| Rest of Middle East | |||
| Africa | South Africa | ||
| Rest of Africa | |||


Key Questions Answered in the Report
What is the forecast value of the reciprocating compressors market in 2031?
It is projected to reach USD 5.89 billion by 2031.
Which compressor design holds the largest 2025 share?
Horizontal balanced-opposed frames led with 44.19% revenue share in 2025.
Which end-user segment is expected to grow fastest through 2031?
Hydrogen refueling stations are projected to record the highest CAGR at 4.38%.
Why are oil-free reciprocating compressors gaining traction?
Food, pharmaceutical, and electronics plants need ISO 8573-1 Class 0 purity, which oil-free designs provide without downstream filtration.
Which region leads the market today?
Asia-Pacific captured 42.59% of 2025 global revenue.
How are suppliers using digital technology to compete?
OEMs embed predictive-maintenance analytics that raise availability to nearly 99% and create subscription revenue streams.
Page last updated on:


