Commercial Refrigeration Equipment Market Size and Share
Market Overview
| Study Period | 2020 - 2031 |
|---|---|
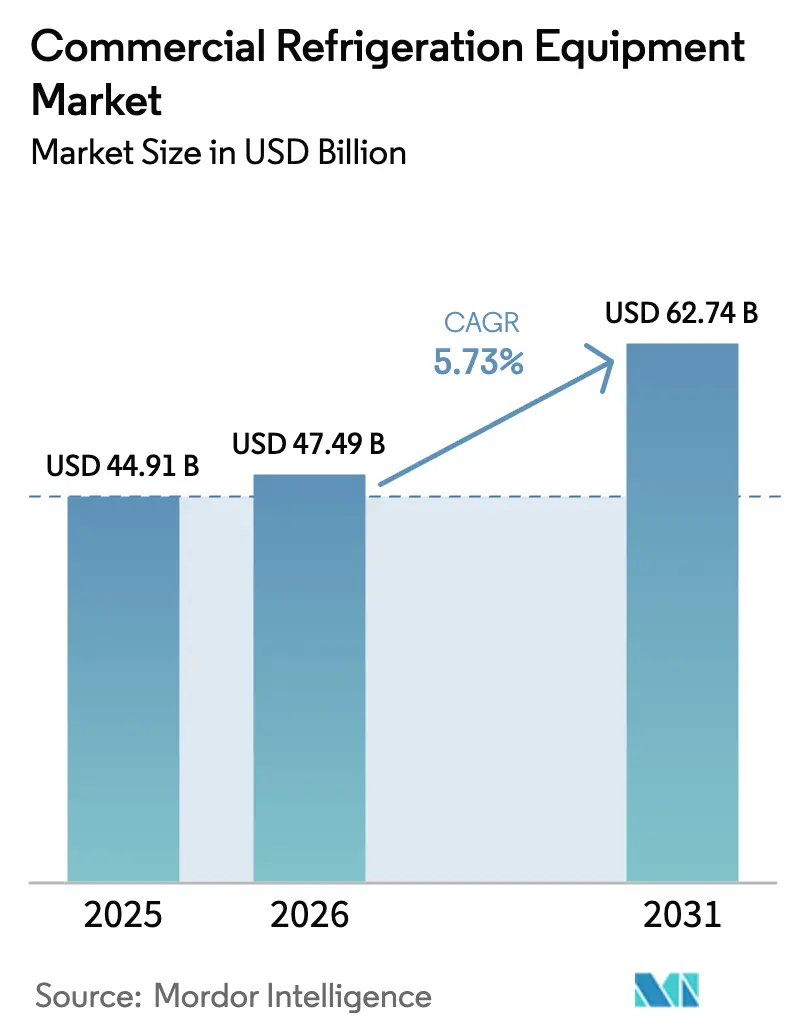
| Market Size (2026) | USD 47.49 Billion |
| Market Size (2031) | USD 62.74 Billion |
| Growth Rate (2026 - 2031) | 5.73% CAGR |
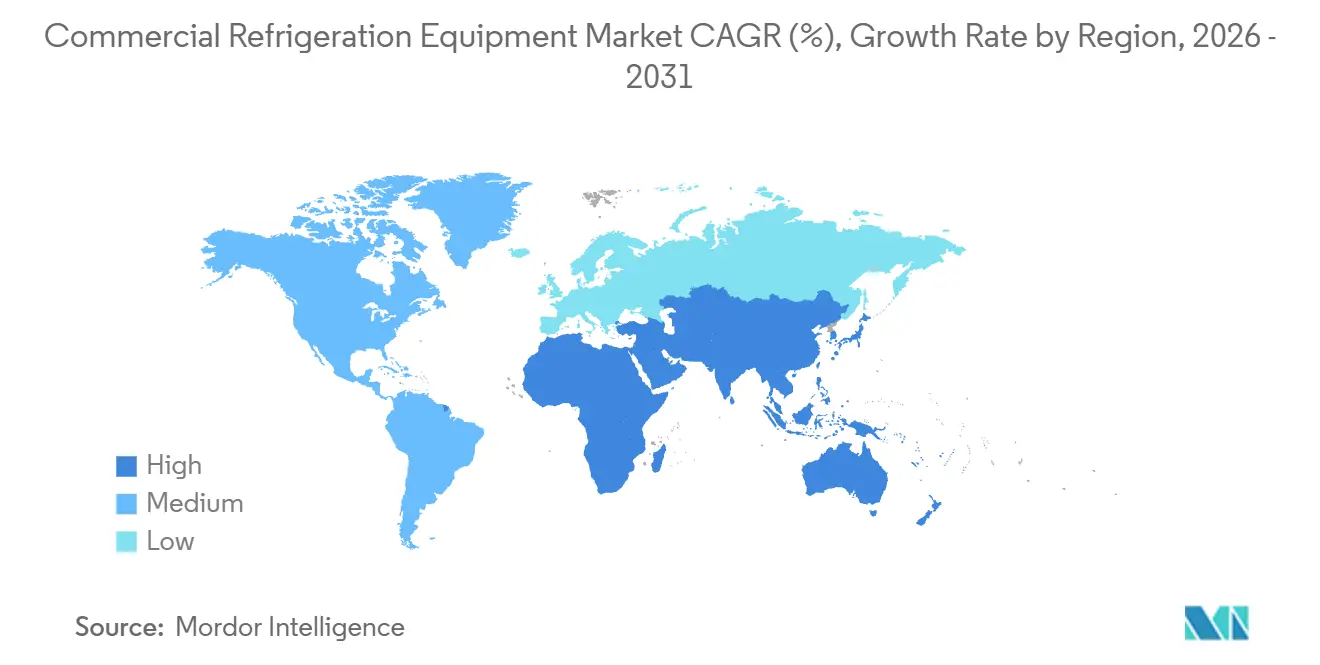
| Fastest Growing Market | Middle East |
| Largest Market | Asia Pacific |
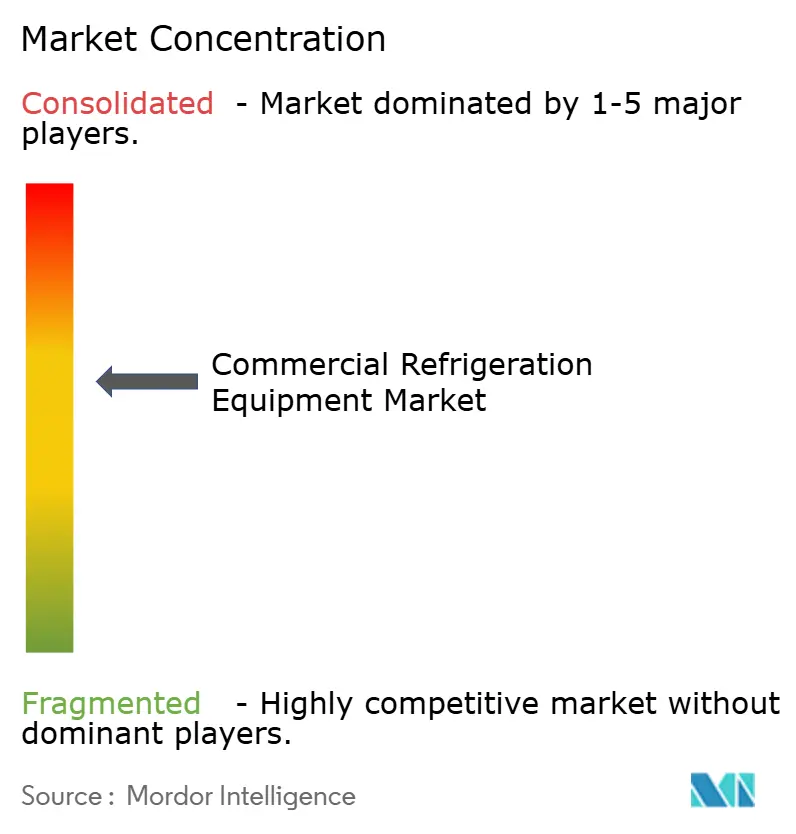
| Market Concentration | Medium |
Major Players *Disclaimer: Major Players sorted in no particular order Image © Mordor Intelligence. Reuse requires attribution under CC BY 4.0. | |
Commercial Refrigeration Equipment Market Analysis by Mordor Intelligence
The Commercial Refrigeration Equipment Market size is expected to grow from USD 44.91 billion in 2025 to USD 47.49 billion in 2026 and is forecast to reach USD 62.74 billion by 2031 at 5.73% CAGR over 2026-2031. This trajectory is propelled by stricter hydrofluorocarbon (HFC) phase-down schedules, rapid supermarket penetration in emerging economies, and the rollout of IoT diagnostics that curb downtime costs. Europe’s revised F-Gas Regulation 2024/573 is accelerating the shift toward carbon dioxide and hydrocarbon systems, while the United States Technology Transitions rule reduced HFC allocations by 40% between 2024 and 2025, inflating refrigerant prices and nudging buyers toward low global warming potential (GWP) substitutes. Organized food retail chains in China, India, and Southeast Asia are commissioning walk-in coolers, multi-deck display cases, and centralized racks that meet cold-chain standards. At the same time, California’s Title 24 mandate for doors on open cases is prompting large-scale retrofits across North America. Manufacturers are therefore redesigning product lines around natural refrigerants, modular architectures, and embedded telemetry to comply with both climate and energy rules and to win service contracts that deliver predictive maintenance benefits.
Key Report Takeaways
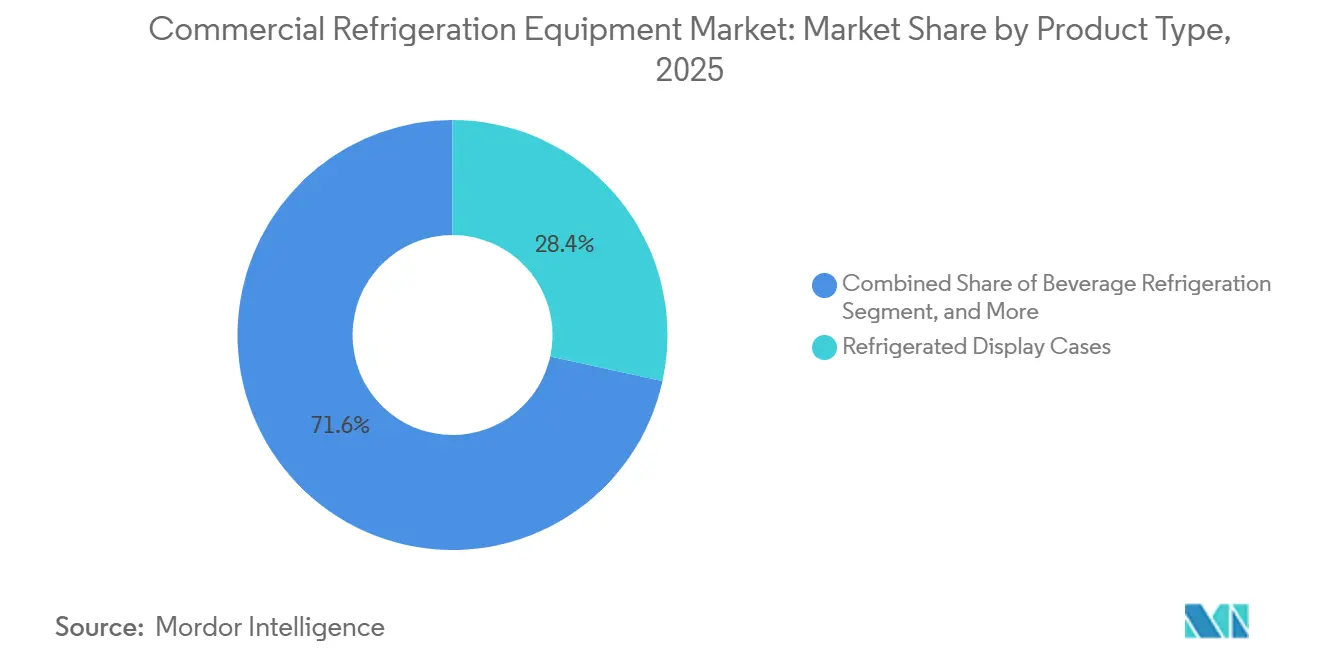
- By product type, refrigerated display cases led with 28.43% revenue share in 2025, while refrigerated vending machines posted the fastest 6.43% CAGR through 2031.
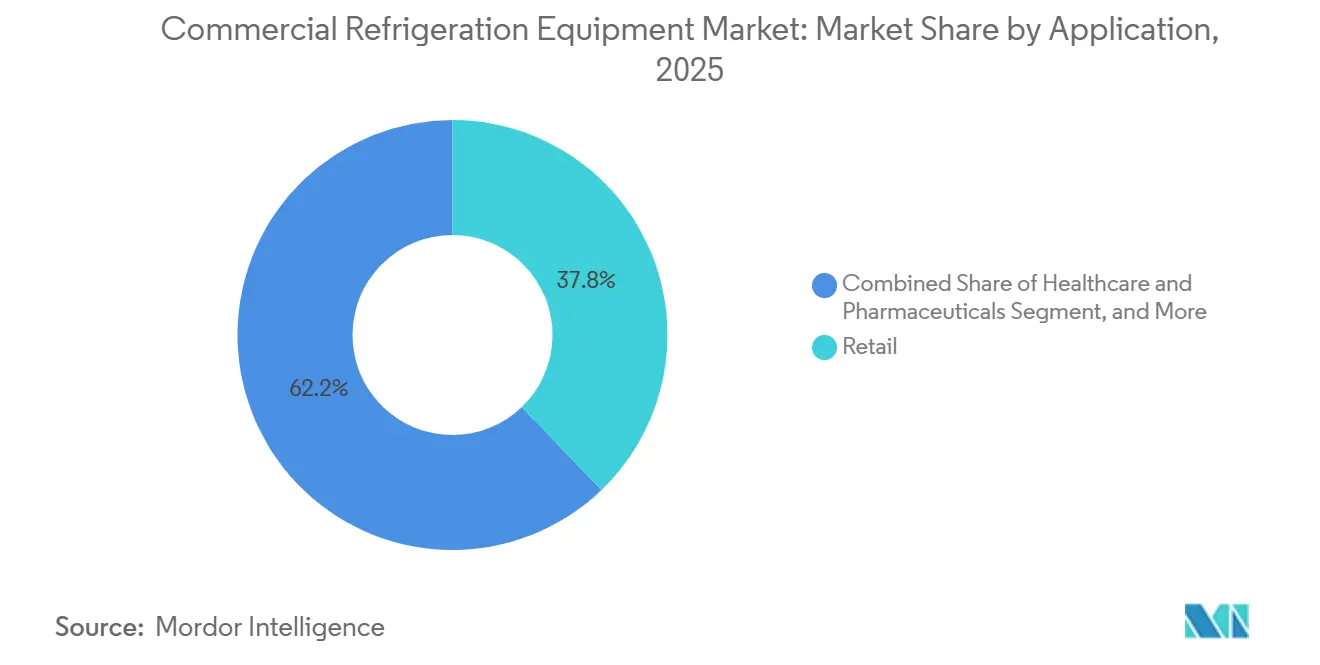
- By application, retail held 37.82% of the commercial refrigeration equipment market share in 2025, whereas healthcare and pharmaceuticals advanced at an 8.32% CAGR to 2031.
- By refrigerant type, fluorocarbons retained a 46.28% share in 2025, but inorganics recorded the strongest 7.86% CAGR over the outlook period.
- By system configuration, plug-in units commanded a 41.53% share in 2025, yet multiplex rack systems rose at a 7.18% CAGR to 2031.
- By geography, Asia Pacific accounted for 34.81% of global revenue in 2025, and the Middle East registered the highest regional CAGR at 8.07% through 2031.
Note: Market size and forecast figures in this report are generated using Mordor Intelligence’s proprietary estimation framework, updated with the latest available data and insights as of January 2026.
Global Commercial Refrigeration Equipment Market Trends and Insights
Drivers Impact Analysis*
| Driver | (~) % Impact on CAGR Forecast | Geographic Relevance | Impact Timeline |
|---|---|---|---|
| Expansion of Organized Food Retail | +1.2% | Asia Pacific core, spillover to Middle East and Africa | Medium term (2-4 years) |
| Energy-Efficiency Regulations and Incentives | +1.0% | Global, with early enforcement in North America and EU | Short term (≤ 2 years) |
| Shift Toward Natural Refrigerants (HC/CO₂) | +0.9% | EU and North America lead, Asia Pacific adoption accelerating | Medium term (2-4 years) |
| IoT-Enabled Predictive Maintenance Adoption | +0.7% | North America and EU, pilot deployments in Asia Pacific | Long term (≥ 4 years) |
| Mandatory Retrofit of Open Display Cases | +0.6% | North America, selective EU mandates | Short term (≤ 2 years) |
| Rise of Micro-Fulfillment Dark Stores | +0.5% | North America and EU urban centers, emerging Asia Pacific metros | Medium term (2-4 years) |
| Source: Mordor Intelligence | |||
Expansion of Organized Food Retail
Modern trade penetration is reshaping chilled distribution across emerging economies. India’s organized grocery share climbed to 12% in 2024 and is forecast to reach 18-20% by 2030, a shift that compels retailers to deploy walk-in coolers, multi-deck cases, and centralized racks that limit spoilage and align with food-safety codes. The United Arab Emirates grocery sector expanded at 6.5% CAGR between 2020 and 2024 on the back of food-security policies, boosting demand for cold storage.[1]United Arab Emirates Government, “Official Portal,” u.ae Blue Star aims to lift its domestic share to 33-35% by 2028 after committing INR 400 crore (USD 48 million) to freezer capacity, signaling supplier confidence in sustained retail build-out. Across Southeast Asia, convenience-store chains retrofit outlets with plug-in merchandisers to stock chilled beverages and ready-to-eat meals, while the migration from wet markets to air-conditioned supermarkets lifts demand for blast chillers and ice-cream freezers. New square footage translates directly into unit placements, spurring steady volume gains for equipment vendors.
Energy-Efficiency Regulations and Incentives
Efficiency mandates are accelerating hardware upgrades. California’s Title 24 requires doors or night covers on new display cases from January 2025, trimming energy draw by 30-40% and shrinking grocery operating costs. Europe’s Ecodesign Regulation 2019/2024 enforces minimum performance thresholds that push manufacturers toward electronic expansion valves, LED lighting, and heat-recovery loops. Updated United States Department of Energy rules published in 2024 raise the bar for walk-in coolers and freezers by 15% from 2027 onward. Utility rebates across North America offset capital outlays, with incentives up to USD 500 per ENERGY STAR-listed unit. Because electricity can represent 20-30% of a supermarket’s overhead, these policies materially influence purchasing timelines and tilt preferences toward high-efficiency, low-GWP platforms.
Shift Toward Natural Refrigerants (HC/CO₂)
Natural refrigerants are capturing share as HFC quotas tighten. Europe’s F-Gas Regulation 2024/573 slashes HFC allowances by 95% by 2030 versus a 2015 base, driving widespread adoption of carbon dioxide transcritical racks and hydrocarbon plug-ins. In North America, tighter allowances under the American Innovation and Manufacturing Act lifted HFC prices 25-35% during 2025, narrowing the payback gap for natural options. AHT Cooling Systems broadened its remote CO₂ line in April 2025, while Panasonic’s RE Series introduced in September 2024 uses propane to cut energy use 20% compared with legacy models. Safety standards cap hydrocarbon charge to 150 grams per circuit, but new micro-channel heat exchangers and low-charge designs are extending system capacities. As retailers prioritize lifecycle compliance and corporate decarbonization goals, natural-refrigerant equipment has moved from niche to mainstream specification.
IoT-Enabled Predictive Maintenance Adoption
Digital diagnostics limit unplanned downtime and cut service visits. Hussmann’s Refrigeration Parts Plus marketplace, launched in August 2024, links on-board sensors to spare-parts procurement so technicians can pre-order components before a failure occurs. The firm’s follow-on Refrigeration IQ suite, released in March 2025 with Phoenix Energy Technologies, analyzes suction pressures and defrost cycles, reducing truck rolls by 25% and lowering energy usage 10-15% during pilots. Johnson Controls’ OpenBlue platform reported similar outcomes at large c-store chains in 2024. With the U.S. Bureau of Labor Statistics forecasting a 6% technician shortfall through 2034, remote monitoring fills a skills gap while boosting asset uptime. Matched with subscription analytics, OEMs convert one-time sales into recurring revenue streams.
Restraints Impact Analysis*
| Restraint | (~) % Impact on CAGR Forecast | Geographic Relevance | Impact Timeline |
|---|---|---|---|
| High Upfront and Maintenance Costs | -0.8% | Global, acute in price-sensitive emerging markets | Short term (≤ 2 years) |
| Growing Market for Used and Rental Units | -0.5% | North America and Europe, emerging in Asia Pacific | Medium term (2-4 years) |
| Technical Skill-Gap for CO₂/HC Systems | -0.4% | Global, most severe in Asia Pacific and Africa | Long term (≥ 4 years) |
| Refrigerant Quota Caps Creating Bottlenecks | -0.6% | North America and EU, spillover to import-dependent regions | Short term (≤ 2 years) |
| Source: Mordor Intelligence | |||
High Upfront and Maintenance Costs
Natural-refrigerant technology carries a 30-50% price premium versus legacy HFC systems, with a CO₂ rack for a mid-size supermarket ranging from USD 150,000 to USD 250,000.[2]United Nations Environment Programme, “About Montreal Protocol,” unep.org Maintenance adds USD 5,000-10,000 per site annually for specialized tools and technician training. Independent grocers often defer upgrades or purchase refurbished units at 40-60% discounts, prolonging inefficient assets and suppressing new-equipment volumes. Rental fleets serving seasonal peaks or pop-up kitchens have also expanded, reducing outright purchases and tempering growth, particularly in foodservice.
Technical Skill-Gap for CO₂/HC Systems
CO₂ systems operate above 1,000 psi and require dedicated gauges and brazing skills, while hydrocarbon flammability demands spark-proof tools and rigorous leak detection. The U.S. staffing gap is estimated at 30,000-40,000 certified technicians, and fewer than 10% of India’s 100,000 refrigeration workers have natural-refrigerant credentials. Europe’s mandatory certification framework went live in 2024, but capacity remains thin in Eastern and Southern regions, delaying installs and raising service fees. OEM-led academies are ramping, yet the pipeline is unlikely to meet medium-term demand, constraining adoption in certain geographies.
*Our forecasts treat driver/restraint impacts as directional, not additive. The impact forecasts reflect baseline growth, mix effects, and variable interactions.
Segment Analysis
By Product Type: Vending Machines Outpace Traditional Formats
Refrigerated display cases held 28.43% of 2025 revenue, showcasing staples such as dairy, produce, and ready-to-eat meals in supermarkets, c-stores, and quick-service restaurants. In contrast, smart vending machines armed with cashless payment modules, computer-vision inventory tracking, and cellular telemetry are scaling at a 6.43% CAGR through 2031, the fastest among all product classes. This surge reflects contact-free retail preferences in hospitals, universities, and transit hubs, where 24-hour access and labor savings outweigh capital costs. Carrier’s Vector eCool electric transport unit launched in 2024 exemplifies product evolution toward zero-emission delivery fleets.
The commercial refrigeration equipment market taps a broad spectrum of equipment beyond merchandisers. Reach-in refrigerators, undercounter prep tables, and blast chillers support foodservice and dark-store kitchens that prepare meal kits and click-and-collect orders. Transportation refrigeration safeguards food and pharmaceutical cargo in trucks and intermodal containers, while ice-cream freezers remain vital for impulse dessert aisles. Regulatory drag adds complexity: Title 24’s door requirement has boosted demand for glass-door merchandisers, and Europe’s Ecodesign ceilings force variable-speed compressors and LED retrofits into new units.[3]California Energy Commission, “Building Energy Efficiency Standards,” energy.ca.gov As connectivity and refrigerant compliance converge, modular designs capable of firmware updates and multi-refrigerant operation are becoming baseline specifications.


By Refrigerant Type: Inorganics Challenge Fluorocarbon Dominance
Fluorocarbons maintained a 46.28% share in 2025, buoyed by a vast installed base and drop-in blends such as R-448A and R-449A. However, inorganics principally CO₂ and ammonia are expanding at a 7.86% CAGR, the strongest of any refrigerant category. The commercial refrigeration equipment market size tied to CO₂ racks is escalating as EU retailers future-proof new builds against a 95% HFC quota cut by 2030. In the United States, allocation tightening under the AIM Act inflated HFC prices, cutting the payback period for natural alternatives below five years in some states.
CO₂ excels in cold climates and large multiplex installations, yet high pressures add component cost. Ammonia remains unrivaled in warehouse-scale freezers where efficiency outweighs toxicity concerns, provided leak detection aligns with IIAR 2 rules. Hydrocarbons dominate beverage coolers and small plug-ins, though ISO 60335-2-89 restricts charge size to safeguard against ignition. OEMs are mitigating safety hurdles with low-charge hydrocarbon circuits and ejector-assisted CO₂ loops that lift tropical efficiency. As a result, multi-refrigerant platforms that let operators pivot as policies evolve are now common in specification documents.
By Application: Healthcare Outpaces Retail Growth
Retail formats captured 37.82% of 2025 revenue, anchored by supermarkets, hypermarkets, and c-stores that deploy multi-deck cases, walk-ins, and centralized racks to showcase fresh and frozen staples. Replacement demand remains healthy, given equipment life cycles of 10-15 years and the energy savings of new high-efficiency systems. Yet healthcare and pharmaceutical facilities are the fastest climbers at an 8.32% CAGR to 2031, riding vaccine cold-chain requirements and biologics distribution. WHO rules require 2-8 °C storage with continuous logging, prompting hospitals and clinics to install medical-grade refrigerators with battery back-up and alarm alerts. Blood banks demand 1-6 °C cabinets for whole blood and -30 °C freezers for plasma, locking in a specialized pipeline of orders.
Foodservice, hospitality, and dark-store micro-fulfillment centers are also material buyers, seeking undercounter prep tables and compact walk-ins that integrate IoT monitors for HACCP compliance. Meanwhile, chemicals and industrial labs use process chillers, although they represent a smaller slice. Panasonic’s RE Series, launched in 2024, underscores the pivot toward natural-refrigerant cabinets that cut energy use while satisfying GWP caps. As biologic drugs proliferate and emerging markets ramp immunization programs, medical-grade cold chain will command outsize attention from OEM R&D budgets.
By System Configuration: Multiplex Racks Gain Share
Plug-in self-contained cabinets accounted for 41.53% of 2025 sales because small retailers and restaurants favor their plug-and-play simplicity. Remote condensing units separate compressors to reduce noise and sales-floor heat, while modular walk-ins serve back-of-house storage. Yet multiplex rack systems are growing at a 7.18% CAGR through 2031, the quickest among configurations, as large grocers consolidate loads to slash refrigerant charge, enable heat recovery, and simplify maintenance routines. California’s Title 24 offers compliance credits for centralized architectures, nudging U.S. chains toward rack adoption. Europe’s Ecodesign thresholds further favor centralized approaches that more easily hit kWh ceilings.
The commercial refrigeration equipment market size associated with multiplex racks is also lifted by CO₂ transcritical popularity, since performance scales when multiple evaporators share a common compressor bank. Although capital outlays can top USD 300,000 for a mid-size store, lifecycle savings in energy and service can cut payback to five-seven years, especially in high-utility-tariff regions. Independent grocers still favor plug-ins to avoid upfront investment, so the configuration landscape will remain bifurcated by retailer scale.
Geography Analysis
Asia Pacific commanded 34.81% of 2025 revenue as China, India, and Southeast Asian nations modernized cold-chain logistics. China’s National Development and Reform Commission targeted a 30% capacity increase in cold storage by 2030, underpinning the rollout of automated warehouses and energy-efficient racks.[4]National Development and Reform Commission of China, “Official Website,” ndrc.gov.cn India’s organized grocery penetration is tracking toward 18-20% by 2030, driving equipment orders for hypermarkets and c-stores, while Blue Star’s INR 400 crore investment signals supplier commitment to domestic growth. Convenience-store boom in Indonesia and Vietnam further boosts plug-in merchandiser demand, rounding out the region’s robust baseline.
The Middle East is the fastest-growing territory, advancing at an 8.07% CAGR. Saudi Arabia’s Public Investment Fund allocated USD 1.5 billion in 2024 for cold-logistics hubs supporting Vision 2030 retail expansion. The United Arab Emirates augmented re-export capacity, while Qatar’s event-driven hospitality pipeline pulled forward freezer and ice-machine purchases. Hot-climate efficiency premiums favor CO₂ with parallel compression or ejector assist, drawing European OEMs to partner with Gulf contractors for turnkey rack systems.
North America and Europe jointly represented roughly 45% of 2025 spending, powered by replacement cycles, Title 24 retrofits, and AIM Act compliance. Micro-fulfillment centers for online grocery are installing compact walk-ins and hybrid plug-in fleets that integrate with warehouse management platforms. South America and Africa trail in share but are catching up as modern trade formats in Brazil, Argentina, South Africa, and Nigeria demand reliable cold chains to mitigate spoilage in long-distance freight corridors.

Competitive Landscape
The commercial refrigeration equipment market features moderate fragmentation. Global giants such as Carrier Global, Daikin Industries, Johnson Controls, and Panasonic square off against regional contenders like Blue Star, Voltas, Hoshizaki, and True Manufacturing. Consolidation picked up pace when Haier closed its USD 775 million purchase of Carrier’s commercial refrigeration unit in October 2024, transferring plants in Europe and Asia and setting a USD 2 billion sales target within four years. Panasonic deepened its European footprint by acquiring Poland’s Area Cooling Solutions in July 2024 and releasing the propane-charged RE Series cabinet two months later.
Strategic priorities now cluster around three themes. First, multi-refrigerant product lines future-proof portfolios against diverging regional regulations. Second, embedded IoT modules such as Hussmann’s Refrigeration IQ turn hardware into service platforms that capture recurring analytics fees. Third, geographic diversification into high-growth zones India, Southeast Asia, and the Gulf balances slower replacement-only markets in the United States and Western Europe. Disruptive entrants like Phononic, marketing solid-state thermoelectric coolers that eliminate compressors, highlight the ongoing search for noiseless, low-maintenance alternatives.
OEMs that couple ISO 9001 and ISO 14001 certifications with natural-refrigerant expertise increasingly win bids from big-box retailers committed to emissions targets. Competitive intensity is highest in mature markets where uptime SLAs and energy guarantees differentiate suppliers, whereas in emerging regions localized assembly, after-sales service, and financing terms decide contract awards.
Commercial Refrigeration Equipment Industry Leaders
Carrier Transicold (Carrier Global Corporation)
Blue Star Limited
Voltas Limited
ITW Food Equipment Group LLC (Illinois Tool Works Inc.)
Danfoss A/S
- *Disclaimer: Major Players sorted in no particular order

Recent Industry Developments
- January 2026: Hussmann began field trials of an ammonia-CO₂ cascade rack with embedded Refrigeration IQ analytics at a warehouse club chain in Texas.
- November 2025: Johnson Controls introduced an OpenBlue plug-in retrofit kit that integrates edge sensors and cellular gateways, cutting installation time to two hours.
- October 2025: Daikin’s AHT unit commissioned a CO₂ rack manufacturing line in Austria to triple annual output targeting European grocery chains.
- March 2025: Haier committed INR 1,000 crore (USD 120 million) to expand Indian production after closing the Carrier refrigeration acquisition.


Research Methodology Framework and Report Scope
Market Definitions and Key Coverage
Our study defines the commercial refrigeration equipment market as global factory-gate revenue from new refrigerators, freezers, refrigerated display cases, beverage coolers, blast chillers, transportation refrigeration units, ice machines, vending machines, and walk-in cold rooms used across food retail, foodservice, healthcare, chemicals, and logistics settings. We consider only original equipment sold by manufacturers; installation charges appear where bundled with the unit price, ensuring consistency with Mordor's 2025 baseline of USD 44.90 billion.
Scope Exclusions: Refurbished or rental units, standalone spare-parts sales, and domestic-grade appliances are excluded.
Segmentation Overview
- By Product Type
- Blast Chillers
- Refrigerators and Freezers
- Transportation Refrigeration
- Refrigerated Display Cases
- Beverage Refrigeration
- Ice-Cream Freezers
- Refrigerated Vending Machines
- Other Product Types
- By Refrigerant Type
- Fluorocarbons
- Hydrocarbons
- Inorganics (NH₃, CO₂)
- By Application
- Food and Beverage
- Food Service and Distribution
- Hotels and Restaurants
- Bakeries
- Other Food and Beverage Applications
- Retail
- Supermarkets and Hypermarkets
- Convenience Stores
- Other Retail Stores
- Chemicals
- Healthcare and Pharmaceuticals
- Other Applications
- Food and Beverage
- By System Configuration
- Plug-In or Self-Contained Units
- Remote Condensing Units
- Multiplex Rack Systems
- Walk-In Coolers and Freezers
- By Geography
- North America
- United States
- Canada
- Mexico
- South America
- Brazil
- Argentina
- Chile
- Rest of South America
- Europe
- Germany
- United Kingdom
- France
- Italy
- Spain
- Russia
- Rest of Europe
- Asia Pacific
- China
- India
- Japan
- South Korea
- Indonesia
- Australia
- New Zealand
- Rest of Asia Pacific
- Middle East
- GCC
- Turkey
- Israel
- Rest of Middle East
- Africa
- South Africa
- Nigeria
- Egypt
- Kenya
- Rest of Africa
- North America
Detailed Research Methodology and Data Validation
Primary Research
Telephone and online interviews with manufacturers, compressor suppliers, food-retail facilities managers, and regional cold-chain integrators across North America, Europe, Asia-Pacific, and the Middle East test secondary findings, uncover average selling prices, and benchmark penetration of natural refrigerants. Responses also refine growth drivers such as dark-store roll-outs and quick-service restaurant expansions.
Desk Research
Mordor analysts begin with structured searches of tier-1 open sources such as UN Comtrade shipment data, the US Energy Information Administration appliance efficiency database, Eurostat PRODCOM output tables, and the Japan Refrigeration and Air Conditioning Industry Association shipment bulletins. Company 10-Ks, investor decks, and trade-association fact sheets (e.g., North American Association of Food Equipment Manufacturers) sharpen product splits, while paid repositories like D&B Hoovers and Dow Jones Factiva supply historical revenue trails and strategic moves. National regulations on refrigerant transitions published by the US EPA and the EU F-Gas Regulation guide technology uptake assumptions. This list is illustrative; many other sources are routinely screened to validate numbers and fill gaps.
Market-Sizing & Forecasting
A top-down model scales national production, import, and export figures to reconstruct apparent consumption, which is then cross-checked with sampled bottom-up roll-ups of leading supplier revenues and channel checks. Key variables like average selling price by cabinet type, new retail floor-space additions, food-service outlet counts, refrigerant phase-out timelines, and GDP-linked disposable-income shifts anchor the multivariate regression forecast. Where country-level customs codes pool commercial and household units, ratio splits obtained from primary interviews adjust the totals before the five-year ARIMA projection is run.
Data Validation & Update Cycle
Outputs pass a two-step analyst and research-manager review; variance triggers flag deviations over three percentage points versus historical trends, and clients receive refreshed datasets annually, with interim updates after material events such as policy changes on high-GWP gases.
Why Our Commercial Refrigeration Equipment Baseline Commands Dependability
Published figures vary because firms adopt different product baskets, pricing bases, and refresh cadences.
Key gap drivers include: some providers fold aftermarket service and rental revenue into equipment sales, others omit transportation refrigeration, and many still convert currencies at single-month spot rates, whereas Mordor applies average fiscal-year rates and a consistent exclusion policy.
Benchmark comparison
| Market Size | Anonymized source | Primary gap driver |
|---|---|---|
| USD 44.90 B (2025) | Mordor Intelligence | |
| USD 57.41 B (2025) | Global Consultancy A | Includes maintenance contracts and rental fleets, inflating base |
| USD 51.66 B (2025) | Trade Journal B | Uses distributor-level prices and bundles cold-room panels |
In sum, our disciplined scope, verified variables, and yearly refresh give decision-makers a balanced, transparent baseline they can retrace and replicate with confidence.


Key Questions Answered in the Report
What is the projected value of the commercial refrigeration equipment market in 2031?
The market is forecast to reach USD 62.74 billion by 2031 at a 5.73% CAGR.
Which product category is expanding fastest through 2031?
Refrigerated vending machines are growing at a 6.43% CAGR, outpacing traditional formats.
Why are natural refrigerants gaining ground in new supermarket builds?
Stricter HFC phase-down rules in Europe and the United States, along with energy-efficiency incentives, make CO₂ and hydrocarbons economically attractive within five-year payback periods.
Which region is expected to post the highest growth rate?
The Middle East leads with an 8.07% CAGR, supported by Saudi Vision 2030 and UAE cold-storage expansion.
How are IoT platforms influencing maintenance strategies?
Embedded sensors and cloud analytics such as Refrigeration IQ cut unplanned service calls by up to 25% and lower energy use 10-15%, translating to reduced total cost of ownership.
What key challenge limits adoption of CO₂ and hydrocarbon systems?
A global shortage of technicians certified to handle high-pressure CO₂ and flammable hydrocarbons slows installations and raises service costs.
Page last updated on:


