Industrial Refrigeration System Market Size and Share
Market Overview
| Study Period | 2020 - 2031 |
|---|---|
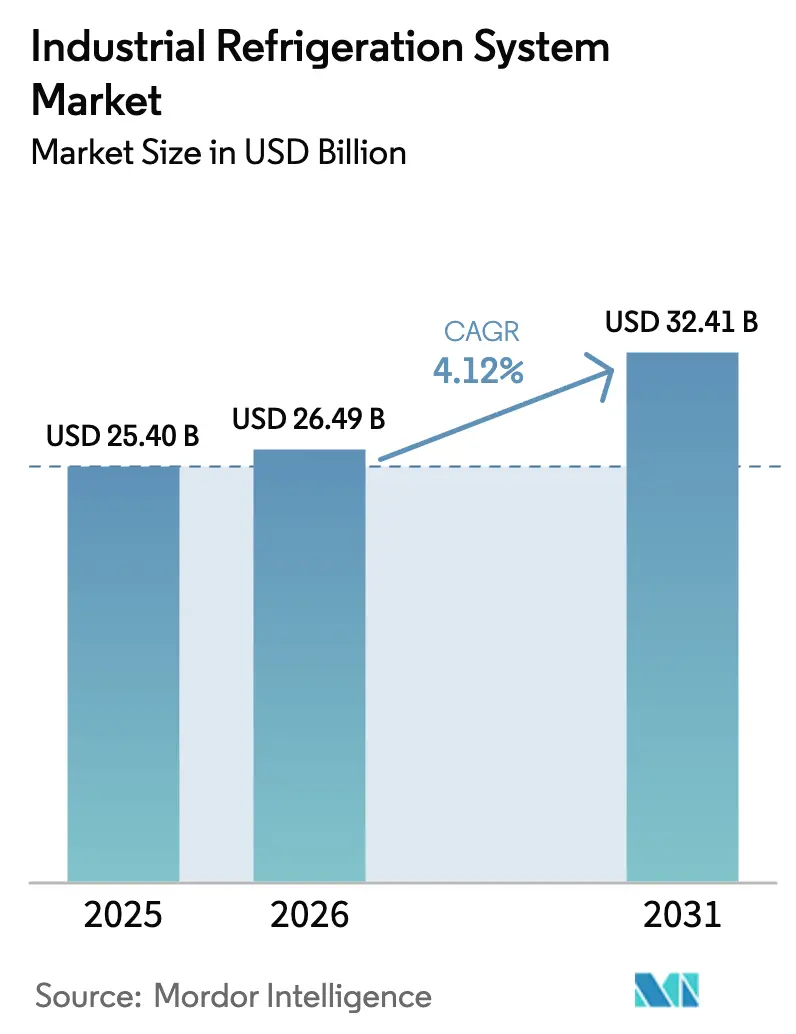
| Market Size (2026) | USD 26.49 Billion |
| Market Size (2031) | USD 32.41 Billion |
| Growth Rate (2026 - 2031) | 4.12% CAGR |
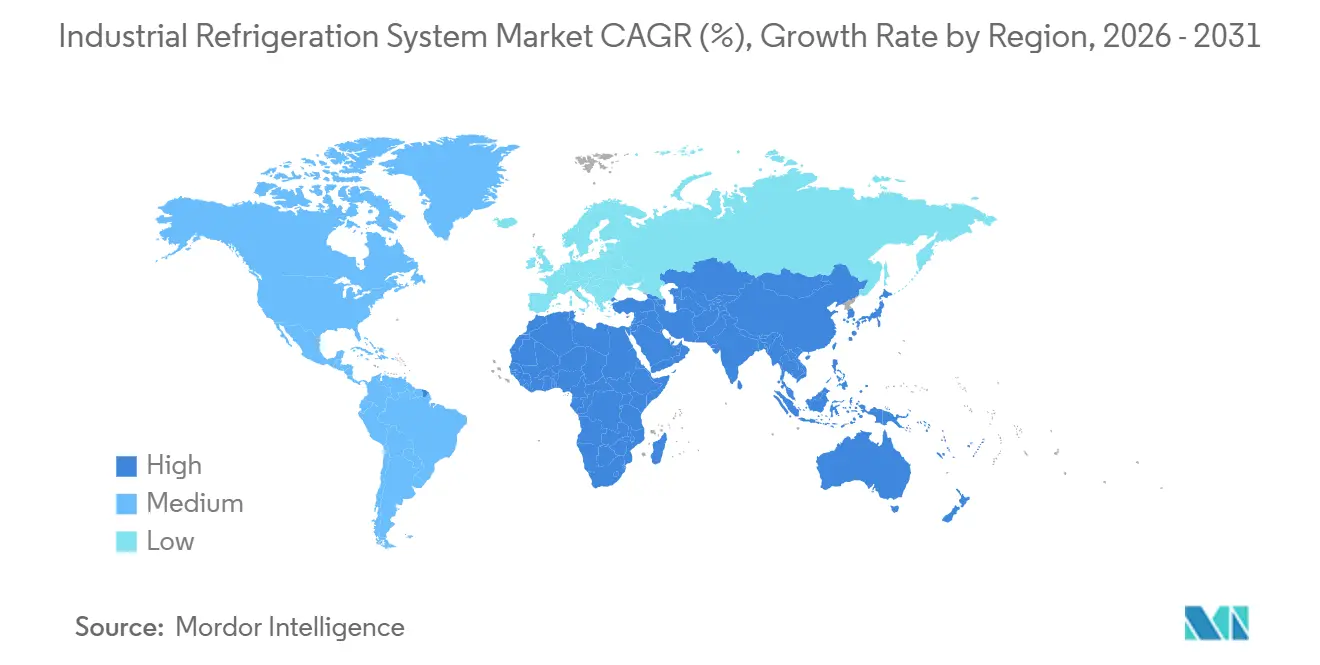
| Fastest Growing Market | Middle East and Africa |
| Largest Market | Asia Pacific |
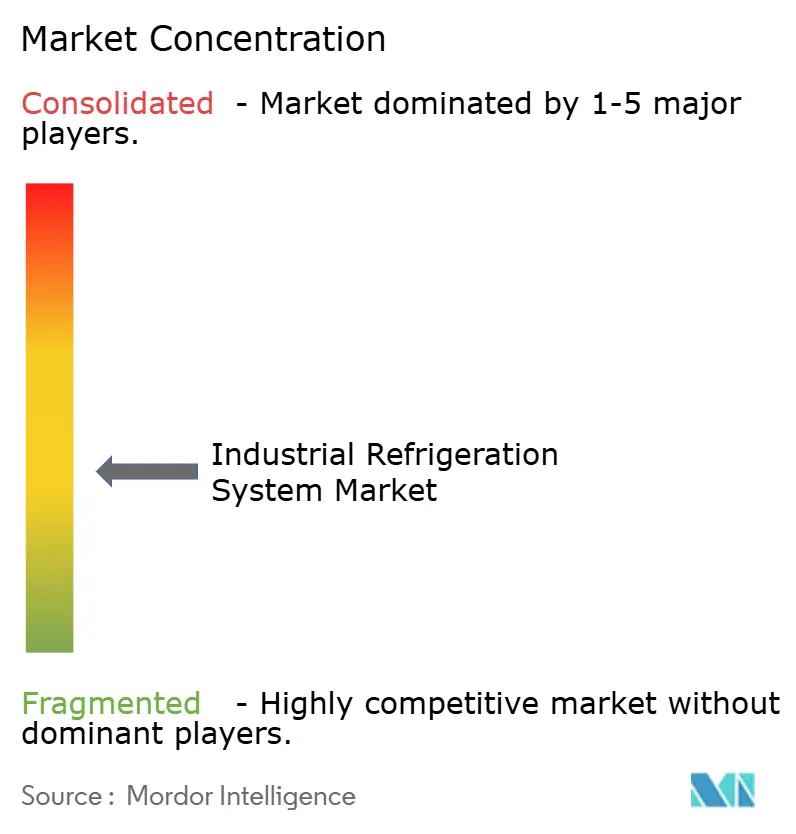
| Market Concentration | Medium |
Major Players *Disclaimer: Major Players sorted in no particular order Image © Mordor Intelligence. Reuse requires attribution under CC BY 4.0. | |
Industrial Refrigeration System Market Analysis by Mordor Intelligence
The Industrial Refrigeration System Market size was valued at USD 25.40 billion in 2025 and is estimated to grow from USD 26.49 billion in 2026 to reach USD 32.41 billion by 2031, at a CAGR of 4.12% during the forecast period (2026-2031). Growth is anchored in the phase-out of high global-warming-potential refrigerants, rising investments in ammonia and carbon dioxide equipment, and a decisive shift from upfront cost to lifecycle cost decisions. End-users in cold storage and food processing now embed AI-enabled predictive maintenance to trim unplanned downtime and safeguard perishable inventory, while data-center operators adopt heat-reuse chillers that monetize waste heat. Suppliers continue to streamline portfolios, moving away from commodity hardware toward controls and digital services, a strategy that shields margins as hardware prices fluctuate with steel and copper costs. At the same time, component shortages, especially for rare-earth magnets used in variable-speed drives, are pushing up lead times and motivating vertical integration among leading vendors.
Key Report Takeaways
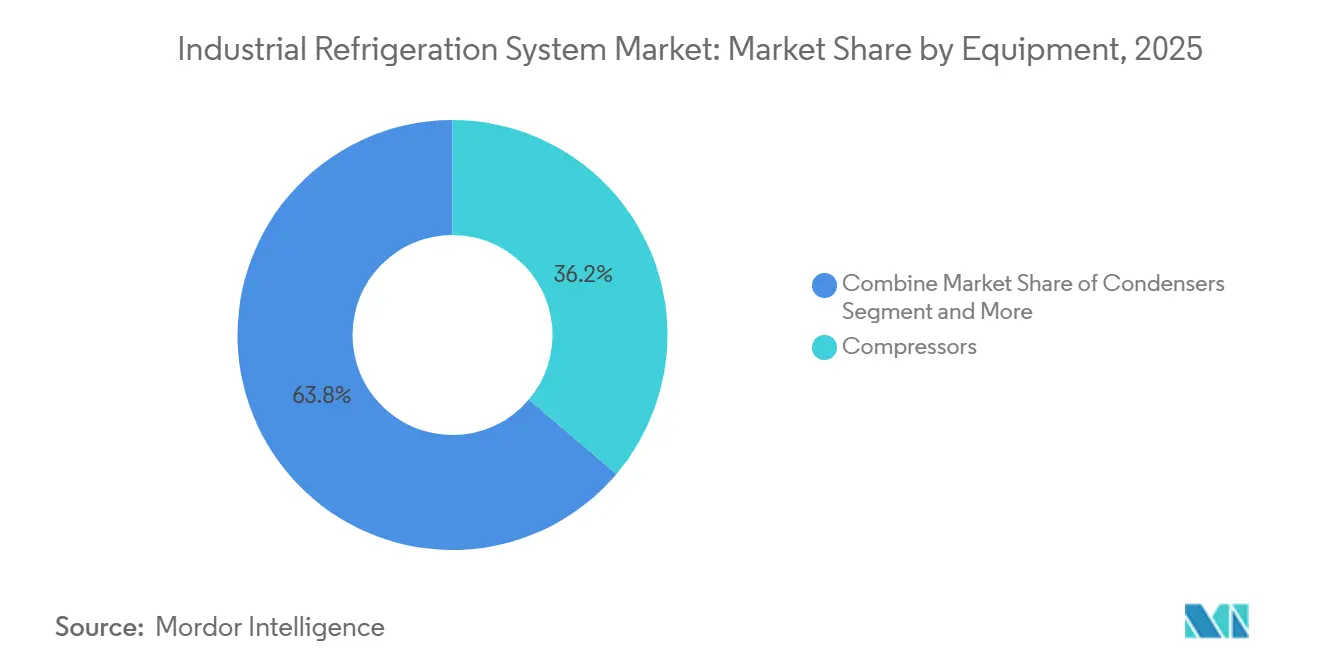
- By equipment, compressors commanded 36.18% of the industrial refrigeration system market share in 2025. Controls and automation are forecast to expand at a 4.93% CAGR through 2031, the fastest pace among equipment groups.
- By refrigerant, ammonia accounted for 42.41% of the industrial refrigeration system market share in 2025. Carbon dioxide systems are projected to advance at a 4.51% CAGR to 2031.
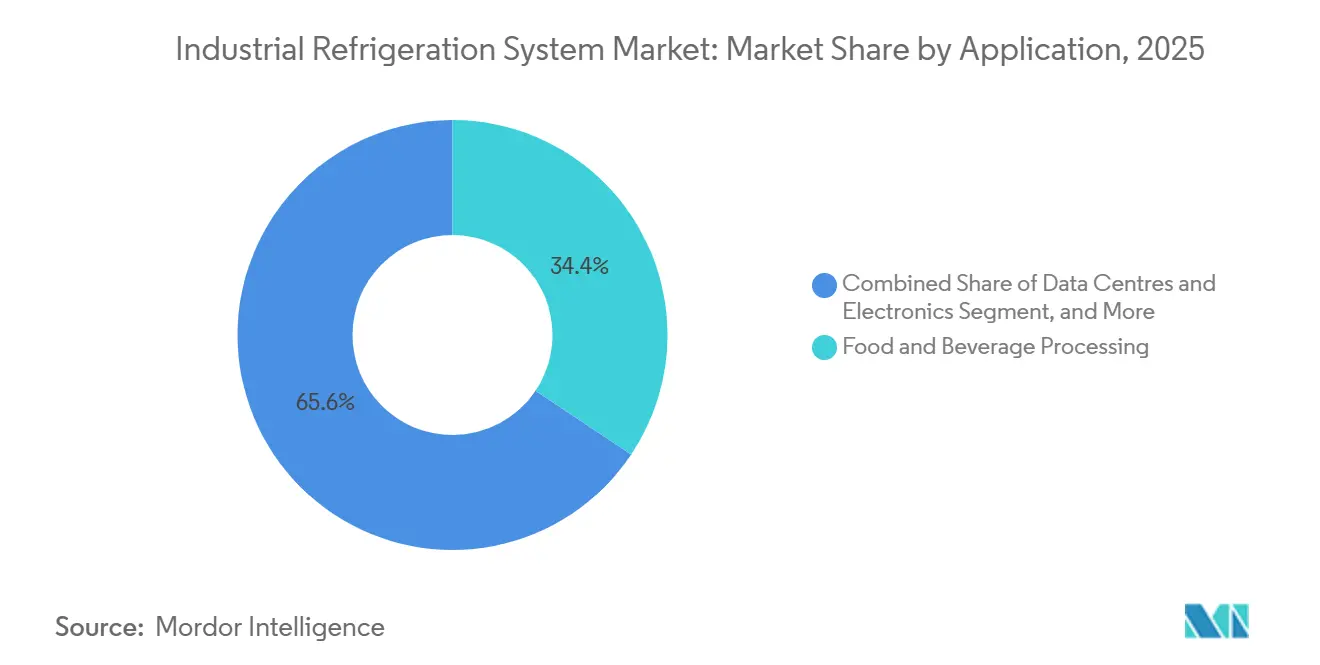
- By application, food and beverage processing led with 34.39% revenue share in 2025. Data centers and electronics cooling is set to grow at a 4.82% CAGR through 2031.
- By system capacity, installations above 1 megawatt accounted for 39.73% of the industrial refrigeration market in 2025. Systems capacity rated 100 to 1,000 kilowatts are poised to log the highest CAGR at 5.11% during 2026-2031.
- By geography, Asia Pacific generated 41.22% of 2025 revenue. The Middle East and Africa is on track for the quickest regional CAGR at 5.23% to 2031.
Note: Market size and forecast figures in this report are generated using Mordor Intelligence’s proprietary estimation framework, updated with the latest available data and insights as of January 2026.
Global Industrial Refrigeration System Market Trends and Insights
Drivers Impact Analysis*
| Driver | (~) % Impact on CAGR Forecast | Geographic Relevance | Impact Timeline |
|---|---|---|---|
| Surge in Automated Cold-Chain Warehouses | +0.90% | Global, with concentration in Asia Pacific and North America | Medium term (2-4 years) |
| Tightening F-Gas and Kigali Compliance Deadlines | +0.80% | Europe and North America, spillover to Asia Pacific | Short term (≤ 2 years) |
| Rapid Adoption of Ultra-Low-Charge NH3 and CO2 Systems | +0.70% | Europe, North America, and Australia | Medium term (2-4 years) |
| AI-Enabled Predictive Maintenance Lowering Lifecycle Cost | +0.60% | Global, early adoption in North America and Europe | Long term (≥ 4 years) |
| Green-Hydrogen Plants Requiring Large-Scale Chilling | +0.30% | Middle East, Europe, and Australia | Long term (≥ 4 years) |
| Demand from Immersion-Cooled Data Centres for Heat-Reuse Chillers | +0.50% | North America, Europe, and Asia Pacific | Medium term (2-4 years) |
| Source: Mordor Intelligence | |||
Surge in Automated Cold-Chain Warehouses
Automated cold warehouses concentrate throughput in fewer, high-capacity hubs that operate around the clock at sub-zero temperatures, driving demand for ammonia systems sized above 2 megawatts. Investment announcements from major operators confirm the trend, with large frozen-food sites requiring tighter ±0.5 °C control that favours multi-stage compression and cascade architectures.[1]NewCold, “Investment Program for Automated Cold Storage Expansion,” newcold.com Asian grocery e-commerce growth further accelerates retrofits, prompting logistics providers to add variable-speed screw compressors and IoT-ready evaporator fans. Manufacturers of automated storage and retrieval cranes also set stricter thermal tolerances, aligning mechanical handling with refrigeration controls to prevent condensation on robotics. As a result, the industrial refrigeration system market sees higher average project values and longer-term service contracts, lifting aftermarket revenue streams.
Tightening F-Gas and Kigali Compliance Deadlines
Regulatory phase-down schedules shorten the viable window for new HFC equipment, prompting a surge in natural-refrigerant conversions. The European Union now mandates a 95% cut in HFC use by 2030, while the United States bars HFCs from new industrial process refrigeration from January 2025.[2]European Commission, “Regulation (EU) 2024/573 on Fluorinated Greenhouse Gases,” eur-lex.europa.eu Documentation rules on leak tracking add administrative cost, favouring factory-packaged ammonia and CO2 racks that arrive pre-charged and hermetically tested. Financial penalties compound non-compliance risk, as Japan’s carbon price of JPY 3,000 per ton of CO2-equivalent raises the direct cost of HFC leaks.[3]Japan Ministry of Economy Trade and Industry, “Carbon Pricing Mechanism for HFC Emissions,” meti.go.jp This policy mix accelerates a replacement cycle that sustains industrial refrigeration system market growth even as total installed capacity stabilizes in mature economies.
Rapid Adoption of Ultra-Low-Charge NH3 and CO2 Systems
Packaged architectures that keep refrigerant inventory below regulatory thresholds reduce permitting barriers and shrink insurance premiums. Compressor makers introduced units that achieve less than 1.5 kilograms of ammonia per kilowatt of cooling, opening doors for plant owners in urban zones with strict safety codes. Transcritical CO2 racks provide simultaneous cooling and heating, letting processors decarbonize hot-water demand, a benefit that strengthens the business case against HFC retrofits. Suppliers report rising orders from beverage and dairy sites where waste heat displaces natural gas boilers, shortening payback periods. The industrial refrigeration system market absorbs these packaged units quickly because they arrive pre-engineered, cutting installation time and limiting on-site skilled labour needs.
AI-Enabled Predictive Maintenance Lowering Lifecycle Cost
Sensor suites on compressors, condensers, and motors stream vibration, oil quality, and temperature data into cloud analytics. Machine-learning algorithms then flag anomalies up to 30 days before failure, allowing service teams to repair during planned downtime. Reductions in unplanned outages save food processors hundreds of thousands of dollars in product loss, outweighing the subscription cost of monitoring platforms. Insurance carriers award premium discounts to sites that document predictive-maintenance programs, adding a financial incentive. Vendors bundle analytics with extended warranties, creating recurring revenue and strengthening customer lock-in, a strategy that differentiates hardware offerings in the industrial refrigeration system market.
Restraints Impact Analysis*
| Restraint | (~) % Impact on CAGR Forecast | Geographic Relevance | Impact Timeline |
|---|---|---|---|
| High Capex and Skilled-Labour Scarcity for Natural Refrigerants | -0.60% | Global, acute in North America and Europe | Medium term (2-4 years) |
| Volatile Steel and Copper Prices Inflating Equipment Costs | -0.40% | Global, with pronounced impact in Asia Pacific | Short term (≤ 2 years) |
| Cyber-Insurance Premiums for IoT-Linked Refrigeration Systems | -0.20% | North America and Europe | Short term (≤ 2 years) |
| Rare-Earth Magnet Supply Risk for VSD Compressors | -0.30% | Global, supply concentrated in China | Long term (≥ 4 years) |
| Source: Mordor Intelligence | |||
High Capex and Skilled-Labor Scarcity for Natural Refrigerants
Natural-refrigerant plants cost 20%-40% more than HFC equivalents because of stainless-steel heat exchangers, enhanced ventilation, and redundant safety interlocks. Budget pressures are compounded by a shrinking pool of certified ammonia technicians, especially in North America where retirements outpace training enrolment. Certification bodies require two years of supervised field experience, delaying workforce replenishment and extending project schedules. Labor premiums reach USD 150 per hour in major U.S. metro areas, a surcharge that elongates payback periods and slows industrial refrigeration system market adoption in smaller enterprises. Equipment vendors respond with factory-built, skid-mounted modules that reduce on-site work, but labour scarcity will remain a near-term drag on project velocity.
Volatile Steel and Copper Prices Inflating Equipment Costs
Commodity metals account for a large share of pressure-vessel, heat-exchanger, and motor-winding cost. Hot-rolled coil steel rose from USD 650 per ton in mid-2024 to USD 750 per ton by January 2025, while copper climbed to USD 9,200 per ton. Suppliers now insert material-escalation clauses and cut quotation validity to 30 days, compelling end-users to manage price risk or postpone orders. The change complicates budgeting for multiphase cold-storage builds and squeezes margins on fixed-price contracts. Some manufacturers test aluminium micro-channel heat exchangers, yet ammonia compatibility concerns limit broad replacement, leaving the industrial refrigeration system market exposed to commodity volatility through the forecast horizon.
*Our forecasts treat driver/restraint impacts as directional, not additive. The impact forecasts reflect baseline growth, mix effects, and variable interactions.
Segment Analysis
By Equipment: Controls Outpace Legacy Hardware
Controls already represent the fastest-growing slice of the industrial refrigeration system market. Compressors retained a 36.18% revenue share in 2025, underscoring their central function, yet programmable logic controllers, variable-frequency drives, and cloud dashboards are climbing at a 4.93% CAGR to 2031. This expansion mirrors mandates such as California’s Title 24 update that requires demand-response integration in systems capacity above 100 kilowatts. Advanced drives trim compressor energy by up to 50%, allowing site owners to recover investment within 18 months, and the energy savings improve the overall industrial refrigeration system market size by unlocking deferred projects. Condensers and evaporators trail the market average as their design advances focus on incremental heat-transfer gains rather than radical efficiency jumps. Receivers and heat exchangers gain traction because cascade and transcritical designs need intermediate heat exchange, adding bill-of-materials value per installation. Controls vendors also bundle analytics subscriptions, producing annuity revenue that stabilizes earnings across macro cycles.
Digital retrofits increasingly target brownfield plants. Operators in mature economies pair existing compressors with new drives and sensor kits, leveraging sunk hardware cost while capturing energy rebates from utilities. The pairing boosts legacy asset utilization, a benefit for cash-constrained processors navigating commodity price swings. Market surveys show 30% of installed compressors above 15 years old in North America are now candidates for control upgrades within three years, suggesting a sizable aftermarket runway. Hardware suppliers form alliances with IT platforms to ensure cybersecurity compliance, addressing buyer concerns over ransomware that previously stalled adoption. In aggregate, controls and automation will continue to outpace aggregate industrial refrigeration system market growth as users prioritize data-driven efficiency.


By Refrigerant: CO2 Gains on Ammonia Leadership
Ammonia held 42.41% of 2025 installations, buoyed by zero-GWP credentials and superior thermodynamic performance in large plants. Nevertheless, transcritical carbon dioxide designs are advancing at a 4.51% CAGR through 2031. Europe sets the standard, deploying thousands of low-charge CO2 racks in supermarkets and distribution hubs, yet uptake now spreads to North American distribution centers ahead of 2028 compliance deadlines. Hydrofluorocarbons linger in pockets that demand ultra-low temperatures or have limited retrofit budgets, but legislative barriers render new HFC projects marginal. Hydrocarbons, chiefly propane, capture niche demand in small systems capacity below 50 kilowatts where flammability risk is manageable. Equipment makers hedge bets by offering dual-refrigerant platforms, allowing end-users to switch refrigerants as local codes evolve.
The industrial refrigeration system market size attached to carbon dioxide expands on the back of packaging standardization. Vendors supply pre-engineered racks complete with gas coolers and heat reclaim modules, removing site-specific engineering and accelerating commissioning. Case studies record 35% total energy savings in seafood processing plants after switching from R-507A to CO2 booster racks, an outcome that bolsters the value narrative. In warmer climates, parallel compression and adiabatic gas coolers mitigate CO2 efficiency penalties, broadening feasible operating zones. Insurance carriers are more comfortable covering CO2 than ammonia in customer-facing retail spaces, a factor that tips supermarket specification lists toward transcritical designs. These dynamics ensure a widening footprint for carbon dioxide within the broader industrial refrigeration system market.
By Application: Data Centers Outstrip Traditional Segments
The industrial refrigeration system market size attached to food and beverage processing stood at 34.39% in 2025, preserving its dominant role because chilled milk, frozen meat, and brewery operations run around the clock. Yet data centers and electronics cooling claim the highest CAGR at 4.82% as hyperscale operators embrace immersion-cooled racks generating heat loads beyond 100 kilowatts per rack. Heat-reuse chillers that export 60 °C-90 °C water supply district heating networks, creating dual revenue streams that strengthen project economics. Cold storage and logistics follows closely behind, lifted by online grocery trends and pharmaceutical distribution that demand multi-temperature nodes in a single site. Chemicals and pharmaceuticals deploy tight-tolerance reactor cooling, while LNG and fuel terminals use multi-megawatt trains that dominate average system capacity metrics.
Emerging use cases also surface. Green-hydrogen plants now specify large-scale chilling loops to condense hydrogen at cryogenic temperatures for storage and transport, and these projects often align with renewable energy clusters that value zero-GWP refrigerants. Dairy processors worldwide adopt regenerative heat pumps that harvest waste heat to pasteurize incoming milk, showcasing circular energy flows within a single plant. Semiconductor fabrication, facing rising heat loads from advanced lithography, evaluates sub-ambient cooling loops with ultra-low-charge ammonia. Each new application injects technical requirements that spur innovation in compressors, heat exchangers, and controls, reinforcing the multi-dimensional growth in the industrial refrigeration system market.
By System Capacity: Modular Mid-Range Systems Capacity Win Share
Installations rated greater than 1 megawatt accounted for 39.73% of 2025 revenue, consistent with mega cold warehouses and LNG terminals. Modularity, however, reshapes procurement in the 100-to-1,000-kilowatt band, which is projected to post a 5.11% CAGR through 2031. Operators prefer multiple 500-kilowatt modules over a single 2-megawatt plant to delay capital spending and match capacity with phased production ramps. This modular model also aligns with distributed generation. Solar-plus-battery microgrids deliver daytime power to refrigeration modules, decoupling energy cost from grid volatility. Smaller units packaged on skids circumvent local permitting hurdles tied to large ammonia charges, allowing medium-sized processors to adopt natural refrigerants sooner.
From a supply-chain lens, manufacturers benefit from standardized frames, easier factory testing, and shorter lead times. Service networks leverage interchangeable spare parts across modules, reducing inventory burden. In emerging markets, mid-range units fit the footprint of brownfield sites where real estate is constrained. These strengths are driving a rising share of the industrial refrigeration system market toward modular capacity, even as mega projects continue to anchor absolute revenue due to their scale.
By System Type: Transcritical Architectures Reach Maturity
Single-stage compression dominates chilled-water duties, while two-stage remains the reference design for frozen-food cold rooms at –25 °C. Cascade and transcritical builds accelerate fastest, powered by food processors seeking deeper temperature lifts and simultaneous hot water. Transcritical CO2 racks now reach coefficients of performance above 4.0 when paired with waste-heat reclaim, matching or exceeding ammonia efficiency in temperate climates. Cascade layouts combining CO2 low stage with ammonia high stage enable –50 °C tuna freezing without extreme compression ratios. Vendors standardize control algorithms that manage high-pressure valves and ejectors, making historically complex systems capacity nearly plug-and-play.
Heat-pump integration within the same skid reduces plant room footprint and eliminates standalone boilers, creating a compelling decarbonization package. Technology partnerships, such as Mayekawa and Mitsubishi Heavy Industries, aim to optimize motor control and economizer staging for further energy gains. Training curricula evolve in tandem, with certification bodies adding modules on high-pressure CO2 safety, enlarging the pool of qualified technicians. As cost declines converge with single-stage ammonia levels, cascade and transcritical architectures will secure more of the industrial refrigeration system market, especially in jurisdictions incentivizing waste-heat reuse.
Geography Analysis
Asia Pacific accounted for 41.22% of 2025 revenue in the industrial refrigeration system market, reflecting government subsidies for cold-chain buildouts and dairy-processing upgrades. China’s CNY 50 billion rural cold-chain scheme spurs ammonia warehouse construction in interior provinces. India’s cooperative dairies added chilled-milk capacity requiring sub-4 °C cooling within two hours, a spec achievable only with high-efficiency screw compressors. Japan focuses on retrofitting R-22 systems ahead of its 2025 HCFC ban, while Australia and New Zealand roll out transcritical CO2 supermarket upgrades to fully remove HFCs from new stores. Southeast Asian seafood exporters boost blast-freezing lines, and compressor shipments to Vietnam and Thailand rose 18% in 2024. These projects combine to expand the regional industrial refrigeration system market size at a pace that matches population-driven food demand.
The Middle East and Africa have the highest forecast CAGR at 5.23%. Food security agendas fuel cold-storage corridors linking ports to inland hubs. Dubai earmarked USD 500 million for ten new warehouses near Jebel Ali, each designed with CO2 chillers suitable for 45 °C ambient conditions. DP World opened a USD 29 million facility in Egypt to serve pharmaceutical imports under EU Good Distribution Practice, adding credibility to regional logistics offerings. Saudi Arabia’s NEOM zone invests in ammonia cold chain to back vertical farming schemes, while Maersk and local partners build a 100,000-square-meter refrigerated site in Riyadh. Leak-reporting mandates starting January 2025 accelerate natural-refrigerant adoption and pull in controls upgrades, reinforcing industrial refrigeration system market momentum across the Gulf.
North America and Europe remain technology trendsetters, with regulations sparking replacement cycles. The United States Technology Transitions Rule propels HFC-to-ammonia retrofits in dairy states, and utility rebates sweeten the payback for variable-speed drives. Europe’s revised F-Gas plan has 62% of cold-store owners budgeting retrofits by 2027. While growth rates trail emerging regions, high unit values keep these continents significant revenue contributors. South America shows steady demand anchored in Brazil’s meat-export dominance, and JBS runs 85 ammonia plants with more in build stage. Africa remains modest yet pockets in South Africa’s wine chain and Kenya’s floriculture add niche refrigerated logistics, pointing to future upside.

Competitive Landscape
The industrial refrigeration system market displays moderate concentration, with the top ten players holding roughly 45%-50% of global revenue. Strategic realignments are prolific. Johnson Controls exited residential HVAC for USD 6.7 billion to Bosch, redeploying capital into OpenBlue digital twin software that leverages its large installed base for value-added analytics. Carrier sold its commercial refrigeration business to Haier for USD 775 million, focusing on building-automation services that carry higher margins. Such moves highlight a consensus that software and recurring service revenue protect profitability better than hardware alone.
OEMs increasingly pair equipment delivery with multiyear maintenance agreements that bundle spare parts, remote monitoring, and regulatory compliance services. GEA’s 2024 report records aftermarket share rising to 38% of refrigeration revenue. Vertical integration trends surface as Ingersoll Rand buys niche valve houses, securing component supply and reducing exposure to rare-earth magnet risk. At the same time, electronics multinationals seek adjacency synergies. Samsung acquired FläktGroup in November 2025, signalling ambition to cross-sell thermal systems into its semiconductor fabs. Eaton’s USD 9.5 billion bid for Boyd Thermal reflects similar interest in data-center cooling.
Differentiation also occurs through natural-refrigerant expertise. Star Refrigeration packages CO2 plants that bypass on-site engineering bottlenecks, attracting small to mid-scale food processors. Software platforms like Emerson Plantweb Insight overlay machine learning on any compressor brand, expanding addressable market while sidestepping hardware margins. Patents issued in the United States climbed to 127 in 2024, mainly around variable-speed motor control and leak detection. New ISO 5149 requirements for ammonia safety compel suppliers to invest in compliance engineering, raising entry barriers for smaller firms and nudging sector concentration upward, yet regional specialists remain competitive by offering localized service networks that global giants find expensive to replicate.
Industrial Refrigeration System Industry Leaders
Johnson Controls
Emerson Electric
GEA Group
Danfoss
Mayekawa (Mycom)
- *Disclaimer: Major Players sorted in no particular order

Recent Industry Developments
- April 2025: ESPEC released an ultra-low temperature shock freezer rated to −70 °C, targeting pharma and biotech customers
- February 2025: Nisshin Seifun deployed an AI-driven demand-planning engine for frozen foods, trimming scheduling time by 50 hours per month
- November 2024: Copeland and Daikin formed a joint venture to introduce inverter swing rotary compressors into U.S. HVAC channels, with production slated for mid-2025
- November 2024: Johnson Controls Academy expanded technician training throughput to 300 graduates per year to alleviate labor shortages


Research Methodology Framework and Report Scope
Market Definitions and Key Coverage
Mordor Intelligence defines the industrial refrigeration system market as all fixed, factory-assembled equipment that extracts heat from industrial processes or bulk materials and expels it through mechanical compression or absorption cycles; this covers compressors, condensers, evaporators, vessels, controls, and supporting valves used in food processing, cold-storage logistics, chemicals, and energy applications worldwide.
Scope exclusion: Small plug-in commercial fridges, residential air-conditioning units, and district cooling plants sit outside our coverage.
Segmentation Overview
- By Equipment
- Compressors
- Condensers
- Evaporators
- Heat-Exchangers and Receivers
- Controls and Automation
- Others, Equipment
- By Refrigerant
- Ammonia (R-717)
- Carbon Dioxide (R-744)
- Hydro-Fluorocarbons (HFC/HFO)
- Hydro-Carbons (Propane, Isobutane)
- By Application
- Food and Beverage Processing
- Cold-Storage and Logistics
- Chemicals and Pharmaceuticals
- Oil and Gas / LNG
- Data Centres and Electronics
- By System Capacity
- Less Than 100 kW (Small)
- 100 - 1,000 kW (Medium)
- Greater Than 1 MW (Large)
- By System Type
- Single-Stage Compression
- Two-Stage Compression
- Cascade & Transcritical
- By Geography
- North America
- United States
- Canada
- Mexico
- South America
- Brazil
- Argentina
- Rest of South America
- Europe
- United Kingdom
- Germany
- France
- Italy
- Spain
- Russia
- Rest of Europe
- Asia Pacific
- China
- Japan
- India
- South Korea
- Australia and New Zealand
- Southeast Asia
- Rest of Asia Pacific
- Middle East
- Saudi Arabia
- United Arab Emirates
- Turkey
- Rest of Middle East
- Africa
- South Africa
- Nigeria
- Kenya
- Rest of Africa
- North America
Detailed Research Methodology and Data Validation
Primary Research
Interviews and short surveys with plant engineers, cold-store operators, component suppliers, and regional safety inspectors across North America, Europe, APAC, and the GCC enable us to test desk-based assumptions, sense-check typical kilowatt-per-cubic-meter ratios, and capture early signals on CO₂ trans-critical adoption.
Responses guide our margin adjustments and scenario probabilities.
Desk Research
Our desk effort starts with public statistics from agencies such as the Global Cold Chain Alliance, IEA energy-intensity datasets, and UN Comtrade ammonia trade codes, which give baseline capacity, energy use, and refrigerant flow trends.
Trade associations for natural refrigerants, patent filings captured via Questel, and safety alerts issued by OSHA and ECHA then enrich the technology pipeline and regulatory timeline.
Annual reports from listed OEMs plus customs-level shipment data sourced through Volza help us validate average selling prices.
We finally consult D&B Hoovers and Dow Jones Factiva for company footprint verification and project announcements.
The sources cited here are illustrative; many additional items were reviewed to cross-check figures and fill minor gaps.
Market-Sizing & Forecasting
We first construct a top-down demand pool using cold-storage cubic meters, processed-food output, and chemical throughput; each is linked to a refrigeration-ton coefficient derived from expert input, which is then multiplied by blended ASPs to yield 2025 value.
Supplier roll-ups for compressors and evaporators plus channel checks on natural-refrigerant skid sales provide a selective bottom-up view that is reconciled with the pool through one variance bridge, ensuring the two approaches meet within a 7% band.
Key drivers modeled include new warehouse floor space, energy price trends, refrigerant phase-down timelines, capacity utilization in F&B plants, and average efficiency gains (kWh/ton).
A multivariate regression with lagged GDP and retail frozen-food indices underpins our 2026-2030 projections, while scenario analysis handles policy or commodity-price shocks.
Gaps in bottom-up coverage are imputed using weighted regional proxies before final aggregation.
Data Validation & Update Cycle
Triangulation runs through iterative peer review, anomaly flags on year-over-year deltas above two standard deviations, and back-testing against historical plant completion counts.
Mordor analysts refresh models annually and push interim revisions when regulations change or a major refrigerant ban accelerates replacements.
Why Our Industrial Refrigeration System Baseline Commands Reliability
Published values often differ because firms apply unique service boundaries or price stacks and refresh data on uneven schedules.
Key gaps arise when other studies bundle commercial walk-ins, assume flat ASP curves, or convert currencies at outdated rates; our team, by contrast, keeps to industrial-only equipment, applies dynamic ASP learning curves, and converts every figure with the average IMF rate for the stated year.
Benchmark comparison
| Market Size | Anonymized source | Primary gap driver |
|---|---|---|
| USD 25.35 B (2025) | Mordor Intelligence | - |
| USD 19.0 B (2024) | Global Consultancy A | Includes district cooling and omits inflation-adjusted ASPs |
| USD 21.32 B (2024) | Industry Journal B | Excludes >5 MW systems, uses single refrigerant scenario |
| USD 25.10 B (2026) | Regional Consultancy C | Forecast base year shifted, top-down only, no primary validation |
In sum, the balanced scope, dual-path modeling, and yearly review cadence adopted by Mordor Intelligence give decision-makers a transparent, repeatable baseline they can rely on when planning capacity or negotiating supplier contracts.


Key Questions Answered in the Report
What is the 2026 value of the industrial refrigeration system market?
It stands at USD 26.49 billion, and it is projected to reach USD 32.41 billion by 2031 at a 4.12% CAGR.
Which equipment group is expanding fastest?
Controls and automation show the highest growth, registering a 4.93% CAGR through 2031 due to energy-efficiency and regulatory demands.
Why are carbon dioxide systems gaining popularity?
Transcritical CO2 racks help users comply with F-Gas and Kigali rules while offering simultaneous heating and cooling, driving a 4.51% CAGR.
Which region is forecast to grow the quickest?
The Middle East leads with a 5.23% CAGR as governments fund cold-storage corridors aligned with food-security goals.
How do predictive-maintenance platforms benefit plant owners?
They detect faults up to 30 days early, reducing unplanned downtime by more than 40% and protecting perishable goods.
What challenges slow natural-refrigerant adoption?
Higher capital cost and a shortage of certified ammonia technicians add 20%-40% to project budgets and lengthen commissioning schedules.
Page last updated on:


