Property and Casualty Insurance Market Size and Share
Market Overview
| Study Period | 2020 - 2031 |
|---|---|
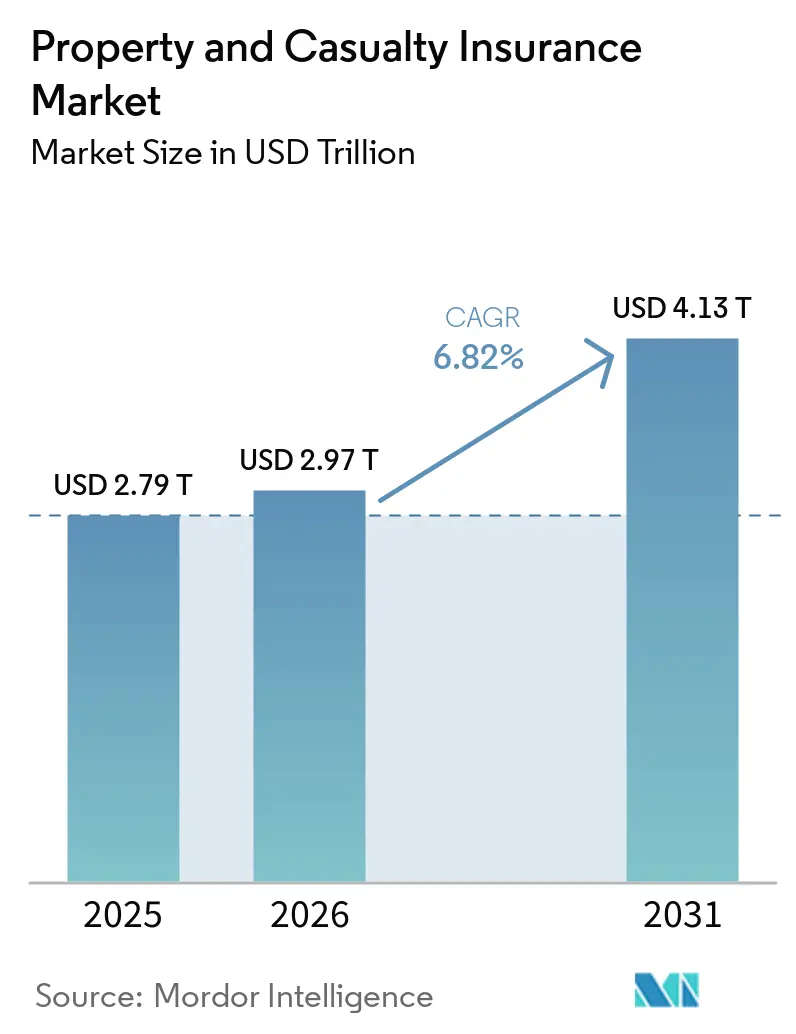
| Market Size (2026) | USD 2.97 Trillion |
| Market Size (2031) | USD 4.13 Trillion |
| Growth Rate (2026 - 2031) | 6.82% CAGR |
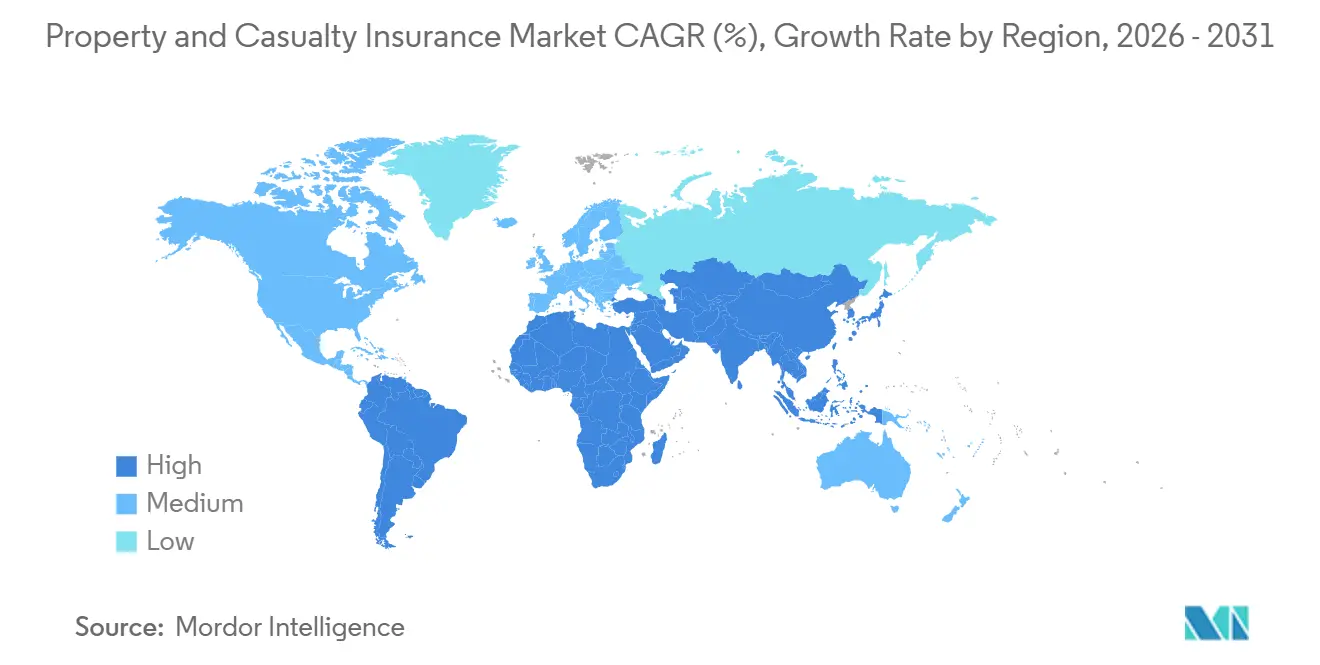
| Fastest Growing Market | Asia-Pacific |
| Largest Market | North America |
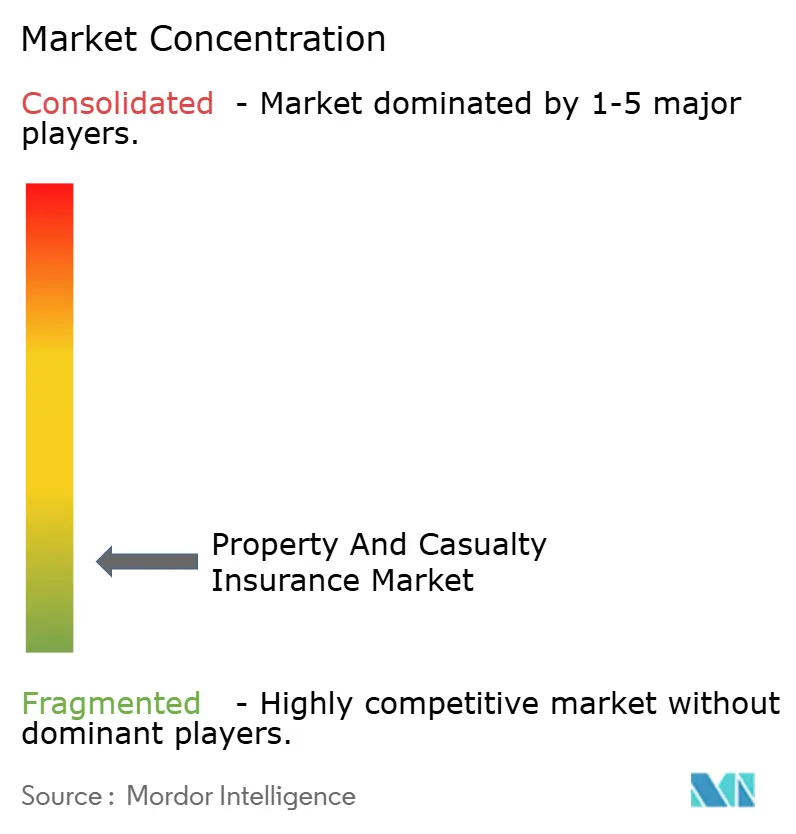
| Market Concentration | Low |
Major Players *Disclaimer: Major Players sorted in no particular order Image © Mordor Intelligence. Reuse requires attribution under CC BY 4.0. | |
Property and Casualty Insurance Market Analysis by Mordor Intelligence
The Property And Casualty Insurance Market size is projected to be USD 2.79 trillion in 2025, USD 2.97 trillion in 2026, and reach USD 4.13 trillion by 2031, growing at a CAGR of 6.82% from 2026 to 2031.
The current expansion in the property and casualty insurance market reflects more than premium rate firming, because carriers are pricing a wider set of insured risks, including cyber events, climate-linked property damage, and supply-chain liability exposures that were less formalized in earlier cycles. Higher investment income is also supporting earnings discipline, with Swiss Re projecting the United States P&C portfolio yields at 4.2% in 2026, up from 3.9% in 2024, giving insurers more room to compete on price while protecting returns. Secondary perils are shaping the next phase of the property and casualty insurance market, with wildfires, severe convective storms, and floods accounting for 92% of the USD 107 billion in global insured natural catastrophe losses in 2025, while insured nat-cat losses stayed above USD 100 billion globally for the sixth straight year. This pattern is shifting more frequency loss back to primary carriers and raising the importance of underwriting precision, portfolio diversification, and disciplined catastrophe selection across the property and casualty insurance market. Verisk’s modeled view reinforces that pressure, with average annual global catastrophe losses expected to exceed USD 152 billion in future years, up from a USD 132 billion five-year historical average, keeping risk pricing, claims control, and capital allocation at the center of carrier strategy.
Key Report Takeaways
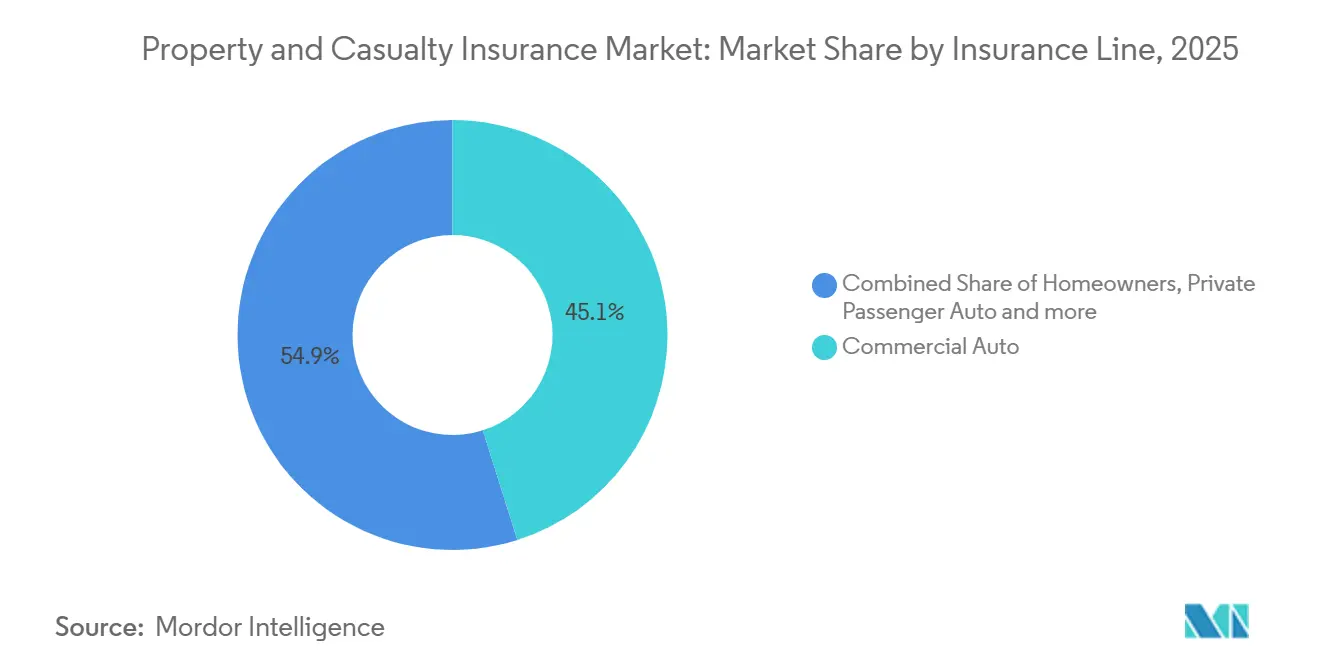
- By insurance line, commercial auto captured 45.1% of the property and casualty insurance market share in 2025, while specialty lines in the property and casualty insurance market are projected to grow at 5.5% CAGR through 2031.
- By distribution channel, independent agents and brokers accounted for 64.0% of the property and casualty insurance market in 2025, while digital and insurtech platforms are forecast to expand at a 6.3% CAGR through 2031.
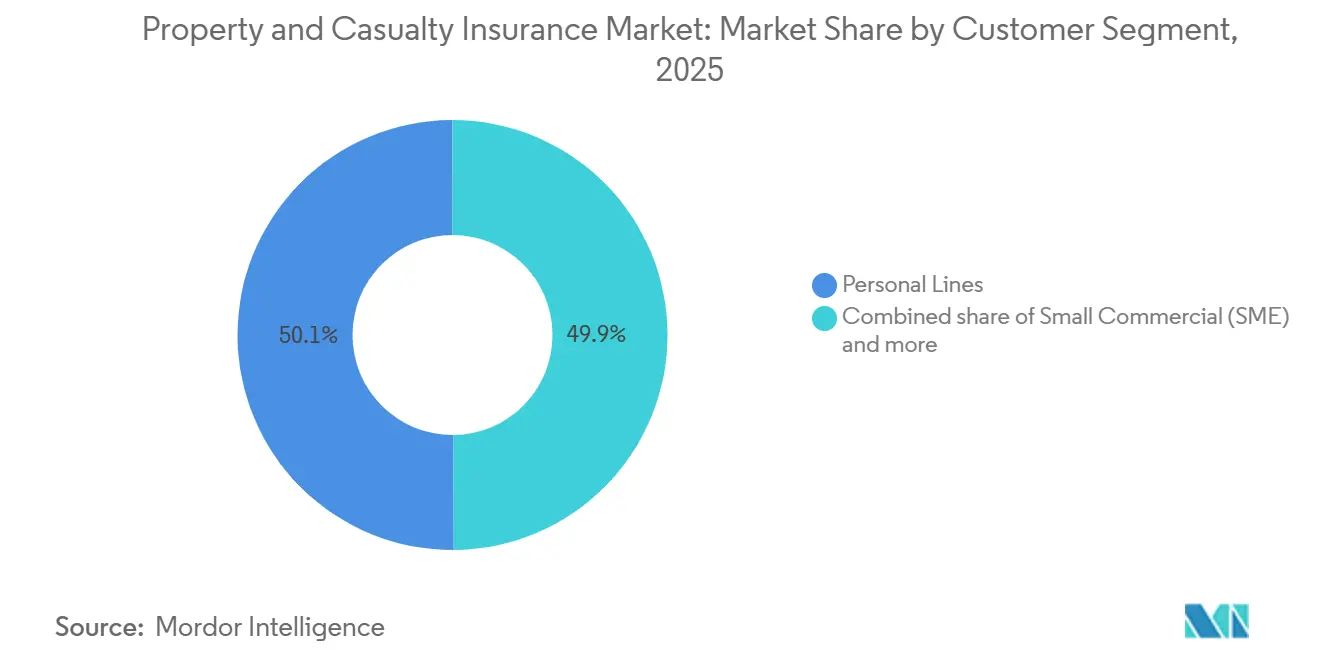
- By customer segment, personal lines held 50.1% share of the property and casualty insurance market in 2025, while small commercial and SME segments are projected to grow at a 4.5% CAGR through 2031.
- By geography, the United States held 32.1% of the property and casualty insurance market share in 2025, while Asia-Pacific's property and casualty insurance market is forecast to advance at a 7.0% CAGR through 2031, supported by Swiss Re’s 6.9% average annual real premium growth outlook for 2026-2031.
Note: Market size and forecast figures in this report are generated using Mordor Intelligence’s proprietary estimation framework, updated with the latest available data and insights as of January 2026.
Global Property and Casualty Insurance Market Trends and Insights
Drivers Impact Analysis*
| Driver | (~) % Impact on CAGR Forecast | Geographic Relevance | Impact Timeline |
|---|---|---|---|
| Telematics-Based Risk Segmentation | +1.2% | North America, spill-over to Europe and Asia-Pacific | Medium term (2-4 years) |
| Embedded Distribution Partnerships | +0.8% | Global, most active in North America and Asia-Pacific | Medium term (2-4 years) |
| Catastrophe Modeling Modernization | +0.6% | Global, concentrated in North America, Australia, Japan | Long term (≥ 4 years) |
| Claims Automation and Fraud Analytics | +0.9% | Global | Short term (≤ 2 years) |
| Capital Relief From Higher Yields | +0.5% | North America and Europe | Short term (≤ 2 years) |
| Usage-Based Commercial Fleet Pricing | +0.7% | North America, Europe, Asia-Pacific | Medium term (2-4 years) |
| Source: Mordor Intelligence | |||
Telematics-Based Risk Segmentation Rewires Auto Underwriting Economics
Telematics-based risk segmentation has moved from a pilot tool to a core source of pricing advantage in the property and casualty insurance market. Progressive’s Q1 2026 shareholder letter confirms the rollout of product model 8.3 across 16 states, using new external data sources to sharpen risk segmentation in commercial auto underwriting[1]SEC.GOV https://www.sec.gov/Archives/edgar/data/80661/000008066126000177/pgr-2026331ex99shareholder.htm. The competitive effect extends beyond a single product update, as each additional policy cycle adds more observed driving behavior and improves the quality of future pricing decisions. In commercial fleets, GEICO’s connected insurance partnership with Daimler Truck Financial Services lets eligible customers share Detroit Connect ELD data without extra hardware and offers savings of up to 10%, demonstrating how usage-based pricing is becoming more practical at the vehicle level. Cambridge Mobile Telematics also widened adoption in 2025 with DriveWell Fleet, which gives insurers normalized telematics data across connected and unconnected vehicles and reduces a long-standing data coverage gap in the property and casualty insurance market.
Embedded Distribution Partnerships Expand the Insurance Addressable Market
Embedded insurance is broadening how the property and casualty insurance market reaches customers, especially in automotive and digital commerce channels. Root and Carvana’s exclusive integration surpassed 200,000 policies in April 2026, demonstrating that point-of-sale auto insurance can reduce acquisition friction while capturing a customer at the moment an insured asset is purchased[2] INVESTORS.CARVANA.COM Root Insurance and Carvana Surpass 200,000 Policies Driven by Pioneering Embedded Insurance Partnership | Carvana. BYD’s selection of Bolttech as its preferred embedded insurance partner across 5 European markets adds manufacturer data into the pricing process and gives underwriters a more specific view of vehicle-level risk than standard tables alone. This matters because the platform, retailer, or manufacturer increasingly controls the customer relationship before a carrier does. As that model spreads, insurers in the property and casualty insurance market face a trade-off between distribution reach and margin pressure, because the carrier can become a capacity provider rather than the primary brand seen by the buyer.
Catastrophe Modeling Modernization Corrects a Decade of Secondary-Peril Under-Pricing
Catastrophe modeling modernization is becoming essential in the property and casualty insurance market because recent loss experience no longer matches older assumptions built around peak perils alone. Verisk’s 2025 global modeled catastrophe loss report places forward average annual loss at USD 152 billion, with severe thunderstorms, winter storms, wildfires, and inland floods now accounting for USD 98 billion, or 2 thirds of modeled annual loss. That shift is pushing carriers toward parcel-level exposure data, engineering-based peril models, and tighter rate adequacy reviews in homeowners and commercial property books. Insurers that still rely on broad territorial pricing are more exposed to adverse selection when better-modeled competitors can separate profitable risks from loss-heavy ones. NAIC reporting standards for wildfire and severe convective storm modeling are also reinforcing investment needs across the property and casualty insurance market, including for smaller regional insurers that may have delayed these upgrades in the past[3][3]NAIC.ORG committees-pending-action-cat-mod-primer.pdf.
Claims Automation and Fraud Analytics Compress Loss Adjustment Expense
Claims automation remains one of the fastest-return initiatives in the property and casualty insurance market because it improves both speed and claim quality simultaneously. Duck Creek’s Agentic First Notice of Loss integrates policy review, coverage verification, and early fraud detection at intake, while uncertain cases are routed to a human adjuster and routine cases move through with far less manual work[4]DUCKCREEK.COM Duck Creek Launches Insurance-Native Agentic AI Platform and Unveils New Applications to Transform Underwriting and Claims - Duck Creek. That structure changes the economics of claims operations because suspicious patterns can be flagged before they move deep into the adjustment process. It also shortens cycle times for straightforward claims, improving the customer experience without relying on blanket staffing expansion. As these tools scale, carriers in the property and casualty insurance market gain a practical way to control leakage, lower handling expense, and protect combined ratio performance.
Restraints Impact Analysis*
| Restraint | (~) % Impact on CAGR Forecast | Geographic Relevance | Impact Timeline |
|---|---|---|---|
| Secondary Peril Loss Volatility | -1.5% | North America, Asia-Pacific, spill-over to Europe | Long term (≥ 4 years) |
| Social Inflation In Liability Lines | -1.2% | United States, spill-over to Canada and Australia | Long term (≥ 4 years) |
| Legacy Core System Constraints | -0.6% | Global, most acute in North America and Europe | Medium term (2-4 years) |
| Reinsurance Attachment Pressure | -0.7% | Global | Short term (≤ 2 years) |
| Source: Mordor Intelligence | |||
Secondary Peril Loss Volatility Undermines Underwriting Predictability
Secondary peril loss volatility is putting sustained pressure on the property and casualty insurance market because these events now account for a far larger share of insured catastrophe losses than in earlier cycles. Swiss Re reported that secondary perils accounted for 92% of the USD 107 billion in global insured natural catastrophe losses in 2025, up from 59% in 2024. United States severe convective storm losses remained above USD 45 billion for the third straight year, while Munich Re estimated that the January 2025 Los Angeles wildfires produced USD 41 billion in insured losses, enough to reset pricing expectations in exposed property portfolios. The business effect is clear, because primary insurers are retaining more frequency risk while trying to keep coverage available in coastal, wildfire, and storm-prone zones. Swiss Re’s view that insured catastrophe losses are growing by 5% to 7% a year in real terms means this pressure is likely to remain a structural restraint on the property and casualty insurance market rather than a one-year disruption.
Social Inflation In Liability Lines Elevates Structural Loss Costs
Social inflation remains a major drag on the property and casualty insurance market because liability claims are becoming more severe across a wider set of industries. TransRe recorded 135 nuclear verdicts against corporate defendants in 2024, with a total value of USD 31.3 billion, which was 52% higher in frequency and 116% higher in dollar value than 2023. The same review estimated that social inflation adds 4% to 5% to primary casualty claims and 8% to 10% to excess liability claims, which shows why rate adequacy remains difficult in casualty-heavy books. Triple-I and the Casualty Actuarial Society also found that legal system abuse contributed to more than USD 230 billion in higher United States liability losses over the past decade, confirming that the issue is not limited to a single litigation cycle. For carriers writing commercial auto, general liability, and excess lines, this keeps reserve strength, pricing discipline, and claims defense strategy under constant pressure across the property and casualty insurance market.
*Our forecasts treat driver/restraint impacts as directional, not additive. The impact forecasts reflect baseline growth, mix effects, and variable interactions.
Segment Analysis
By Insurance Line: Specialty Cyber Lines Challenge Commercial Auto's Premium Leadership
Commercial Auto held 45.1% of insurance line premium in 2025, which made it the largest segment in the property and casualty insurance market share structure. That position was supported by the scale of vehicle coverage, mandatory insurance requirements, and persistent liability pricing pressure tied to severe verdict risk in trucking and ride-share exposure. Private Passenger Auto and Homeowners continued to anchor the personal side of the book, although affordability pressure is rising after multiple years of strong rate increases. Workers’ Compensation kept a stable place in the property and casualty insurance industry because payroll-linked premium adjusts with wage growth, while loss frequency remains comparatively favorable. Commercial Property has been repricing more aggressively as carriers respond to secondary-peril accumulation and to events such as the USD 41 billion insured loss from the January 2025 Los Angeles wildfires.
Specialty lines, which include cyber, marine, inland, and surety, are projected to grow at 5.5% CAGR through 2031, making them the fastest-growing insurance line in the property and casualty insurance market. Cyber remains the main growth engine, with Munich Re estimating nearly USD 15 billion in global cyber insurance premiums in 2025 and projecting that figure to reach USD 28 billion by 2030 at a 15% average annual rate. CRC Group also reported that ransomware was present in 44% of reported breaches in 2025, which highlights the gap between actual digital risk exposure and the limits carried by many mid-market buyers. Marine and Surety are also benefiting as trade patterns become more complex and infrastructure activity supports demand for cargo and performance bond coverage. Regulation is adding momentum as well, because formal cyber governance requirements are pushing more firms to assess risk and purchase protection that was previously delayed or under-scoped in the property and casualty insurance market.


By Distribution Channel: Digital Platforms Disrupt SME, Brokers Defend Complex Accounts
Independent Agents and Brokers held 64.0% of the distribution channel in 2025, which means they accounted for a leading share of the property and casualty insurance market size at the point of placement. Their position remains strong because complex commercial programs still require advice, market access, and multi-carrier structuring that digital-first tools have not fully replicated. Direct and Captive Agent channels continue to matter in retention-oriented personal lines books, although comparison tools and embedded options are making switching easier for some households. Bancassurance remains relevant in Europe and parts of the Asia-Pacific, where broader financial relationships support property and creditor-related insurance sales. This keeps the distribution structure of the property and casualty insurance market balanced between advice-led channels for complex risks and more automated channels for simple, repeatable products.
Digital and Insurtech Platforms are projected to grow at 6.3% CAGR through 2031, but the main shift is not the disappearance of brokers across the property and casualty insurance market. The Agents Council for Technology noted in its 2026 review that many direct-to-consumer insurtech models have pivoted toward supporting agents instead of replacing them, which shows that the agent channel is absorbing digital tools rather than losing relevance. The strongest change is in small commercial lines, where structured digital intake makes it possible to quote and bind standard coverage in minutes. Embedded programs such as Root and Carvana’s integration also show how digital distribution can reduce friction when a product is sold at the same time as an insured asset. Wholesale and MGA models stand to benefit as the property and casualty insurance industry shifts more specialty and underserved accounts toward faster digital placement workflows.
By Customer Segment: SME Underservice Creates the Market's Most Defensible Growth Opportunity
Personal Lines accounted for 50.1% of the customer segment mix in 2025, which made it the largest end-user group in the property and casualty insurance market. Its scale comes from mandatory auto insurance, homeowner coverage linked to mortgage lending, and the breadth of developed personal insurance systems in North America, Europe, and APAC. Large Commercial and Specialty buyers remain premium-intensive because they combine traditional insurance with captives, parametric structures, and reinsurance-backed protection strategies. Middle-Market Commercial sits between these extremes and is benefiting from better data exchange and shorter placement timelines. Even so, the property and casualty insurance market is seeing affordability pressure in lower-income personal segments, which is pushing some households toward reduced limits or narrower coverage choices.
Small Commercial, SME, is projected to grow at 4.5% CAGR through 2031 and stands out as one of the clearest expansion pools in the property and casualty insurance market. The opportunity comes from a long-standing protection gap, where many smaller firms have been underserved by the cost of traditional agency placement and paper-heavy underwriting. Structured digital intake changes that equation by capturing industry code, payroll, square footage, equipment values, and prior claims information in a way that is easier to rate and bind consistently. Better input quality can improve underwriting performance because insurers are not relying on incomplete forms or delayed back-and-forth with applicants. That is why SME growth is becoming one of the most defensible themes in the property and casualty insurance market, especially in regions where business formalization is converting first-time buyers into insured accounts.
Geography Analysis
North America held 32.1% of the global premium in 2025, giving it the largest share of the property and casualty insurance market. United States carrier performance improved materially, with Triple-I and Milliman reporting a combined ratio of 89% in 2025, the lowest level in more than 20 years. Swiss Re also noted that net investment income earned by United States property and casualty insurers reached USD 19 billion in Q1 2025, 12% above the prior-year period, helping offset underwriting volatility. North America, therefore, remains the main testing ground for pricing, telematics-led underwriting, and claims technology across the property and casualty insurance market. Canada adds stability through a more tort-constrained legal backdrop than the United States, while Mexico remains a longer-term growth opportunity as motor coverage enforcement and vehicle ownership deepen insurance demand.
Europe remains a large and mature part of the property and casualty insurance market, led by the United Kingdom, Germany, and France, where Allianz, AXA, and Zurich operate broad personal and commercial franchises. Regulatory discipline across the European Union continues to support capital adequacy and pricing oversight, even as natural hazard exposure is receiving more attention in flood-prone markets. South America is anchored by Brazil, where motor and personal accident lines support premium volume but claims cost inflation still weighs on margins. Chile and Peru remain smaller but relevant commercial markets, while Argentina’s position is constrained by macroeconomic instability that limits insurance depth.
Asia-Pacific is projected to grow significantly, with India leading the region at a 7.0% CAGR through 2031, making it one of the most dynamic parts of the property and casualty insurance market size outlook. Swiss Re’s January 2026 outlook placed India’s average annual real premium growth at 6.9% for 2026-2031, which was higher than the pace expected in China and the United States. China remains the largest market in Asia-Pacific by scale, although growth is moderating as the economy slows. Japan, Australia, and South Korea remain mature markets with strong commercial exposure, while the United Arab Emirates and Saudi Arabia are leading momentum in the Middle East and Africa through infrastructure-led demand.

Competitive Landscape
The property and casualty insurance market combines concentration in some personal auto pools with broad fragmentation across commercial specialty lines, excess and surplus markets, and many emerging economies. In the United States private auto market, State Farm and Progressive together held approximately 37% share in 2025, but the broader property and casualty insurance market remains far more dispersed across global carriers, regional insurers, MGAs, and specialist underwriters. Competitive strategy now depends less on scale alone and more on whether a carrier can improve risk selection, reduce handling cost, and reach customers through efficient channels. Progressive’s 2026 product model rollout across 16 states shows how leading carriers are using new external data to refine pricing and defend growth in auto lines. That pattern suggests the strongest positions in the property and casualty insurance market are increasingly tied to data quality and model execution rather than legacy distribution strength alone.
A second strategic front is distribution. Root and Carvana’s embedded insurance partnership surpassed 200,000 policies in April 2026, which established a clear commercial benchmark for integrating insurance into a digital vehicle purchase journey. BYD’s appointment of Bolttech across major European markets shows how manufacturers are also entering the distribution layer by using vehicle data to support more tailored underwriting. GEICO’s connected fleet program with Daimler Truck Financial Services points in the same direction, because real-time vehicle data is becoming part of both underwriting design and customer value.
Deal activity is also changing shape across the property and casualty insurance market. ACORD reported that the United States carrier deal count fell to 163 transactions in 2025, but average disclosed deal size rose to USD 1.1 billion from USD 455 million across 2015-2024, which indicates a shift toward fewer and larger transactions. That shift points to stronger interest in scale, capability, and targeted expansion rather than volume-driven acquisition programs. It also fits a competitive environment where larger carriers want to strengthen specialty products, embedded partnerships, and analytics-led operations without diluting underwriting discipline in the property and casualty insurance market.
Property and Casualty Insurance Industry Leaders
State Farm Mutual Automobile Insurance Company
Berkshire Hathaway Inc.
The Progressive Corporation
Allianz SE
AXA SA
- *Disclaimer: Major Players sorted in no particular order

Recent Industry Developments
- April 2026: ACORD released its updated Carrier Mergers & Acquisitions report, finding that the United States carrier deal count fell to approximately 163 transactions in 2025, but the average disclosed deal size rose to USD 1.1 billion, more than double the 2015-2024 average of USD 455 million, signaling a structural shift toward fewer, larger strategic acquisitions.
- April 2026: Root and Carvana announced their exclusive embedded insurance integration has surpassed 200,000 policies, representing the first deep technical integration between a national online car retailer and a digital-first auto insurer, now available across 36 states in the United States.
- March 2026: Progressive completed the rollout of product model 8.3 for commercial auto, integrating new external data sources to sharpen risk segmentation across 16 states in the United States, with its next product model expected to begin state-by-state rollout from Q3 2026.
- January 2026: Swiss Re published its India insurance outlook, forecasting 6.9% average annual real premium growth over 2026-2030, ranking India as the fastest-growing major insurance market globally, ahead of China and the United States.


Global Property and Casualty Insurance Market Report Scope
| Homeowners |
| Private Passenger Auto |
| Commercial Auto |
| Commercial Property |
| Workers' Compensation |
| General Liability |
| Specialty (Cyber, Marine, Inland, Surety) |
| Direct |
| Independent Agents / Brokers |
| Captive Agents |
| Bancassurance |
| Digital / Insurtech Platforms |
| Wholesale / MGAs |
| Personal Lines |
| Small Commercial (SME) |
| Middle-Market Commercial |
| Large Commercial and Specialty |
| North America | Canada |
| United States | |
| Mexico | |
| South America | Brazil |
| Peru | |
| Chile | |
| Argentina | |
| Rest of South America | |
| Europe | United Kingdom |
| Germany | |
| France | |
| Spain | |
| Italy | |
| BENELUX (Belgium, Netherlands, and Luxembourg) | |
| NORDICS (Denmark, Finland, Iceland, Norway, and Sweden) | |
| Rest of Europe | |
| Asia-Pacific | India |
| China | |
| Japan | |
| Australia | |
| South Korea | |
| South East Asia (Singapore, Malaysia, Thailand, Indonesia, Vietnam, and Philippines) | |
| Rest of Asia-Pacific | |
| Middle East and Africa | United Arab Emirates |
| Saudi Arabia | |
| South Africa | |
| Nigeria | |
| Rest of Middle East and Africa |
| By Insurance Line | Homeowners | |
| Private Passenger Auto | ||
| Commercial Auto | ||
| Commercial Property | ||
| Workers' Compensation | ||
| General Liability | ||
| Specialty (Cyber, Marine, Inland, Surety) | ||
| By Distribution Channel | Direct | |
| Independent Agents / Brokers | ||
| Captive Agents | ||
| Bancassurance | ||
| Digital / Insurtech Platforms | ||
| Wholesale / MGAs | ||
| By Customer Segment | Personal Lines | |
| Small Commercial (SME) | ||
| Middle-Market Commercial | ||
| Large Commercial and Specialty | ||
| By Geography | North America | Canada |
| United States | ||
| Mexico | ||
| South America | Brazil | |
| Peru | ||
| Chile | ||
| Argentina | ||
| Rest of South America | ||
| Europe | United Kingdom | |
| Germany | ||
| France | ||
| Spain | ||
| Italy | ||
| BENELUX (Belgium, Netherlands, and Luxembourg) | ||
| NORDICS (Denmark, Finland, Iceland, Norway, and Sweden) | ||
| Rest of Europe | ||
| Asia-Pacific | India | |
| China | ||
| Japan | ||
| Australia | ||
| South Korea | ||
| South East Asia (Singapore, Malaysia, Thailand, Indonesia, Vietnam, and Philippines) | ||
| Rest of Asia-Pacific | ||
| Middle East and Africa | United Arab Emirates | |
| Saudi Arabia | ||
| South Africa | ||
| Nigeria | ||
| Rest of Middle East and Africa | ||


Key Questions Answered in the Report
What is the current size of the property and casualty insurance market?
The property and casualty insurance market stands at USD 2.97 trillion in 2026 and is projected to reach USD 4.13 trillion by 2031 at a 6.8% CAGR.
Which insurance line leads premium volume?
Commercial Auto is the largest line, with 45.1% share in 2025, supported by mandatory coverage needs and sustained liability pricing pressure.
Which channel is growing fastest for policy distribution?
Digital and Insurtech Platforms are forecast to grow at 6.3% CAGR through 2031, although Independent Agents and Brokers still lead with 64.0% share in 2025.
Why are specialty lines expanding faster than other lines?
Specialty lines are growing at 5.5% CAGR because cyber, marine, inland, and surety coverage are benefiting from digital risk, supply-chain complexity, and rising compliance needs.
Which country shows the strongest growth outlook through 2031?
India has the fastest growth outlook at 7.0% CAGR through 2031, supported by Swiss Re’s 6.9% average annual real premium growth forecast for 2026-2031.
What are the main risks affecting insurer profitability?
The biggest pressures come from secondary-peril catastrophe losses and social inflation in liability lines, with 135 nuclear verdicts totalling USD 31.3 billion recorded in 2024.
Page last updated on:


