Market Overview
| Study Period | 2020 - 2031 |
|---|---|
| Forecast Data Period | 2026 - 2031 |
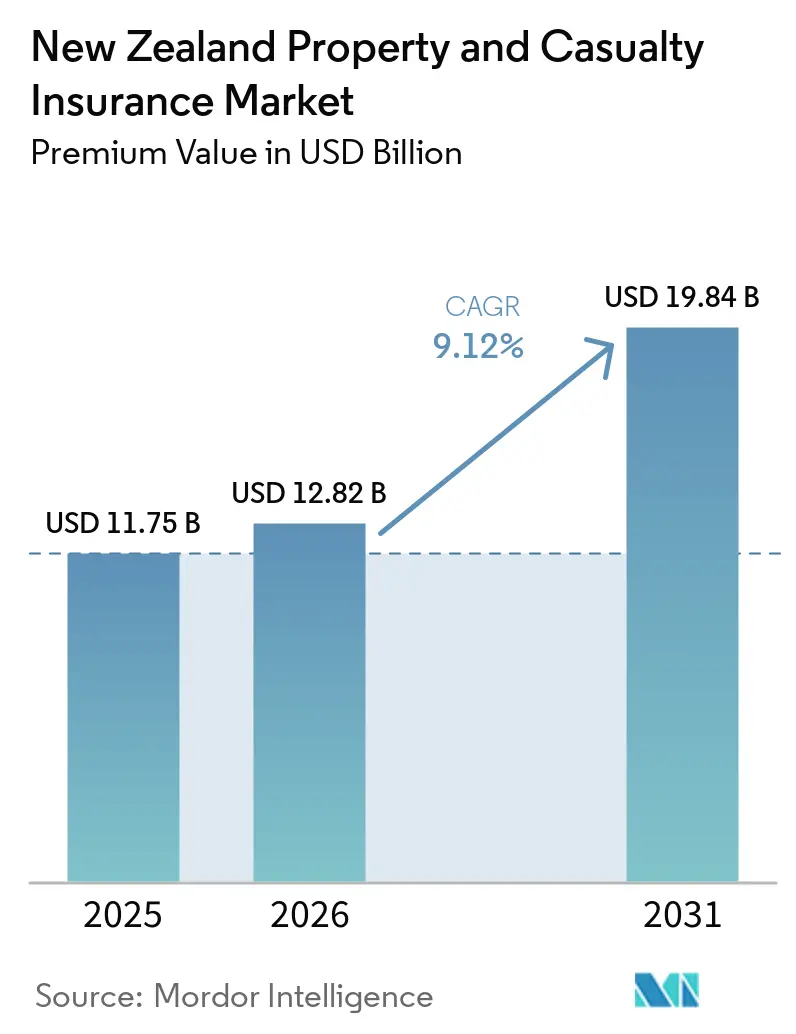
| Base Year Market Size (2025) | USD 11.75 Billion |
| Market Size (2026) | USD 12.82 Billion |
| Market Size (2031) | USD 19.84 Billion |
| Growth Rate (2026 - 2031) | 9.12% CAGR |
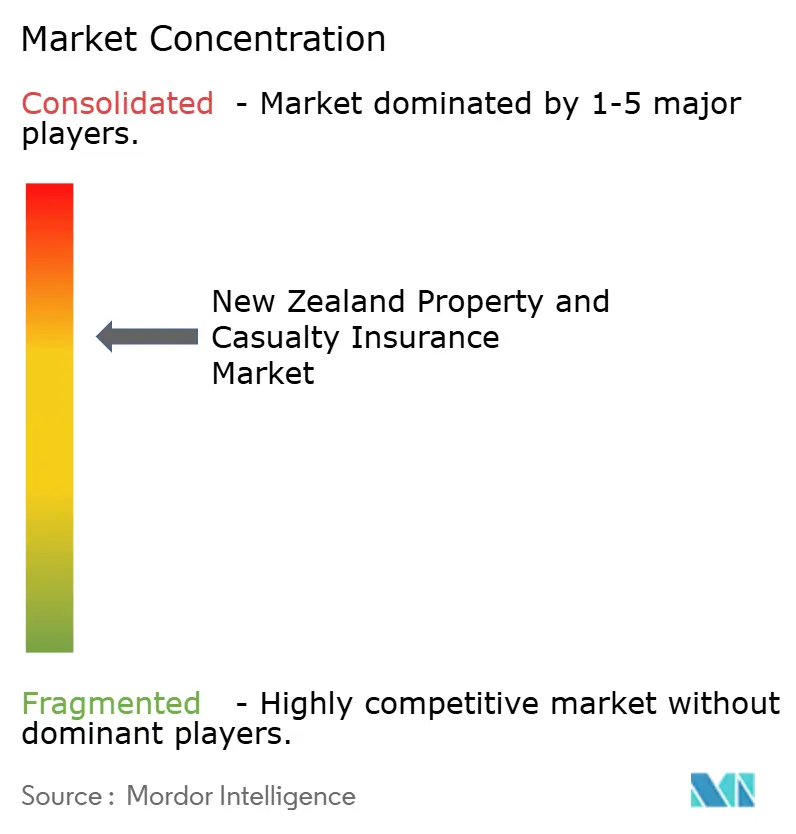
| Market Concentration | Medium |
Major Players *Disclaimer: Major Players sorted in no particular order Image © Mordor Intelligence. Reuse requires attribution under CC BY 4.0. | |
New Zealand Property and Casualty Insurance Market Analysis by Mordor Intelligence
The New Zealand Property And Casualty Insurance Market size in terms of premium value was valued at USD 11.75 billion in 2025 and is estimated to grow from USD 12.82 billion in 2026 to reach USD 19.84 billion by 2031, at a CAGR of 9.12% during the forecast period (2026-2031).
Widespread premium growth arises from rising property values, heightened climate-related losses, regulatory momentum for risk-based pricing, and rapid digital adoption across underwriting and distribution. Gross earned premiums touched USD 12.7 billion in the latest Reserve Bank insurance income statement, confirming the sector’s healthy revenue base. Reinsurance cost inflation, especially after Cyclone Gabrielle’s USD 930 million, is pushing average premium hikes of 23%. Property inflation, increased SME risk awareness, and regulatory calls for transparency position well-capitalized insurers to capture share while compelling smaller carriers to reassess pricing and capital strategies. Overall, the New Zealand property and casualty insurance market continues to demonstrate resilience despite rising catastrophe exposure and capital cost pressures.
Key Report Takeaways
- By insurance line, personal Lines led with 64.15% revenue share in 2025, while commercial lines delivered the fastest 9.41% CAGR through 2031.
- By coverage type, property captured 54.05% of the New Zealand property and casualty insurance market share in 2025; specialty & emerging coverage types are poised to expand at a 11.78% CAGR to 2031.
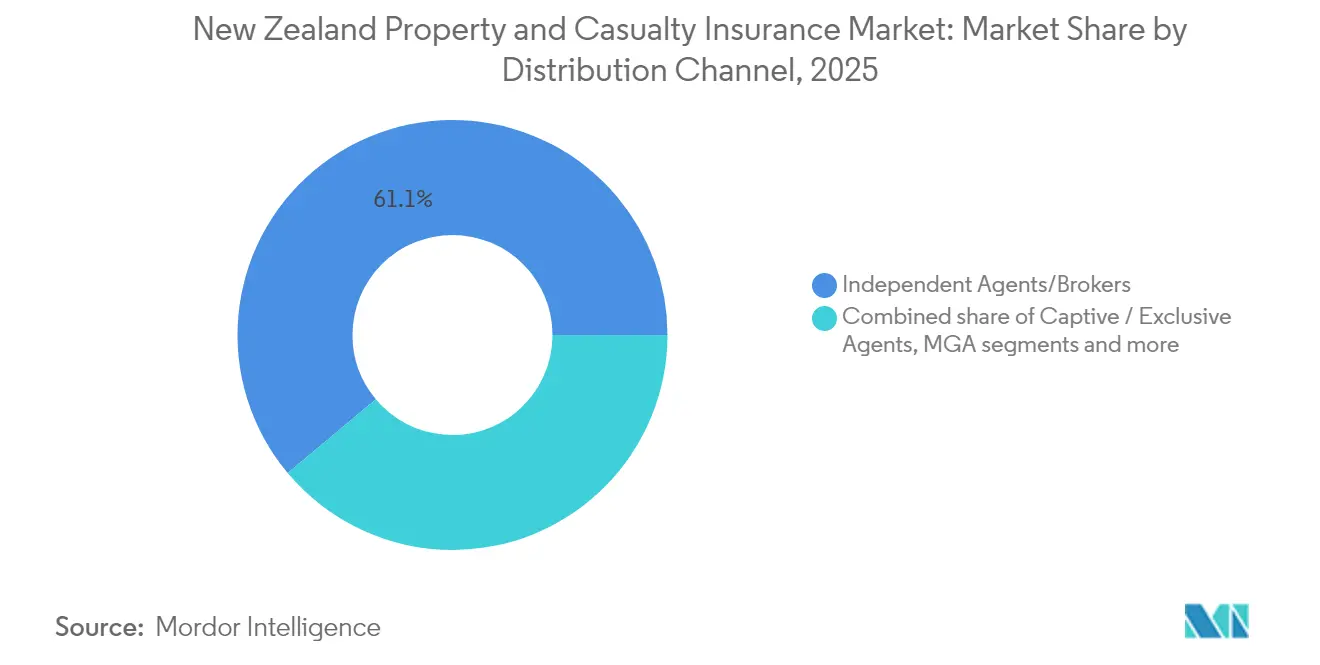
- By distribution channel, independent agents/brokers controlled 61.10% of 2025 premiums, whereas embedded/partner platforms are projected to grow at 7.45% CAGR by 2031.
- By end-user, individuals accounted for 52.55% of the New Zealand property and casualty insurance market size in 2025; large corporations are forecast to advance at 9.02% CAGR between 2026 and 2031.
- By geography, the North Island commanded 52.85% of the premium in 2025 and is set to register the quickest 7.15% CAGR through 2031.
Note: Market size and forecast figures in this report are generated using Mordor Intelligence’s proprietary estimation framework, updated with the latest available data and insights as of 2026.
New Zealand Property and Casualty Insurance Market Trends and Insights
Drivers Impact Analysis*
| Driver | ( ~ ) % Impact on CAGR Forecast | Geographic Relevance | Impact Timeline |
|---|---|---|---|
| Rising property values & construction costs | +2.1% | Auckland, Wellington, Christchurch | Medium term (2-4 years) |
| Growing insurance awareness among homeowners & SMEs | +1.8% | Urban centers nationwide | Long term (≥4 years) |
| Regulatory push toward risk-based pricing & transparency | +1.4% | National | Short term (≤2 years) |
| Increasing frequency & severity of climate events | +2.3% | Higher impact on North Island coastal regions | Long term (≥4 years) |
| Insurtech-enabled micro-coverage expansion | +0.9% | National, early adoption in major cities | Medium term (2-4 years) |
| Parametric products for agricultural & climate risks | +0.7% | Rural regions, especially South Island farming areas | Medium term (2-4 years) |
| Source: Mordor Intelligence | |||
Rising Property Values & Construction Costs
Construction-cost inflation outpaced general inflation as supply-chain bottlenecks and labor shortages took hold. The Reserve Bank’s Financial Stability Report noted residential premiums rising faster than headline CPI because higher replacement costs and reinsurance rates boosted sums insured[1]Reserve Bank of New Zealand, “Financial Stability Report May 2025,” rbnz.govt.nz. Auckland and Wellington property appreciation sustained upward premium pressure even in a softer real estate cycle. Insurers with sophisticated valuation analytics are re-pricing policies more frequently, protecting solvency while meeting contractual obligations. Dynamic sum-insured clauses are becoming common, enabling automatic cover adjustments when rebuilding indices move. Commercial developers returning post-pandemic are also driving premium volume, especially for project-specific covers and builders' policies.
Growing Insurance Awareness Among Homeowners & SMEs
COVID-19 altered business models, leaving many SMEs underinsured, a gap insurers now address through outreach and simplified digital onboarding. Government and industry programs highlighting cyber, business interruption, and liability exposures fuel rising uptake, especially in urban hubs where startups cluster. Digital brokers and direct portals reduce paperwork and enable instant quotes, bringing first-time buyers into the New Zealand property and casualty insurance market. Heightened awareness of remote-working cyber threats encourages bundled policies that combine property, liability, and cyber protection. These trends collectively add premium momentum while widening the market’s risk pool.
Regulatory Push Toward Risk-Based Pricing & Transparency
The Reserve Bank’s review of the Insurance (Prudential Supervision) Act and the incoming Conduct of Financial Institutions regime requires granular pricing that reflects underlying risk. Carriers now differentiate premiums by seismic, flood, and construction characteristics, leading to regional rate dispersion[2]New Zealand Treasury, “Monitoring of Residential Building Insurance,” treasury.govt.nz. The fair-conduct mandate compels clearer disclosures, improving consumer understanding and fostering competitive advantages for data-savvy insurers. Compliance costs weigh on smaller players, encouraging technology partnerships and capital backing from reinsurers. In tandem, Treasury oversight of home-building premiums strengthens transparency, influencing customer behavior and insurer strategy.
Increasing Frequency & Severity of Climate-Related Events
Cyclone Gabrielle and North Island floods generated insured losses topping USD 1.38 billion, underlining vulnerability[3]Artemis, “North Island flood insured loss estimate NZ$2.23bn,” artemis.bm. The Insurance Council recorded a 402% surge in severe-weather claims. Carriers are investing in catastrophe models, early-warning systems, and parametric triggers that pay swiftly after events. Swiss Re’s sigma findings underscore the shift toward mid-severity events delivering outsized losses. The Earthquake Commission boosted reinsurance to USD 5.70 billion, tempering systemic risk. Climate-resilient underwriting and parametric crop covers now form critical growth pillars within the New Zealand property and casualty insurance market.
Restraints Impact Analysis*
| Restraint | ( ~ ) % Impact on CAGR Forecast | Geographic Relevance | Impact Timeline |
|---|---|---|---|
| Catastrophic natural disasters impacting profitability | −1.9% | Seismic and flood-prone areas nationwide | Short term (≤2 years) |
| Affordability gap & data-privacy constraints | −1.2% | Coastal zones and national regulatory environment | Medium term (2-4 years) |
| Escalating reinsurance & capital costs | -1.6% | National, all insurers with international reinsurance exposure | Medium term (2-4 years) |
| Data-privacy hurdles limiting telematics & IoT uptake | -0.8% | National, with regulatory compliance requirements | Medium term (2-4 years) |
| Source: Mordor Intelligence | |||
Catastrophic Natural Disasters Impacting Profitability
Cyclone Gabrielle caused around USD 620 million in damage in Northland, with 4,000 household claims lodged. The Reserve Bank warned that the government may shoulder larger burdens in extreme events. Tower expects more reinsurance layers to trigger. Concentrated exposure in high-value urban corridors limits diversification benefits and intensifies solvency pressure when multiple perils strike in the same season. Global reinsurance markets have reacted with sharp capacity constraints and rate hikes, compressing underwriting margins.
Affordability Gap & Data-Privacy Constraints
Premium spikes, sometimes above 30% in hazard-exposed suburbs, risk under-insurance, and policy lapses. Households and small firms in coastal and seismic zones trim cover or raise deductibles, widening the protection gap. Telematics-based and IoT-enabled policies promise granular pricing but face data-governance concerns under New Zealand privacy law, slowing adoption. For insurers, lower take-up rates amid higher capital costs create adverse-selection risks, weighing on growth potential in the New Zealand property and casualty insurance market.
*Our forecasts treat driver/restraint impacts as directional, not additive. The impact forecasts reflect baseline growth, mix effects, and variable interactions.
Segment Analysis
By Insurance Line: Commercial Lines Drive Digital Innovation
Commercial Lines contributed 9.41% CAGR during 2026-2031, outpacing the overall New Zealand property and casualty insurance market. The premium volume rises alongside cyber-risk awareness and more stringent contractual liability demands. The New Zealand property and casualty insurance market size for commercial lines is projected to reach USD 7.24 billion by 2031 at the stated growth pace. Within commercial lines, cyber, professional liability, and directors & officers covers attract double-digit gains as corporates strengthen governance frameworks. Insurers embed multi-factor risk-assessment platforms, enabling dynamic limits and endorsements that respond to evolving regulatory requirements.
Personal Lines remains the revenue anchor, holding a 64.15% share in 2025 due to compulsory motor and widespread home policy penetration. Price-sensitive consumers pivot toward higher deductibles or third-party auto cover as premiums climb. Usage-based auto policies, launched through mobile apps, find traction with tech-savvy motorists. Commercial auto portfolios expand as logistics operators digitize fleets and seek telematics-linked cover. Specialty micro-covers targeting gig-economy workers and sole traders underscore the sector’s adaptability.


By Coverage Type: Property Dominance Amid Climate Pressures
In 2025, the Property sector captured 54.05% of the premium, underscoring robust homeownership rates and associated mortgage-linked insurance commitments. By 2031, the Property segment of the New Zealand property and casualty insurance market is projected to surpass USD 10.7 billion, growing at an almost 9.68% CAGR. Catastrophe-induced rate hikes, adaptive sum-insured clauses, and detailed risk-based pricing drive growth. Insurers utilize advanced flood and earthquake models for portfolio segmentation, leading to regional variations in premiums and incentives for risk mitigation. Additionally, the increasing frequency of natural disasters and regulatory emphasis on risk management are compelling insurers to adopt innovative underwriting practices and enhance their claims management processes.
Specialty & Emerging lines, spearheaded by parametric earthquake products, weather-index covers for agriculture and cyber add-ons, are the fastest-growing segment, expanding at a 11.78% CAGR. These products address specific and evolving risks, offering tailored solutions to niche markets. As awareness of litigation rises, Casualty/Liability lines experience steady single-digit growth, driven by heightened legal scrutiny and the growing need for businesses to safeguard against potential liabilities. To enhance client retention and simplify placements, insurers are bundling public liability with property coverage for SMEs. This bundling strategy not only streamlines the insurance process but also strengthens long-term relationships with clients. Ongoing infrastructure initiatives and housing redevelopment are bolstered by construction-related builders and warranty covers, which play a critical role in mitigating risks associated with large-scale projects and ensuring compliance with regulatory standards.
By Distribution Channel: Digital Transformation Accelerates
In 2025, Independent Agents/Brokers held a dominant 61.10% share, reflecting the intricate risk landscape of New Zealand. The Embedded/Partner Platforms channel, growing at a robust 7.45% CAGR, seamlessly weaves insurance into mortgage, real estate, and e-commerce transactions, appealing to customers who prioritize convenience. While direct online sales see a rise in personal lines, auto, and travel sectors, brokers continue to play a crucial role in commercial placements. The hybrid distribution models in the New Zealand property and casualty insurance market allow advisers to utilize insurer portals for immediate quotes and e-signatures, effectively streamlining the sales process.
Managing General Agents are broadening their reach by channeling specialty capacities from global reinsurers into localized niches, including marine cargo and professional indemnity. These agents play a pivotal role in bridging the gap between global reinsurers and local markets, offering tailored solutions to meet specific regional needs. Bancassurance is under the microscope of the Conduct of Financial Institutions regime, leading banks to fine-tune their advisory and commission frameworks. This regulatory scrutiny is driving banks to adopt more transparent practices and enhance customer trust. On the tech front, insurtech brokers are experimenting with AI-driven recommendation systems, enabling them to cross-sell diverse covers using singular data input. These advancements in technology are improving operational efficiency and enhancing the customer experience by providing personalized insurance solutions.
By End-User: Large Corporations Lead Growth
In 2025, individuals accounted for 52.55% of the premiums. This group splits between affluent households opting for comprehensive all-risks coverage and budget-conscious families trimming back on add-ons to manage costs. The individual segment continues to dominate the market, driven by the increasing awareness of insurance benefits and the availability of customizable policies catering to diverse needs. Large corporations, driven by the complexities of regulatory compliance and cyber threats, are witnessing a 9.02% CAGR, underscoring their demand for tailored solutions. By 2031, corporates' share in New Zealand's property and casualty insurance market is set to approach 28.6%, closing the gap with individual buyers as businesses increasingly prioritize risk management and operational resilience.
While SMEs remain underinsured, they present a promising opportunity as digital onboarding and modular products bridge affordability and coverage gaps. The adoption of technology in the insurance process is expected to further ease access for SMEs, enabling them to address their unique risks effectively. Amid rising governance expectations, public sector agencies and non-profits are embracing more extensive liability programs to ensure compliance and mitigate potential risks. As climate variability increasingly influences cash-flow planning, micro-enterprises, especially in agriculture and tourism, are expected to boost their uptake of parametric weather insurance. This shift is likely to be supported by growing awareness of climate risks and the development of innovative insurance products tailored to the needs of small-scale operators.
Geography Analysis
North Island accounted for 52.85% of premium in 2025 and is set to post a 7.15% CAGR through 2031. Auckland’s booming property values elevate sums insured, while Wellington’s seismic profile drives sophisticated commercial property underwriting. Recent North Island floods and Cyclone Gabrielle produced insured losses above USD 1.38 billion, reinforcing catastrophe-risk awareness. Rate differentiation by postcode widens as carriers incorporate flood and soil-instability data into pricing models. The New Zealand property and casualty insurance market in North Island gains incremental volume from embedded covers bundled with urban apartment developments and fintech lending apps.
South Island represents 47.15% of the 2025 premium, aided by agricultural and tourism economies. FMG’s deep rural footprint and shift to Guidewire Cloud position it to scale parametric and climate-index products. Christchurch’s post-quake rebuilding continues to influence national building codes and insurer loss-mitigation strategies. The alpine climate brings flood and snowfall exposures that differ from North Island cyclones, prompting region-specific deductible structures. Rural corporates adopt weather-index covers to hedge milk price and pasture risks, boosting Specialty-line momentum.
Inter-island contrasts extend to distribution. Brokers have a firmer grip in rural South Island, while digital channels penetrate Auckland and Wellington faster. Treasury monitoring shows premium declines in seismic zones such as Wellington after risk-based pricing refinements, whereas flood-prone low-elevation suburbs face double-digit increases. Government debates around managed retreat from high-risk coastal areas may reshape future demand. Collectively, regional nuances anchor the diversified growth of the New Zealand property and casualty insurance market.
Competitive Landscape
The market shows a moderate concentration. In 2025, IAG New Zealand tops the chart with the highest gross written premium and insurance profit, solidifying its leadership position. Following closely are Suncorp’s Vero, AA Insurance (a joint venture with Suncorp), Tower, FMG, and niche players like Delta and Ando. FMG boasts a robust loyalty base with 70,000 rural members and a B Corp certification, which strengthens its competitive advantage. Meanwhile, Tower's cloud-native core system captures a 60% share of digital new business, significantly accelerating customer acquisition and enhancing operational efficiency.
Strategic maneuvers highlight a technological shift across the market. IAG's introduction of FRISS claims analytics boosted productivity by 47%, showcasing the potential of advanced analytics in streamlining claims processes. FMG's transition to Guidewire Cloud enhances its event-response capabilities, enabling it to better manage large-scale events and improve customer service. International players intensify the competition: Nippon Life's takeover of Resolution Life Asia birthed Acenda, injecting new capital into the life and general partnership arena and expanding the competitive landscape; Market Lane Insurance Group debuted an underwriting agency in Christchurch, further diversifying the market. Insurtech Cove's partnership with Greenlight Reinvestment underscores the growing investor interest in digital MGAs, reflecting a broader trend toward digital transformation in the insurance industry.
Reinsurance trends shape market strategies and influence operational decisions. The Earthquake Commission's impressive ~USD 5.7 billion reinsurance tower sets a standard for private carriers, providing a benchmark for risk management. However, global rate hardening poses challenges for smaller entities, pressuring them to adapt or explore alternative strategies. Some corporations are turning to captives, self-funding beyond primary covers, a trend that risk advisers are closely watching as it gains traction. While larger players gain an edge with CoFI compliance due to their scale and resources, smaller mutuals are contemplating partnerships or mergers to distribute governance costs and remain competitive. Innovations are molding the future of New Zealand's property and casualty insurance market in parametric triggers and embedded covers, which are increasingly seen as critical drivers of product differentiation and customer engagement.
New Zealand Property and Casualty Insurance Industry Leaders
IAG New Zealand Ltd
Suncorp Group – Vero Insurance NZ Ltd
Tower Ltd
FMG Insurance Ltd
AA Insurance Ltd
- *Disclaimer: Major Players sorted in no particular order

Recent Industry Developments
- February 2025: PPS Mutual, aimed to expand its presence into the New Zealand market, appointed William Lynch as CEO and Len Elikhis as COO. These appointments are subject to approval from the Reserve Bank as the company awaits the necessary licensing to commence operations.
- January 2025: Envest Group acquired a stake in a local managing general agent, highlighting its strategic focus on strengthening its position in the market. This move reflects the ongoing trend of consolidation within the intermediary segment as companies aim to enhance their competitive edge.
- January 2025: Protecta completed its rebrand to Assurant and launched Assurant Vehicle Care across the Asia-Pacific region. This initiative marks a significant step in expanding its product offerings and reinforcing its brand presence in the region.
- December 2024: Nippon Life agreed to acquire Resolution Life Australasia and 20% of MLC Life, creating the new Acenda brand er. RBNZ and FMA, including CoFI adjustments, were announced.


Research Methodology Framework and Report Scope
Market Definitions and Key Coverage
Our study defines the New Zealand property and casualty (P&C) insurance market as all gross written premium generated by licensed domestic and foreign carriers across personal and commercial property, motor, liability, marine and aviation, and emerging specialty covers, regardless of distribution channel, expressed in nominal U.S. dollars. We align with Reserve Bank reporting conventions that net out goods and services tax and EQC charges.
Scope exclusion: standalone workers compensation accident cover written by ACC, plus life and health insurance, are left outside this analysis.
Segmentation Overview
- By Insurance Line (Value)
- Personal Lines
- Private Passenger Auto
- Homeowners
- Personal Liability/Umbrella
- Other Personal
- Commercial Lines
- Commercial Property
- Commercial Auto
- General Liability
- Workers’ Compensation
- Specialty Lines
- Cyber
- Marine & Aviation
- Professional Liability
- Construction / Engineering
- Directors & Officers
- Personal Lines
- By Coverage Type (Value)
- Property
- Casualty / Liability
- Specialty & Emerging
- By Distribution Channel (Value)
- Independent Agents / Brokers
- Captive / Exclusive Agents
- Direct Response & Online
- Bancassurance & Affinity
- Managing General Agents (MGA) / Wholesalers
- Embedded / Partner Platforms
- By End-User (Value)
- Individuals
- Micro & Small Businesses
- Mid-Market Enterprises
- Large Corporations
- Public Sector & Non-Profits
- By Geography (Value)
- North Island
- South Island
Detailed Research Methodology and Data Validation
Primary Research
Mordor analysts interviewed underwriting heads at nationwide carriers, senior brokers across Auckland, Wellington, and Christchurch, a reinsurer treaty lead, and risk consultants. Their on-ground perspectives on rate hardening, retention shifts, and embedded insurance uptake adjusted desk assumptions and closed data gaps.
Desk Research
We began with five-year premium and claims series from Reserve Bank J10/J20 tables, Insurance Council dashboards, Statistics NZ dwelling starts, and Treasury climate loss summaries. Company filings, 10-Ks, and director presentations added carrier level color, while Dow Jones Factiva and D&B Hoovers supplied news flow and financial intelligence that sharpened exposure trends. The sources named are illustrative; numerous other public datasets informed individual line items.
Market-Sizing and Forecasting
We establish the 2024 baseline through a top down reconstruction of gross written premium from regulator filings, adjusted for off-scope products, then translated into USD. Bottom up checks, carrier segment disclosures, sampled average premium times policy counts, and broker channel audits temper single source bias. Key model variables include dwelling completions, light vehicle fleet growth, CPI adjusted repair costs, reinsurance rate indices, catastrophe frequency, and regulatory deductibles. A multivariate exponential smoothing model projects premiums to 2030, with scenario overlays capturing climate event volatility. Where bottom up detail is thin, calibrated loss ratio proxies from expert interviews fill the gaps.
Data Validation and Update Cycle
Outputs face variance testing against historical loss ratios and solvency margins, followed by a peer review. Any anomaly triggers re contact of sources. Reports refresh each year, with interim updates when material events alter the outlook.
Why Mordor's New Zealand Property and Casualty Insurance Baseline Stands Firm
Published estimates often differ because firms vary in scope, currency treatment, refresh cadence, and earthquake levy handling.
By segmenting consistently, refreshing annually, and blending top down with selective bottom up corroboration, we provide a steadier yardstick.
Benchmark comparison
| Market Size | Anonymized source | Primary gap driver |
|---|---|---|
| USD 11.75 bn (2025) | Mordor Intelligence | - |
| USD 7.10 bn (2025) | Global Consultancy A | Omits specialty lines and embedded covers; high level surveys only |
| NZD 10.79 bn (2024) | Industry Association B | Raw GWP, no currency normalization or catastrophe adjustment |
Scope trims and data lags compress totals by up to one third; Mordor's disciplined variable set and frequent reviews deliver the balanced, transparent baseline decision makers can rely on.


Key Questions Answered in the Report
What is the current size of the New Zealand property and casualty insurance market?
The market stands at USD 12.82 billion in 2026 and is projected to grow to USD 19.84 billion by 2031 at a 9.12% CAGR.
Which segment is growing fastest within the New Zealand property and casualty insurance market?
Specialty & Emerging coverage types, including parametric and cyber products, are expanding at a 11.78% CAGR through 2031.
How have recent climate events affected insurance premiums in New Zealand?
Catastrophe losses from Cyclone Gabrielle and North Island floods pushed average premiums up by 23% and more than 30% in some high-risk areas.
What distribution channels are gaining traction in the New Zealand property and casualty insurance market?
Embedded and partner-platform channels are growing at 7.45% CAGR as insurers integrate cover within real-estate and fintech journeys.
How is regulation influencing pricing strategies?
The Reserve Bank’s push for risk-based pricing and the Conduct of Financial Institutions regime require premiums to mirror specific flood, seismic, and construction risks, leading to sharper regional rate differentiation.
Page last updated on:


