Market Overview
| Study Period | 2020 - 2031 |
|---|---|
| Forecast Data Period | 2026 - 2031 |
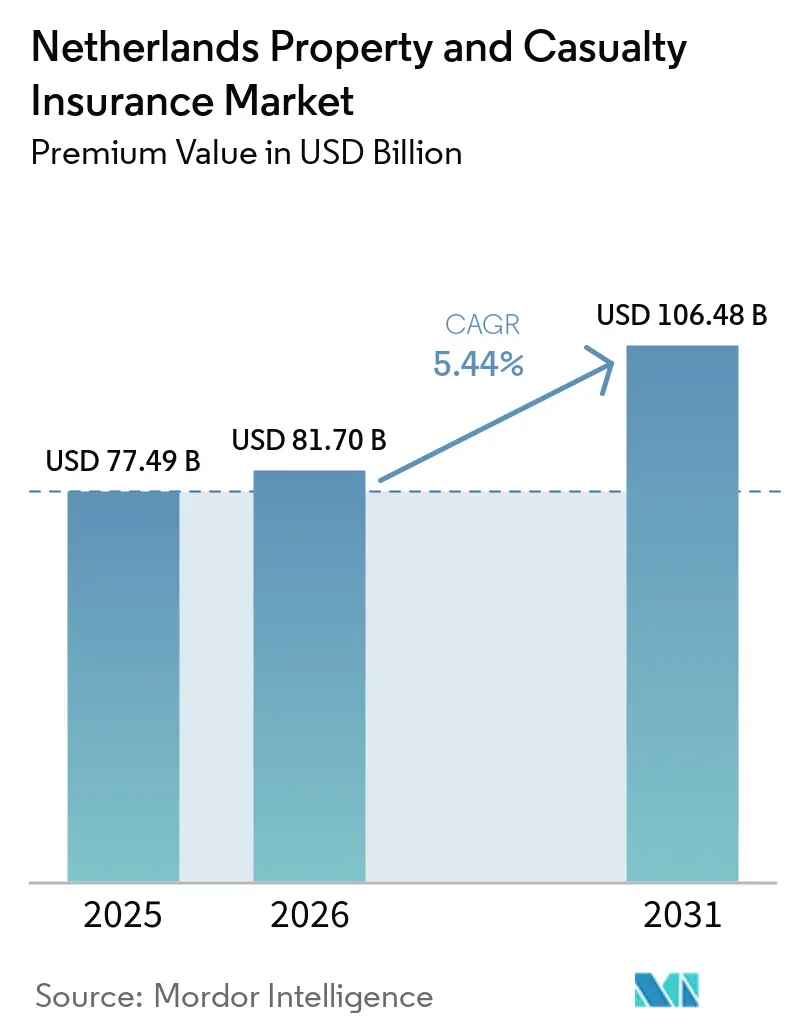
| Base Year Market Size (2025) | USD 77.49 Billion |
| Market Size (2026) | USD 81.70 Billion |
| Market Size (2031) | USD 106.48 Billion |
| Growth Rate (2026 - 2031) | 5.44% CAGR |
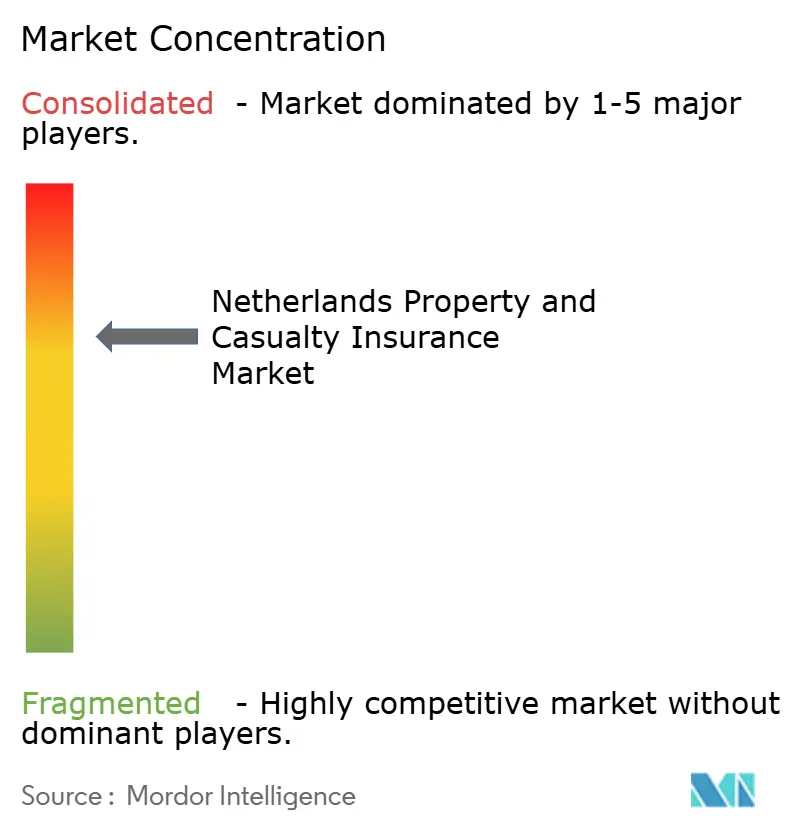
| Market Concentration | Medium |
Major Players *Disclaimer: Major Players sorted in no particular order Image © Mordor Intelligence. Reuse requires attribution under CC BY 4.0. | |
Netherlands Property and Casualty Insurance Market Analysis by Mordor Intelligence
The Netherlands Property And Casualty Insurance Market size in terms of premium value is projected to expand from USD 77.49 billion in 2025 and USD 81.70 billion in 2026 to USD 106.48 billion by 2031, registering a CAGR of 5.44% between 2026 to 2031.
Stable premium growth reflects continued demand for mandatory motor cover, resilient homeowners' spending, and expanding commercial activity that fuels corporate risk transfer needs. Digital operating models, mandated sustainability disclosures, and greater climate-related loss experience now shape product design, underwriting standards, and capital allocation. Insurers channel investment toward automation, telematics, and predictive risk analytics to defend margins as claims inflation follows rising repair costs and more frequent extreme-weather events. Regulatory clarity around DORA and the Corporate Sustainability Reporting Directive encourages technology adoption because firms gain confidence in approved ICT control frameworks. Meanwhile, the accelerated expansion of renewable-energy, logistics, and data-centre projects unlocks fresh specialty-line opportunities for insurers able to appraise novel exposures promptly.
Key Report Takeaways
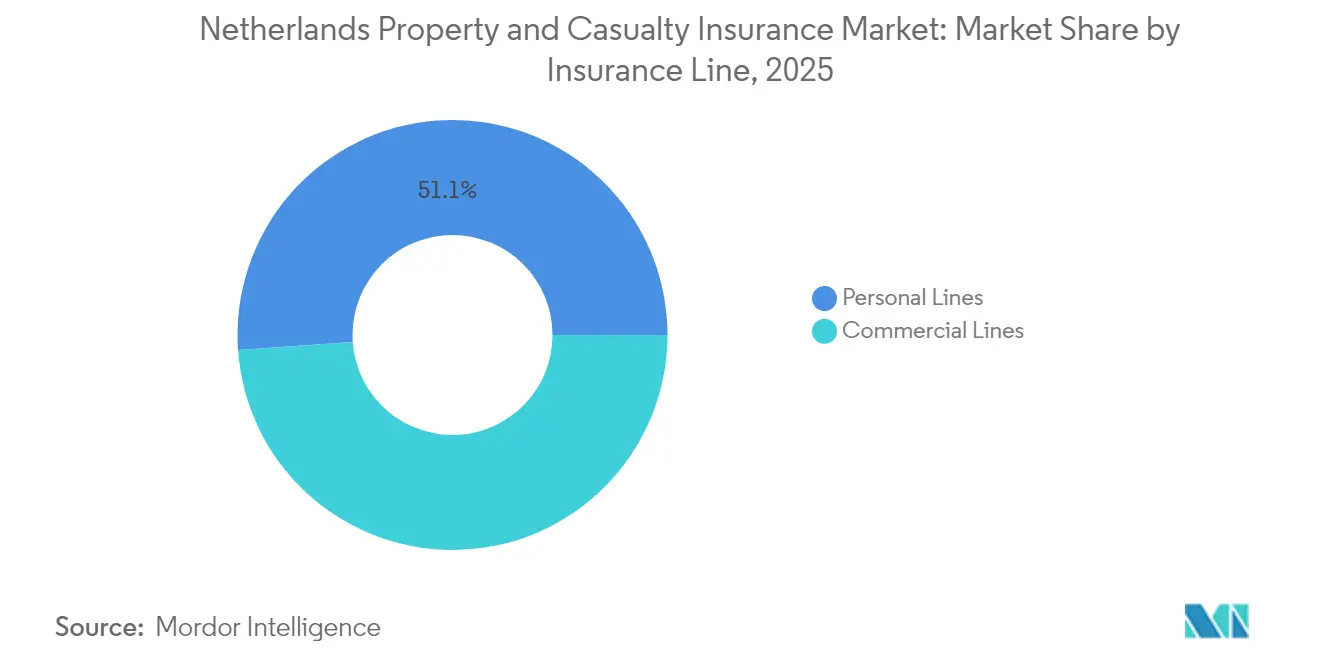
- By insurance line, personal lines led with 51.12% revenue share in 2025, whereas commercial lines are advancing at a 5.61% CAGR to 2031.
- By coverage type, property business commanded 53.92% of the Netherlands property and casualty insurance market share in 2025, while specialty and emerging lines are forecast to expand at a 6.54% CAGR through 2031.
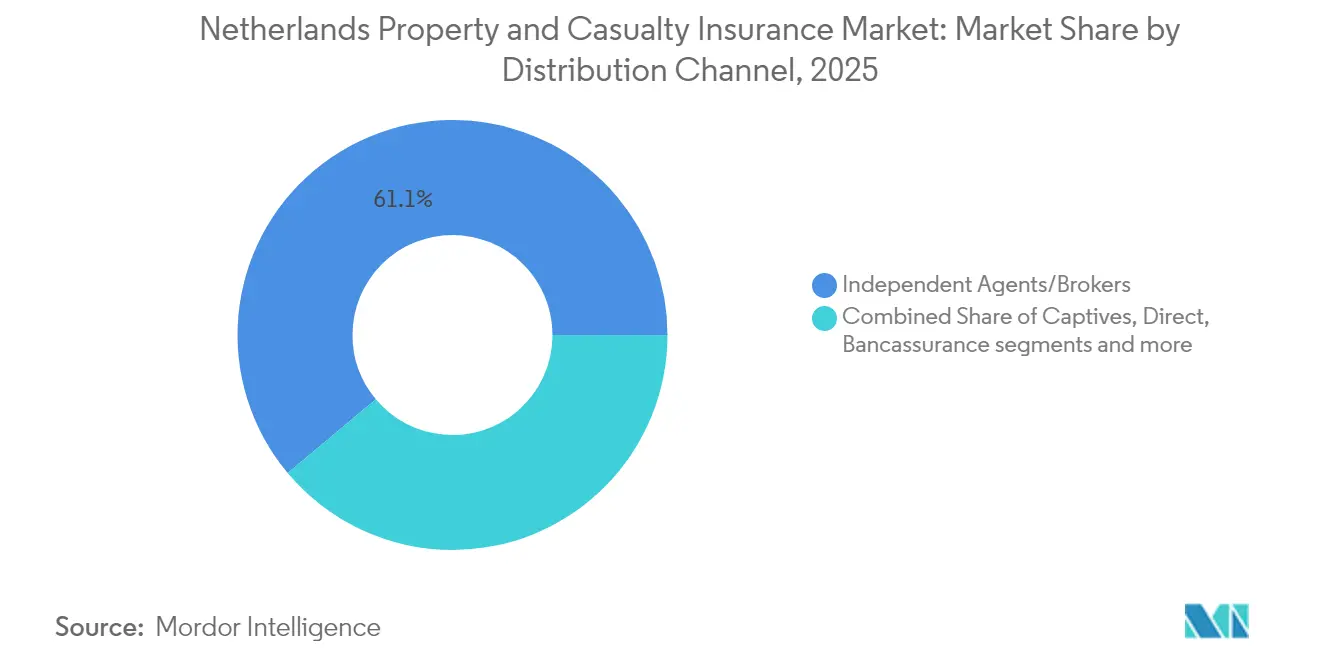
- By distribution channel, independent agents and brokers held a 61.10% share in 2025; embedded and partner platforms recorded the fastest 4.43% CAGR through 2031.
- By region, the Randstad hub accounted for 52.78% of 2025 premium volume; North Netherlands posts the highest 4.71% CAGR, supported by renewable-energy and agritech development.
- By end-user, individual consumers represented 52.64% of written premiums in 2025, whereas large corporations are growing at 6.59% CAGR on more complex compliance and cyber exposures.
Note: Market size and forecast figures in this report are generated using Mordor Intelligence’s proprietary estimation framework, updated with the latest available data and insights as of 2026.
Netherlands Property and Casualty Insurance Market Trends and Insights
Drivers Impact Analysis*
| Driver | ( ~ ) % Impact on CAGR Forecast | Geographic Relevance | Impact Timeline |
|---|---|---|---|
| Shift-to-digital underwriting & automated claims | +1.2% | Randstad, Utrecht first movers | Medium term (2-4 years) |
| Rapid growth of leased-vehicle fleet | +0.8% | National, Randstad business corridors | Short term (≤ 2 years) |
| Sustainability-risk disclosure spurring “green” P&C products | +0.7% | EU-wide, Netherlands early adopter | Long term (≥ 4 years) |
| Smart-home & telematics data lowering loss ratios | +0.9% | Urban households and connected fleets nationwide | Medium term (2-4 years) |
| EU cross-border e-ID enabling instant onboarding | +0.4% | Digital hubs throughout the European Union | Long term (≥ 4 years) |
| Source: Mordor Intelligence | |||
Shift-to-Digital Underwriting and Automated Claims
Insurers accelerate AI-driven risk selection and robotic claims handling that trim operating expenses by 15-20% while raising satisfaction metrics. ASR Nederland cut average property-damage settlement cycles by 40% after deploying hyper automation that fuses robotic process automation with intelligent document capture. DORA’s January 2025 go-live establishes baseline ICT-risk controls that, paradoxically, hasten digital adoption because compliance endpoints are now clear[1]Autoriteit Financiële Markten, “DORA Implementation Guidance January 2025,” afm.nl. Achmea attributed part of its 11% premium uplift in 2024 to digital direct channels that slash onboarding costs by 30% compared with broker-mediated flows. These efficiency gains free capital for new-product launches and further reinforce the Netherlands' property and casualty insurance market as a continental benchmark for technology uptake.
Rapid Growth of Leased-Vehicle Fleet
A swelling corporate-leasing sector creates a USD 2.3 billion sub-pool inside commercial auto, escalating demand for comprehensive cover that addresses ownership, duty-of-care, and electrification risks[2]ASR Nederland N.V., “2024–2026 Business Strategy,” asrnederland.nl . Vehicles equipped with advanced driver-assistance systems generate 25% more third-party claims and 44% more comprehensive claims than traditional models, complicating rating algorithms for leased fleets. The EU’s 2024 safety mandate broadens ADAS uptake, raising claims frequency before actuarial tables recalibrate. Usage-based policies powered by fleet telematics already trim low-risk driver premiums by 10-15%, but building compliant data infrastructures under DORA requires sizeable upfront spending. Insurers that master behavioural analytics stand to outpace rivals as lease portfolios expand across logistics, consultancy, and gig-economy platforms.
Sustainability-Risk Disclosure Spurring “Green” Property and Casualty Products
CSRD forces players to embed climate metrics within underwriting and asset-allocation routines from 2024 forward, intensifying demand for flood, wildfire, and transition-risk coverage[3]Achmea, “Half-Year 2024 Results Presentation,” achmea.com. Official notes climate models now inform 35% of property-pricing decisions and flag exposure to low-lying coastal zones. A Dutch flood-insurance pool, likely operational by 2025, overturns the post-1953 exclusion doctrine and could unlock a USD 840 million annual premium line. ABN AMRO pinpoints 900 neighbourhoods where adaptation costs outstrip home values, representing fertile ground for parametric flood or energy-efficiency products. Early-mover insurers can secure long-term relationships with homeowners, municipalities, and renewable-asset operators seeking climate-aligned indemnities.
Smart-Home & Telematics Data Lowering Loss Ratios
Internet-of-Things sensors detect leaks, smoke, or intrusion events and curb residential property claims by up to 25%. Telematics deployed across 60,000 Dutch freight vans lets carriers price per kilometer and reward safe braking behavior, suppressing collision losses by 12%. Embedded-insurance pilots tie smart devices to automated premium recalculations, promising 30-40% administration savings once scale materializes. Nevertheless, DORA stipulates robust third-party cyber-security audits, adding cost before the efficiency harvest matures. Insurers that navigate vendor certification swiftly will capture early reductions in combined ratios while lifting customer lifetime value.
Restraints Impact Analysis*
| Restraint | ( ~ ) % Impact on CAGR Forecast | Geographic Relevance | Impact Timeline |
|---|---|---|---|
| Escalating cyber-attack losses to insurers | –0.6% | Financial-sector hubs nationwide | Short term (≤ 2 years) |
| Prolonged low interest-rate environment | –0.4% | EU-wide portfolio challenge | Medium term (2-4 years) |
| Severe convective-storm & pluvial-flood frequency | –0.5% | Coastal and polder regions | Long term (≥ 4 years) |
| Expansion of corporate captives siphoning commercial P&C premiums | –0.3% | Large-enterprise risk programmes | Medium term (2-4 years) |
| Source: Mordor Intelligence | |||
Escalating Cyber-Attack Losses to Insurers
ENISA ranks ransomware and DDoS strikes as paramount threats, while the Allianz Risk Barometer lists cyber perils as the top global business risk for 2025. De Nederlandsche Bank warns that geopolitical tensions magnify state-sponsored intrusions targeting Dutch finance infrastructure. Mandatory DORA disclosures will hike compliance outlays by USD 52.5 to USD 105 million across the sector, yet should tighten vendor risk oversight. Higher incident frequency drives loss-ratio volatility just as corporate buyers demand larger cyber limits, compressing underwriting margins. Players that enhance segregation-of-duty protocols and invest in threat-intelligence partnerships can defend balance sheets while maintaining an appetite for high-margin SME cyber policies.
Prolonged Low Interest-Rate Environment
Despite gradual ECB rate hikes, reinvestment yields remain well below average guarantee levels, restricting investment spread and hence solvency buffers. Solvency II’s long-term guarantee measures cushion the blow, but Dutch ratios linger below the EU mean, constraining dividend flexibility and share-buyback options. Insurers thus tilt toward private credit and infrastructure debt, boosting return but also liquidity risk. Smaller mutuals struggle to source illiquid assets at scale and face elevated reinvestment pressure as redemptions rise. The scenario tempers expansion capability, potentially moderating the Netherlands property and casualty insurance market growth trajectory during rate-normalization years.
*Our forecasts treat driver/restraint impacts as directional, not additive. The impact forecasts reflect baseline growth, mix effects, and variable interactions.
Segment Analysis
By Insurance Line: Commercial Lines Accelerate Despite Personal Dominance
Personal lines held 51.12% of the 2025 premium, underpinned by mandatory motor and widespread homeowners' policies across 8.1 million dwellings. Commercial lines nonetheless chart the stronger 5.61% CAGR, signaling a broad corporate appetite for specialized risk transfer in a tightening regulatory space. Telematics-driven private auto underwriting now faces margin pressure because sensor-laden cars record higher collision severity, inflating repair costs and premium inflation by up to 20%. The Netherlands property and casualty insurance market size for commercial segments is projected to expand faster than personal cover as sustainability reporting forces businesses to insure environmental liabilities. Homeowners' portfolios benefit from the 2024 transparent no-claims regime that lifts retention by 12% and reduces manual work thanks to automatic claims-history feeds. Corporate property and liability classes ride on CSRD requirements that oblige firms to hedge transition and physical climate risk, sustaining multi-year growth.
Second-tier personal classes, including personal liability and umbrella, grow at a moderate 3–4% per year as Dutch households guard against social-media defamation suits and rising litigation costs. Travel and campervan insurance, suppressed during the pandemic, rebound above 6% as domestic leisure trips and cross-border European tourism recover. The Netherlands property and casualty insurance market now witnesses commercial auto players designing products for electrified fleets that wrap battery damage, charging-infrastructure disruption, and residual-value depreciation.


By Coverage Type: Property Strength Meets Specialty Innovation
Property insurance captured 53.92% of total premiums in 2025 due to high asset valuations concentrated in Amsterdam, Rotterdam, and The Hague. Casualty maintained roughly 30%, while cyber, climate-parametric, and professional-liability lines propelled specialty growth at a 6.54% CAGR, the fastest among all categories. Structural foundation damage, affecting 425,000 homes built on wooden piles, poses USD 14.7 to USD 24.15 billion latent claims exposure that specialty players price cautiously. The Netherlands property and casualty insurance market size for specialty cover is projected to rise at a mid-single-digit pace as parametric rainfall and soil-subsidence triggers gain acceptance. Property pricing now factors KNMI’23 precipitation scenarios, leading to 10–25% premium uplifts for coastal zip codes by 2026. Casualty lines reap demand from GDPR breach fines, cross-border e-commerce liability, and consultants’ errors and omissions programs, strengthening fee-based risk-engineering revenue.
Parametric covers tailored to greenhouse horticulture, wind-turbine downtime, and solar-panel hail impact emerge as differentiators for underwriters willing to harness high-resolution weather data. Liability players explore ESG-linked premium rebates where corporate insureds meet carbon-reduction milestones, demonstrating product innovation that binds risk transfer to sustainability outcomes. The Netherlands property and casualty insurance market share leadership of property lines is expected to narrow modestly as specialty and cyber lines capture incremental growth.
By Distribution Channel: Digital Transformation Reshapes Traditional Dominance
Independent agents and brokers retained 61.10% of the 2025 premium because complex SME and middle-market exposures still demand consultative advice. Yet embedded and partner platforms exhibit a 4.43% CAGR, reflecting insurer API investments that embed cover in e-commerce checkouts and mobility-as-a-service apps. Direct-to-consumer portals lure younger demographics with instant quotes and self-serve policy changes, siphoning commoditized motor and contents business from agents. Bancassurance channels expanded after CRR3 lowered insurance-participation risk weights, prompting ABN AMRO, ING, and Rabobank to cross-sell household and cyber protections. The Netherlands property and casualty insurance market size distributed via digital-only channels is forecast to double between 2026 and 2031 as onboarding friction contracts.
MGAs and wholesalers retain relevance for marine hull, aviation liability, and renewable project construction because capacity aggregation and specialist know-how outstrip individual carrier expertise. Captive and tied-agent networks see declining footfall, but still service affluent households that need bespoke umbrella limits, yacht cover, and fine-art insurance. Regulatory endorsement of e-ID onboarding will further erode paperwork, positioning digital intermediaries for sustained premium capture.
By End-User: Corporate Complexity Drives Premium Growth
Individuals held 52.64% of the overall premium in 2025, yet grew more slowly than corporate segments, which posted a 6.59% CAGR on complex compliance and cyber risk. Micro-SMEs benefit from packaged digital policies that slash underwriting expenses and support competitive pricing, whereas mid-market firms require multinational programs spanning transport, product liability, and overseas professional indemnity. Large corporates commission bespoke climate-risk, cyber-liability, and supply-chain disruption layers, fueling growth in the Netherlands' property and casualty insurance market. Usage-based cover attracts individual motorists who consent to telematics tracking for personalized rates, elevating retention among tech-savvy drivers. Affluent households increasingly seek excess-liability protection as social media disputes and reputation damage escalate.
Public-sector buyers grapple with data-privacy liabilities and social-housing carbon upgrades, demanding risk-engineering guidance and flexible limits. Parametric payouts tied to public-transport disruption or floodwater heights appeal to municipal budgets that value cashflow certainty. The Netherlands property and casualty insurance market share of corporate buyers will likely surpass 50% beyond 2030 if current growth differentials persist.
Geography Analysis
The Randstad conurbation contributed 52.78% of 2025 premiums because of dense population, high asset values, and concentration of multinational headquarters. Commercial demand is propelled by the presence of financial, technology, and logistics clusters that require sophisticated property catastrophe layers and global liability covers. Home prices between USD 420,000 to USD 630,000 translate into sizeable homeowners' sums-insured, while ongoing urban-renewal projects boost construction-all-risks appetite. Climate exposure stemming from sea-level rise and subsidence drives innovation in adaptive cover, including parametric surge protection policies triggered by Delta Works tide-gauge readings.
North Netherlands posts the fastest 4.71% CAGR as wind-farm clusters off the Wadden Islands and hydrogen production pilots in Groningen stimulate marine, engineering, and business-interruption demand. Precision-agriculture adoption necessitates equipment and yield cover, encouraging direct writers to offer smartphone-based quoting to combine harvesters and sensor-equipped tractors. Lower population density and competitive digital prices lure price-sensitive households, underpinning personal-lines uptake in Friesland and Drenthe.
East Netherlands grows steadily as manufacturing exports to Germany expand. Cross-border trade compels firms to secure cargo and transit cover that comply with both Dutch and German liability norms. Legacy heavy-industry zones still carry environmental-impairment risks, prompting specialist players to underwrite contamination clean-up policies. Growing agrotech hubs in Overijssel and Gelderland necessitate cyber and product-recall extensions for connected farm machinery suppliers. South Netherlands, anchored by Eindhoven’s high-tech corridor, posts stable growth driven by semiconductor supply-chain insurance and R&D property protection.
Competitive Landscape
The top five insurers captured almost two-thirds of the written premiums in 2024. ASR’s 2024 purchase of Aegon Nederland boosts its personal and commercial penetration while elevating combined-ratio efficiency targets of 92–94%. Brown & Brown’s acquisition of Quintes Holding introduces an international consolidator that augments independent-broker scale across 18 Dutch offices. Digital investment distinguishes market leaders: KPMG finds that AI-enabled players trim cost ratios 15-20%, enhancing price competitiveness compared with slower adopters.
Product innovation centers on cyber cover for SMEs, parametric climate solutions, and ESG-linked policy wording that aligns premiums with sustainability milestones. The Eurapco Alliance lets Achmea and European partners co-develop blockchain-based claims platforms and embedded-insurance APIs. Regulatory hurdles, including Solvency II capital and DORA ICT-risk audits, discourage start-ups without strong reinsurance backing, effectively sheltering incumbents. Niche specialists such as Chubb, Zurich, and HDI carve profitable pockets in marine hull, art, and life-science liability. The Netherlands property and casualty insurance market continues to attract foreign entrants via MGA partnerships that supply underwriting expertise without immediate balance-sheet exposure.
Netherlands Property and Casualty Insurance Industry Leaders
Achmea Schadeverzekeringen N.V
Nationale-Nederlanden Schadeverzekering Maatschappij N.V.
ASR Schadeverzekering N.V.
N.V. Univé Schade
Allianz Nederland Schadeverzekering NV
- *Disclaimer: Major Players sorted in no particular order

Recent Industry Developments
- January 2025: Digital Operational Resilience Act came into force, mandating annual reporting of ICT-vendor contracts and raising sector-wide compliance costs to EUR 50–100 million (USD 52.5-105 million) while elevating cyber-resilience standards.
- November 2024: Brown & Brown closed its purchase of Quintes Holding B.V., adding 700 staff and 200,000 clients to its European footprint.
- June 2024: Dutch flood-insurance pool gained regulatory backing, unlocking an EUR 800 million (USD 840 million) annual premium stream for property players.
- April 2024: Ecclesia Netherlands bought a majority in BS&F Holding, strengthening its public-sector specialism via an IT platform for low-income household services.


Research Methodology Framework and Report Scope
Market Definitions and Key Coverage
Our study defines the Dutch property and casualty (P&C) insurance market as all gross written premiums generated by licensed insurers that cover damage to assets, motor, property, marine, liability, specialty, and the related third-party injury exposures. Products sold through agents, brokers, bancassurance, direct online, embedded affinity, and MGAs are captured, and premiums are recorded in the year they are underwritten.
Scope exclusion: statutory basic health insurance and life products remain outside this analysis, as do inward reinsurance treaties.
Segmentation Overview
- By Insurance Line (Value)
- Personal Lines
- Private Passenger Auto
- Homeowners
- Personal Liability/Umbrella
- Other Personal
- Commercial Lines
- Commercial Property
- Commercial Auto
- General Liability
- Workers' Compensation
- Specialty Lines
- Cyber
- Marine & Aviation
- Professional Liability
- Construction / Engineering
- Directors & Officers
- Personal Lines
- By Coverage Type (Value)
- Property
- Casualty / Liability
- Specialty & Emerging
- By Distribution Channel (Value)
- Independent Agents / Brokers
- Captive / Exclusive Agents
- Direct Response & Online
- Bancassurance & Affinity
- Managing General Agents (MGA) / Wholesalers
- Embedded / Partner Platforms
- By End-User (Value)
- Individuals
- Micro & Small Businesses
- Mid-Market Enterprises
- Large Corporations
- Public Sector & Non-Profits
- By Region
- Randstad
- North Netherlands
- East Netherlands
Detailed Research Methodology and Data Validation
Primary Research
Our team interviewed underwriters, retail agents, fleet managers, and insure-tech platform leads across Randstad, Eindhoven, and Groningen. The conversations validated growth levers, clarified embedded insurance uptake, and supplied realistic average premium benchmarks that filled gaps left by desk research.
Desk Research
We extracted foundational data from tier-one public sources such as De Nederlandsche Bank solvency statistics, Statistics Netherlands household and motor fleet counts, the Dutch Association of Insurers' annual premium bulletins, Eurostat economic time series, and EU Solvency II quantitative reporting templates. Company filings, 10-Ks, investor decks, and reputable business press strengthened line-level insight and captured rate hardening, loss ratio, and channel shift signals. Mordor analysts complemented these with paid datasets, D&B Hoovers for carrier financials, Dow Jones Factiva for deal tracking, and Questel for emerging cyber risk patent activity, to benchmark growth pockets. This desk review built the initial premium baselines, yet the list above is illustrative, not exhaustive.
Market Sizing and Forecasting
A top-down reconstruction of 2024 national premiums by line, anchored to regulator data, is cross-checked with selective bottom-up carrier roll-ups and sampled average premium times policy count calculations. Key variables like vehicle registrations, housing starts, SME formation, storm loss frequency, and cyber incident prevalence feed a multivariate regression that projects demand, while scenario analysis adjusts for macro shocks. Assumptions are refined where bottom-up estimates diverge materially from top-down totals.
Data Validation and Update Cycle
Outputs run through variance checks, peer review, and anomaly flags; inconsistent ratios trigger call-backs to interviewees. Models are refreshed each year, with mid-cycle revisions if large loss events, rule changes, or M&A materially move the baseline. A final analyst pass ensures clients receive the freshest view before release.
Why Mordor's Netherlands Property and Casualty Insurance Baseline Commands Reliability
Published Dutch P&C figures often differ because firms pick unequal scopes, price bases, or refresh frequencies. We acknowledge those gaps up front.
Key gap drivers include inclusion of embedded premiums, treatment of specialty lines, currency conversion timing, and the cadence at which catastrophe experience resets loss ratio forecasts. Mordor's disciplined scope, annual refresh, and dual-track validation keep its estimate dependable for decision makers.
Benchmark comparison
| Market Size | Anonymized source | Primary gap driver |
|---|---|---|
| USD 77.49 B (2025) | Mordor Intelligence | |
| USD 72.67 B (2024) | Regional Consultancy A | Excludes embedded platforms and applies single scenario inflation uplift |
| USD 20.4 B (2024) | Trade Journal B | Uses only Solvency II SFCR data for large insurers; omits specialty covers |
| USD 11.07 B (2024) | Global Consultancy A | Focuses on commercial lines; personal motor and home policies excluded |
In sum, differing scopes and shortcut assumptions explain the spread. Mordor's blended evidence path and annual recalibration give users a balanced, transparent baseline that they can trace back to clear variables and repeatable steps.


Key Questions Answered in the Report
What is the current size of the Netherlands property and casualty insurance market?
The market reached USD 81.7 billion in 2026 and is projected to rise to USD 106.48 billion by 2031, reflecting a 5.44% CAGR.
Which segment is expanding fastest within the Netherlands property and casualty insurance market?
Specialty and emerging lines, notably cyber and climate-risk products, are growing at 6.54% CAGR through 2031.
How dominant are independent brokers in Dutch P&C distribution?
Independent agents and brokers held 61.10% of 2025 premium, yet embedded-insurance platforms are gaining ground with a 4.43% CAGR.
How does DORA affect Dutch insurers?
The Digital Operational Resilience Act, effective January 2025, obliges insurers to meet strict ICT-risk oversight and third-party vendor reporting, elevating compliance costs but enhancing cyber-resilience.
Page last updated on:


