Market Overview
| Study Period | 2020 - 2031 |
|---|---|
| Forecast Data Period | 2026 - 2031 |
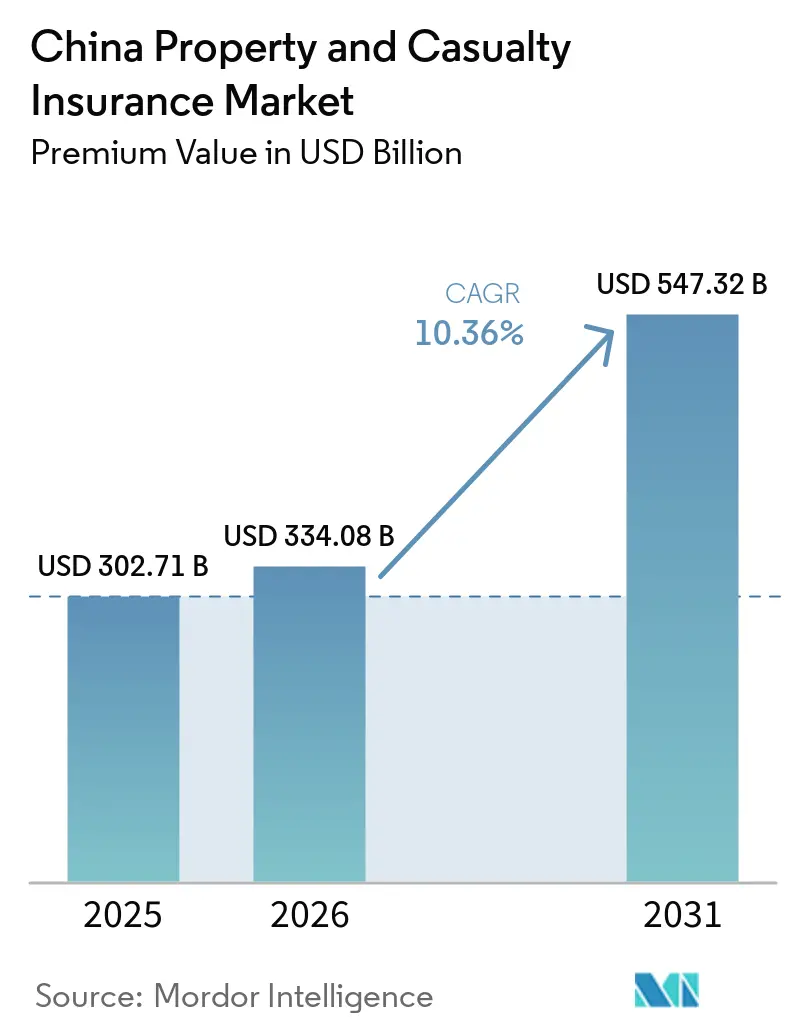
| Base Year Market Size (2025) | USD 302.71 Billion |
| Market Size (2026) | USD 334.08 Billion |
| Market Size (2031) | USD 547.32 Billion |
| Growth Rate (2026 - 2031) | 10.36% CAGR |
| Market Concentration | Medium |
Major Players *Disclaimer: Major Players sorted in no particular order Image © Mordor Intelligence. Reuse requires attribution under CC BY 4.0. | |
China Property and Casualty Insurance Market Analysis by Mordor Intelligence
The China Property And Casualty Insurance Market size in terms of premium value is expected to increase from USD 302.71 billion in 2025 to USD 334.08 billion in 2026 and reach USD 547.32 billion by 2031, growing at a CAGR of 10.36% over 2026-2031.
Motor insurance still supplies the bulk of premium volumes, yet liability, agricultural, and catastrophe lines add fresh momentum as mandates broaden and climate-linked risks escalate. Embedded distribution inside super-apps compresses acquisition cost and widens reach, while government emphasis on high-quality insurance development sustains long-run demand. Capital rules under C-ROSS II reshape balance-sheet strategies, and digital underwriting tools reshape product design, collectively reinforcing the expansion path for the China property and casualty insurance market.
Key Report Takeaways
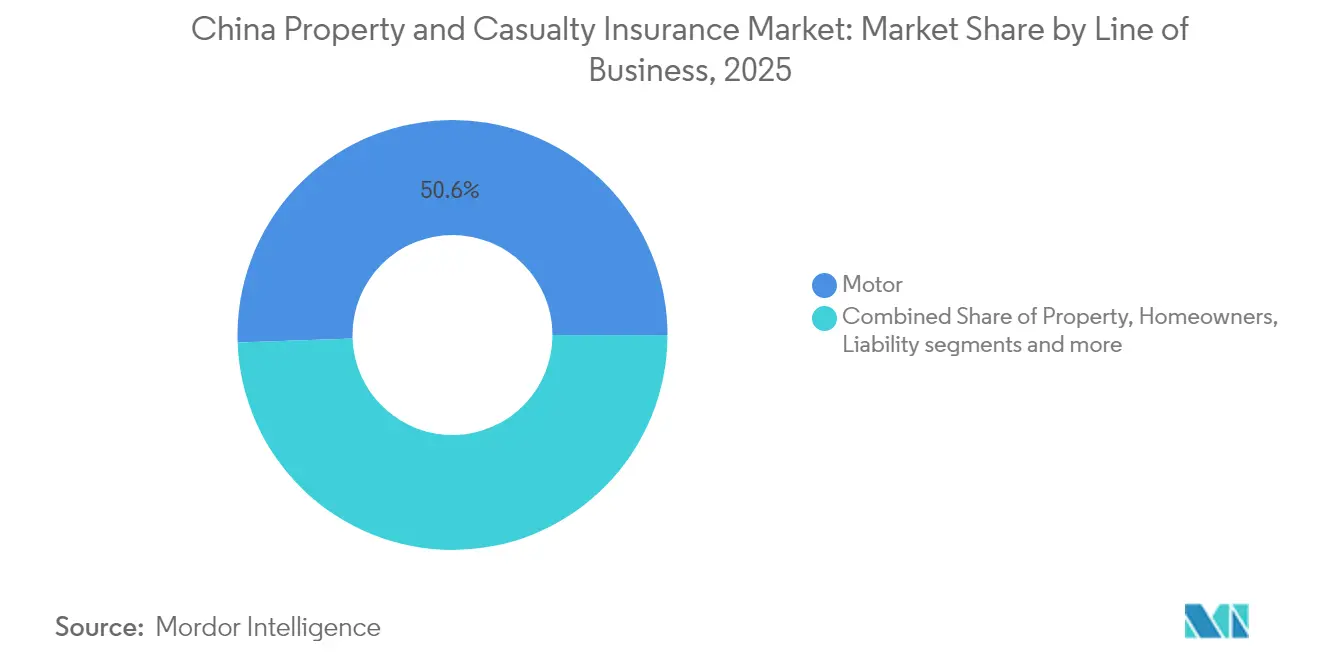
- By line of business, motor insurance accounted for 50.55% revenue in 2025, while liability insurance is forecast to grow at a 12.05% CAGR to 2031.
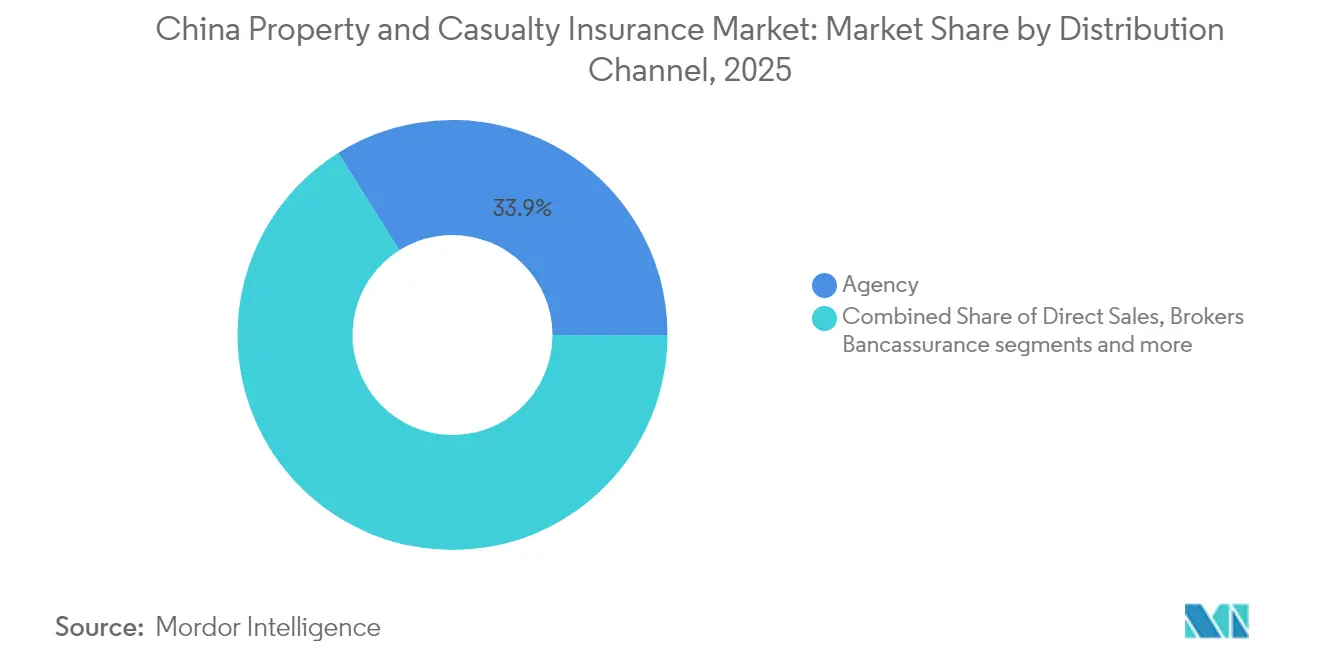
- By distribution channel, agency networks captured 33.92% of the China property and casualty insurance market share in 2025; digital platforms are advancing at an 8.58% CAGR through 2031.
- By customer type, government and state-owned enterprises supplied 32.86% of the premium in 2025; small and medium enterprises recorded the fastest gain at 6.31% CAGR to 2031.
- By region, East China contributed 35.88% of China property and casualty insurance market size in 2025, while Central China leads growth with a 5.47% CAGR through 2031.
Note: Market size and forecast figures in this report are generated using Mordor Intelligence’s proprietary estimation framework, updated with the latest available data and insights as of 2026.
China Property and Casualty Insurance Market Trends and Insights
Drivers Impact Analysis*
| Driver | ( ~ ) % Impact on CAGR Forecast | Geographic Relevance | Impact Timeline |
|---|---|---|---|
| Economic growth & rising risk-awareness | +2.8% | Nationwide; prominent in East & North China | Medium term (2–4 years) |
| Mandatory insurance expansion (auto, liability) | +2.1% | Nationwide; tier-2 & tier-3 cities | Short term (≤ 2 years) |
| Motor-vehicle parc growth | +1.9% | Central & Western provinces | Medium term (2–4 years) |
| Super-app embedded-insurance ecosystems | +1.4% | Tech hubs in East China | Short term (≤ 2 years) |
| Climate-linked catastrophe & agri-cover demand | +1.2% | National, emphasis on Central and Western agricultural zones | Long term (≥ 4 years) |
| Commercial-space launch liability needs | +0.6% | National, concentrated in space industry clusters | Long term (≥ 4 years) |
| Source: Mordor Intelligence | |||
Economic Growth & Rising Risk-Awareness
China’s macro-recovery after the 2022-2024 slowdown lifts household purchasing power, enabling more families and firms to buy coverage. A 2024 State Council directive calls for broader disaster, health, and pension protection, signalling durable policy support for the China property and casualty insurance market[1]State Council of the People’s Republic of China, “Opinions on Promoting High-Quality Development of the Insurance Industry,” gov.cn. Urbanisation boosts asset density in flood-prone localities; floods caused USD 32 billion in economic losses in 2024, yet only 5% of that total was insured, pointing to latent demand. Infrastructure tied to the Belt and Road Initiative heightens exposure to construction delays and political violence, pushing corporates toward multiperil programmes. Government-sponsored catastrophe pools such as the China Residential Earthquake Insurance Pool show public commitment to risk transfer. Despite 79% of insurance executives citing economic-slowdown worries, long-term optimism prevails because risk awareness outpaces GDP growth[2]J.P. Morgan Asset Management, “2024 China Insurance CIO Survey,” am.jpmorgan.com.
Mandatory Insurance Expansion (Auto, Liability)
Compulsory motor liability limits rose to USD 27,778 in death-and-injury cover, expanding premium intake and reinforcing near-term momentum for the China property and casualty insurance market[3]Miller Canfield, “China Expands Compulsory Motor Liability Insurance,” millercanfield.com. Claims-free drivers can now receive discounts of up to 50%, spurring intense price rivalry yet keeping penetration high. Sector-specific liability mandates, for instance, in construction and manufacturing, diversify premium sources beyond motor. New-energy vehicle (NEV) cover stands out as it already forms around 11.5% of motor premiums despite the fleet share being 4.7%. Loss ratios above 105% for household NEVs trigger actuarial refinements; proposed coefficient tweaks should give actuaries more latitude to price risk accurately.
Motor-Vehicle Parc Growth
Vehicle sales advanced 10.6% year-on-year in Q1 2024, and NEVs accounted for 30% of total deliveries, reinforcing the importance of motor insurance within the China property and casualty insurance market. Between 2009 and 2024, motor premium income rose by more than 4 times, propelled by urban mobility and rising incomes. Telematics policies reward safe drivers, but they also raise adverse-selection pressure on older pooled books. Ping An’s tie-up with FAW Hongqi, launched in 2025, brings a full-scenario intelligent-driving cover that includes automated parking and urban navigation risks. Autonomous-vehicle adoption may erode private-driver liability demand in the long term, but will spawn product niches for software malfunction and sensor failure.
Super-App Embedded-Insurance Ecosystems
Embedded distribution reshapes customer acquisition. Tencent’s WeSure leverages the 1.3 billion-user WeChat base to cross-sell life, health, and property products, while Ant Group’s Xiang Hu Bao amassed over 100 million participants by bundling mutual-aid health cover into Alipay journeys. Online written premiums ballooned drastically in the last decade, underlining the rapid digital pivot within the China property and casualty insurance market. ZhongAn’s technology export revenue climbed 40% in 2024 to USD115.1 million as traditional players license its modular underwriting engines. The regulator has adjusted rules to support online underwriting while safeguarding data privacy, balancing innovation and consumer protection.
Restraints Impact Analysis*
| Restraint | ( ~ ) % Impact on CAGR Forecast | Geographic Relevance | Impact Timeline |
|---|---|---|---|
| Price competition & margin compression | -1.8% | Nationwide; strongest in coastal provinces | Short term (≤ 2 years) |
| Tightening Solvency-II-style capital rules | -1.4% | Nationwide; larger effect on small carriers | Medium term (2–4 years) |
| Telematics-driven adverse-selection risk | -0.9% | National, concentrated in urban markets | Medium term (2-4 years) |
| Autonomous-vehicle impact on motor premiums | -0.7% | National, early adoption in tier-1 cities | Long term (≥ 4 years) |
| Source: Mordor Intelligence | |||
Price Competition and Margin Compression
Rate freedom introduced in 2024 lets players undercut rivals by up to 50% for low-claim motorists, eroding margins across the China property and casualty insurance market. Repair-part inflation and NEV battery costs keep claims severity elevated, lifting combined ratios even when volumes grow. Digital comparison portals intensify price transparency; customers switch quickly, undercutting brand loyalty. Smaller insurers often exit money-losing lines to preserve capital, concentrating risk into a few dominant players. Planned coefficient reforms could stabilise premium adequacy, yet timing remains unclear, and competition remains fierce.
Tightening Solvency-II-Style Capital Rules
C-ROSS II heightens capital charges for catastrophe and credit exposure, forcing insurers to raise USD 16.3 billion in bonds during 2024. March 2025 compliance rules further require experienced Chief Compliance Officers and granular scenario testing. Smaller insurers face disproportionate costs per premium yuan, encouraging mergers or specialist niches. A forthcoming Financial Stability Law will draw new contributions into a guarantee fund, reducing capital available for expansion but aiming to shield policyholders from insolvency shocks.
*Our forecasts treat driver/restraint impacts as directional, not additive. The impact forecasts reflect baseline growth, mix effects, and variable interactions.
Segment Analysis
By Line of Business: Motor Insurance Dominance Faces NEV Disruption
Motor insurance generated 50.55% of premiums in 2025, equal to USD 153.03 billion of China property and casualty insurance market size. Rapid NEV uptake shapes claims dynamics: household NEV combined ratios exceed 105% and commercial NEV ratios approach 200%, challenging underwriting resilience. Telematics discounts attract safer drivers, skewing risk pools, while AI-supported image recognition truncates inspection time and curbs fraud. Collision-avoidance systems lower frequency but raise parts cost, pushing actuaries to remodel loss triangles. Over the outlook, liability may shift from drivers to automakers as autonomous features mature, potentially shrinking traditional third-party premiums but opening technology-error covers. Property lines tied to transport infrastructure, such as group accident and engineering policies for charging-station networks, rise in parallel, adding diversification.
Liability insurance, recording a 12.05% CAGR to 2031, gains from compulsory schemes imposed on construction, manufacturing, and professional services firms. Construction-all-risk policies now embed environmental liability clauses to meet Belt and Road lender standards. Marine and cargo covers protect China’s export engines, while parametric offerings trialed in Shenzhen ports shorten claims cycles. Catastrophe pools underwrite flood and quake exposures, yet low penetration suggests sustained upside for the China property and casualty insurance market.


By Customer Type: Government Contracts Drive Volume Growth
Government and state-owned entities held 32.86% of the premium in 2025, driven by large transport and energy projects. Framework tenders typically bundle property, liability, and business-interruption clauses, favouring carriers with claims networks spanning all provinces. Competitive bidding compresses margins; nonetheless, the stability and scale offset pricing pressure. Large private corporations, especially in auto, electronics, and petrochemicals, demand sophisticated global programmes that include political violence and cyber endorsements.
Small and medium enterprises expand fastest at 6.31% CAGR because digital portals shorten quote-to-bind times and limit paperwork. Ping An’s ecosystem supports 242 million retail customers and lends USD 79.5 billion to micro-enterprises, creating cross-sell routes for coverages such as property-all-risk and employer liability. Individual consumers increasingly adopt add-on accident and home policies through super-apps, broadening premium origins and lifting long-tail diversification within the China property and casualty insurance market.
By Distribution Channel: Digital Platforms Challenge Agency Dominance
Agency networks still account for 33.92% of premiums, centred on personal relationships and local service for complex covers. Many agents now deploy tablet-based underwriting tools, shortening turnaround and preserving relevance. Brokers manage multinational and high-severity contracts, placing facultative layers with global reinsurers to secure capacity.
Digital platforms, however, post the highest growth at 8.58% CAGR, making them the pivotal change agent in the China property and casualty insurance market. WeSure, ZhongAn, and mutual-aid collectives integrate real-time data feeds to tailor pricing. Bancassurance thrives in rural counties with joint marketing of credit and crop covers, while direct-to-consumer portals grab share in standardised motor, travel, and gadget policies. Affinity deals with e-commerce players that embed shipping and seller liability, adding an incremental premium without extra acquisition spend.
Geography Analysis
East China produces 35.88% of premium, anchored by Shanghai’s 67-strong insurer cluster and reinsurance gateway in the Lingang free-trade zone. Dense manufacturing, global supply chains, and vibrant tech start-ups lift demand for marine, trade-credit, cyber, and liability covers. Typhoons and Yangtze flooding create recurrent catastrophe risk; only 5% of related losses were insured in 2024, highlighting the growth runway. Foreign-funded carriers build pilot products in Shanghai before rolling them nationwide, reinforcing the region’s innovation hub in the China property and casualty insurance market.
Central China posts the fastest 5.47% CAGR to 2031. Government urbanisation drives housing and commercial property projects, all requiring construction-all-risk and public liability policies. Agricultural insurance uptake accelerates on the back of precision-farming subsidies, while weather-indexed products protect against drought and flood. Belt and Road rail and highway links raise engineering premium pools and spur insurer risk-engineering services. Manufacturing growth in Henan and Hubei provinces adds employer liability and product contamination covers, strengthening the premium mix.
North China revolves around Beijing’s policy apparatus and steel industries, requiring surety and environmental-liability lines. Western China combines mining, hydropower, and solar farms; remote geographies challenge distribution, so digital channels plug the gap. Resource projects need delay-in-startup and contractor-all-risk covers, creating niche opportunities. Insurance penetration across both regions trails coastal averages, leaving room for the China property and casualty insurance market to broaden as income and awareness lift.
Competitive Landscape
The market shows moderate concentration. PICC P&C, Ping An, and China Pacific lead volumes, but the combined share of the top five carriers is more than half of the premium share, confirming space for agile challengers. PICC uses a nationwide branch grid and close government ties to secure infrastructure contracts. Ping An’s AI-driven underwriting and claims robots serve 242 million customers, underpinning cross-selling of health and property cover. China Pacific leans on marine roots to dominate export cargo and hull covers, while expanding engineering lines in Central provinces.
Digital-native ZhongAn lifted premium 24.7% in 2024 by white-labelling its policy-admin stack to incumbents, exemplifying competition on technology rather than balance-sheet heft. Foreign reinsurers increase Shanghai capacity; AXA’s rebrand of its China reinsurance unit signals broader strategic commitment. Cross-border joint ventures, such as BNP Paribas-Prudential, gain permits, injecting new actuarial techniques and enterprise-risk frameworks.
Strategic moves cluster around analytics, IoT, and ecosystem partnerships. Zhibao’s 2025 alliance with PICC and Munich Re targets middle-class medical demand, melding tech, capital, and distribution. Carriers pilot blockchain claims ledgers for agricultural cover to curb fraud and settle in days, not weeks. C-ROSS II capital rules pressure sub-scale players, raising merger chatter and potential inorganic expansion for market leaders. Catastrophe and NEV underwriting, presently loss-making, remain white-space areas for carriers able to integrate remote-sensing data and battery-health telemetry, positioning the China property and casualty insurance market for data-driven differentiation.
China Property and Casualty Insurance Industry Leaders
People's Insurance Company of China Co., Ltd
Ping An Insurance
China Pacific Insurance Company Limited
China Continent Property & Casualty Insurance Company Limited
China Life Insurance (Group) Company
- *Disclaimer: Major Players sorted in no particular order

Recent Industry Developments
- March 2025: Ping An P&C and FAW Hongqi launched an intelligent-driving insurance package covering automated parking and city navigation.
- January 2025: Zhibao Technology, PICC, and Munich Re partnered on new medical-expense products for the growing middle class.
- October 2024: AXA rebranded XL Reinsurance China to AXA International Reinsurance (Shanghai) Company.
- December 2024: NFRA released data-security guidelines specifically targeting banks and insurers. These measures enhanced cyber-risk controls across the financial sector.


Research Methodology Framework and Report Scope
Market Definitions and Key Coverage
Our study defines China's property & casualty (P&C) insurance market as the gross written premiums generated by licensed insurers on non-life lines, motor, enterprise property, homeowners, liability, marine & cargo, agriculture, engineering, credit & surety, personal accident, and other short-term health, sold to individuals, businesses, and government entities in mainland China during a calendar year.
Scope exclusion: Life, annuity, reinsurance, and offshore-written risks remain outside this frame.
Segmentation Overview
- By Line of Business
- Motor
- Enterprise Property
- Homeowners
- Liability
- Marine & Cargo
- Agriculture
- Engineering & Construction
- Credit & Surety
- Accident & Short-term Health
- Other Non-Life
- By Customer Type
- Individuals
- Small & Medium Enterprises
- Large Corporates
- Government / SOE
- By Distribution Channel
- Direct Sales
- Agency
- Brokers
- Bancassurance
- Digital Platforms / Super-Apps
- Affinity & Partnerships
- By Region
- East China
- North China
- Western
- Central
Detailed Research Methodology and Data Validation
Primary Research
Semi-structured interviews with underwriting heads, claims managers, digital broker founders, and provincial regulators across Beijing, Shanghai, Guangdong, and Sichuan helped us validate tariff shifts, embedded insurance volumes inside super-apps, and expected impacts of C-ROSS II capital buffers.
Follow-up surveys with fleet owners and SMEs clarified average premium rates and retention behavior absent in public filings.
Desk Research
We mapped historical premiums, claim ratios, capital rules, and vehicle parc statistics from tier-one public sources such as the National Financial Regulatory Administration, Ministry of Transport, China Association of Actuaries, and UN Comtrade, and then enriched them with disclosures in insurer 10-Ks, investor decks, and reputable press. Select paid databases, including D&B Hoovers for company financials and Dow Jones Factiva for deal flow, supplied granular context on underwriting portfolios and channel moves. This list is illustrative; numerous additional documents were reviewed to verify facts, reconcile breaks in time series, and capture regulatory amendments.
Market-Sizing & Forecasting
A top-down reconstruction of 2024 gross premiums, anchored on NFRA filings and regional motor vehicle counts, establishes the demand pool, which is then cross-checked against sampled supplier roll-ups of leading insurers. Key model drivers include new energy vehicle (NEV) parc growth, average motor premium per vehicle, catastrophe loss ratios, solvency ratio guidance, digital channel penetration, and mandated liability covers. Forecasts use an ARIMA framework blended with scenario analysis that adjusts for macro swings in GDP and infrastructure spending; coefficients are tuned to primary research consensus. Where bottom-up estimates for niche lines were patchy, interpolation from contiguous provinces and prudent loading factors bridged the gaps.
Data Validation & Update Cycle
Outputs undergo variance checks against solvency filings; analysts re-contact sources if deviations exceed pre-set thresholds, and a senior reviewer signs off before publication. Mordor analysts refresh the entire model annually and issue interim updates for material events such as major natural catastrophes or sudden regulatory tweaks.
Why Mordor's Chinese Property & Casualty Insurance Baseline Commands Reliability
Published estimates can differ widely because firms choose distinct product scopes, cutoff dates, and premium escalation rules. By centering on NFRA-reported premiums, layering verified NEV and liability uptake rates, and revisiting assumptions each year, Mordor Intelligence delivers a baseline clients can trace to transparent variables.
Benchmark comparison
| Market Size | Anonymized source | Primary gap driver |
|---|---|---|
| USD 302.71 B | Mordor Intelligence | - |
| USD 267.27 B | Global Consultancy A | Omits embedded insurance premiums and uses 2023 exchange rates without inflation rebasing |
| USD 242.12 B | Industry Association B | Narrows scope to motor, property, and marine lines, excluding accident and short-term health premiums |
The comparison shows that divergent scopes and static pricing explain most disparities; by contrast, our model blends full-line coverage, live exchange rates, and dynamic premium trajectories, making our numbers the dependable starting point for strategic planning.


Key Questions Answered in the Report
How fast is the China property and casualty insurance market growing?
It is projected to expand from USD 334.08 billion in 2026 to USD 547.32 billion by 2031, reflecting a 10.36% CAGR.
Which line of business offers the highest growth potential?
Liability insurance, forecast to grow at 12.05% CAGR to 2031, leads due to broadened compulsory-cover rules across construction, manufacturing, and professional sectors.
Why are new-energy vehicles challenging underwriting margins?
Repair and battery-replacement costs push NEV combined ratios above 105%, while strict rate caps limit price adjustments, squeezing profitability.
What role do super-apps play in distribution?
Platforms such as WeChat and Alipay embed personalised policies into day-to-day digital journeys, enabling digital channels to grow at an 8.58% CAGR and reduce acquisition cost.
Page last updated on:


