Market Overview
| Study Period | 2020 - 2031 |
|---|---|
| Forecast Data Period | 2026 - 2031 |
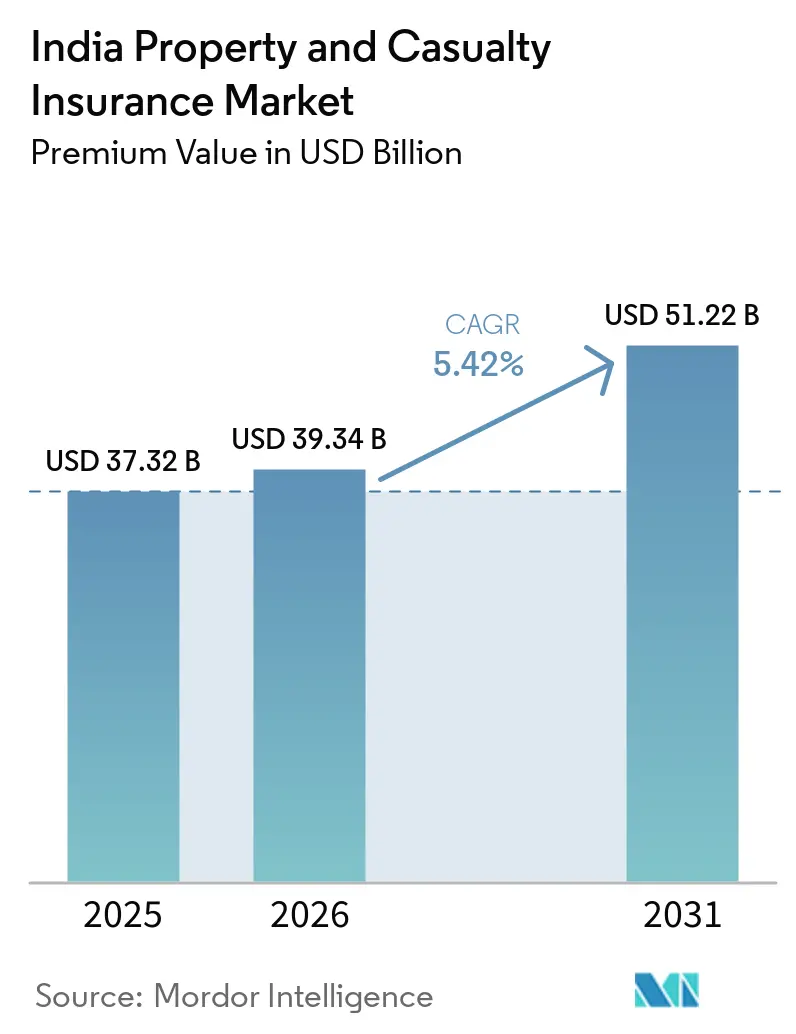
| Base Year Market Size (2025) | USD 37.32 Billion |
| Market Size (2026) | USD 39.34 Billion |
| Market Size (2031) | USD 51.22 Billion |
| Growth Rate (2026 - 2031) | 5.42% CAGR |
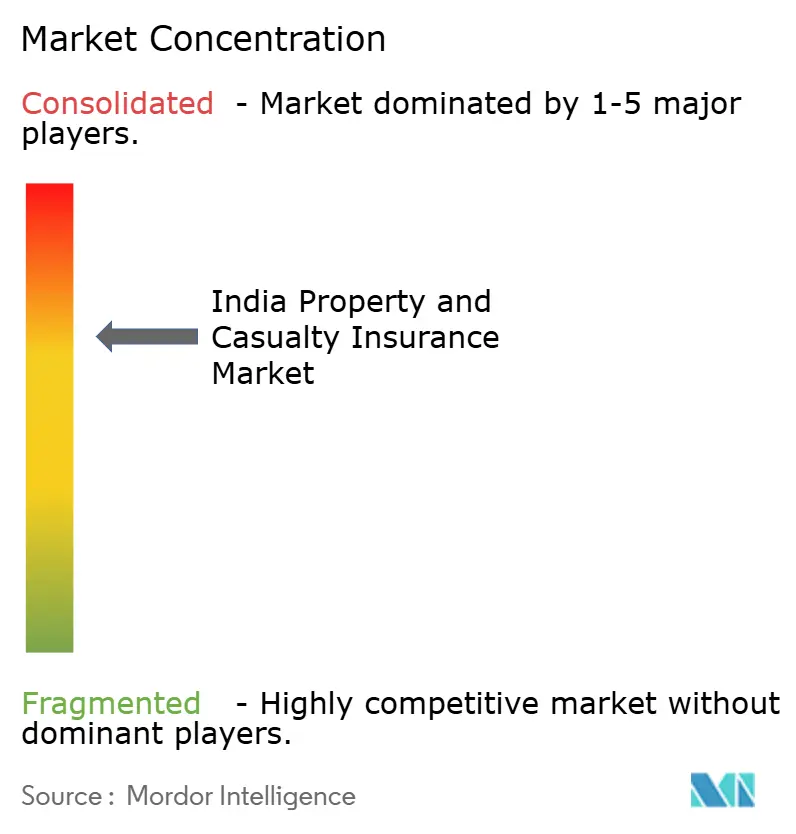
| Market Concentration | Medium |
Major Players *Disclaimer: Major Players sorted in no particular order Image © Mordor Intelligence. Reuse requires attribution under CC BY 4.0. | |
India Property and Casualty Insurance Market Analysis by Mordor Intelligence
The India Property And Casualty Insurance Market size in terms of premium value is projected to expand from USD 37.32 billion in 2025 and USD 39.34 billion in 2026 to USD 51.22 billion by 2031, registering a CAGR of 5.42% between 2026 to 2031.
Robust premium growth stems from higher vehicle registrations, expanding government-funded schemes, and the 100% FDI cap that channels fresh capital and global expertise into domestic operations. Rising natural catastrophe losses, mandatory e-policy issuance, and ongoing digitalization nudge insurers toward advanced underwriting models, parametric solutions, and data-driven customer engagement. Competition intensifies as public-sector giants restructure, private players scale technology investments, and digital-only carriers employ low-cost operating models to gain share. Underwriting discipline remains pivotal because aggressive price competition continues to pressure combined ratios, especially in motor and commercial lines.
Key Report Takeaways
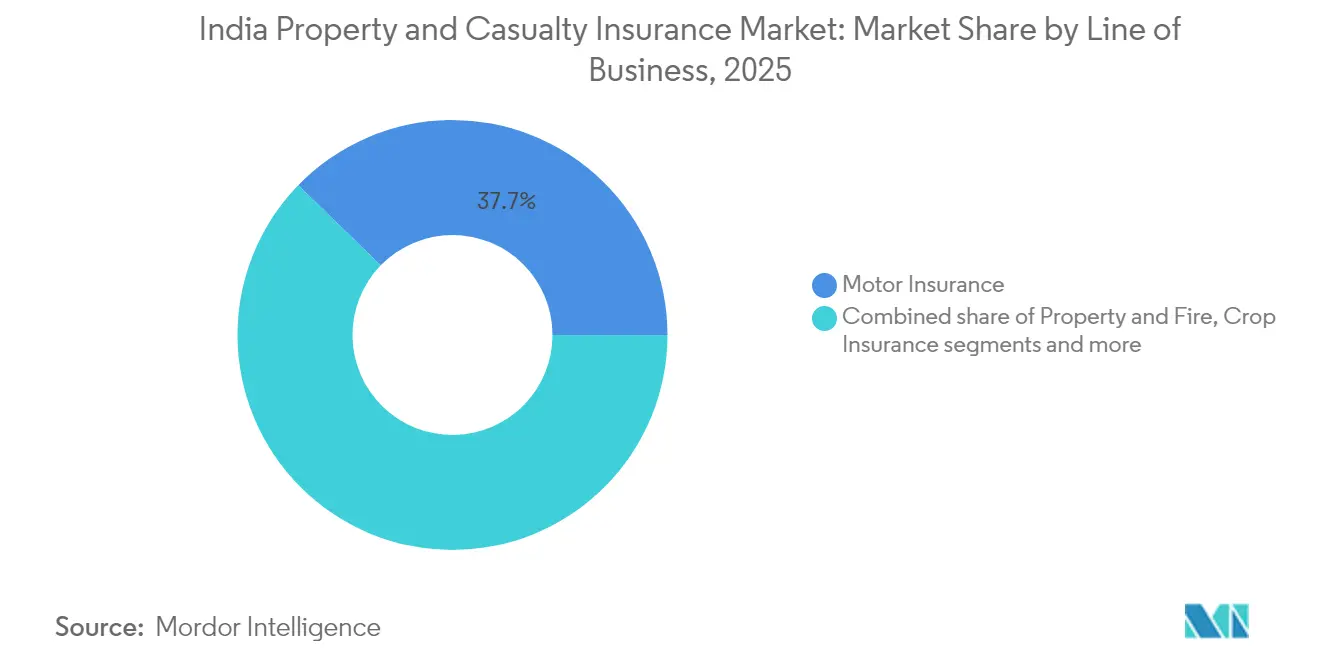
- By line of business, motor insurance led with 37.74% of India property and casualty insurance market share in 2025; liability insurance is expected to post a 7.84% CAGR through 2031.
- By customer type, individuals accounted for 54.03% share of the India property and casualty insurance market size in 2025, while MSMEs are projected to expand at 6.79% CAGR in 2026-2031.
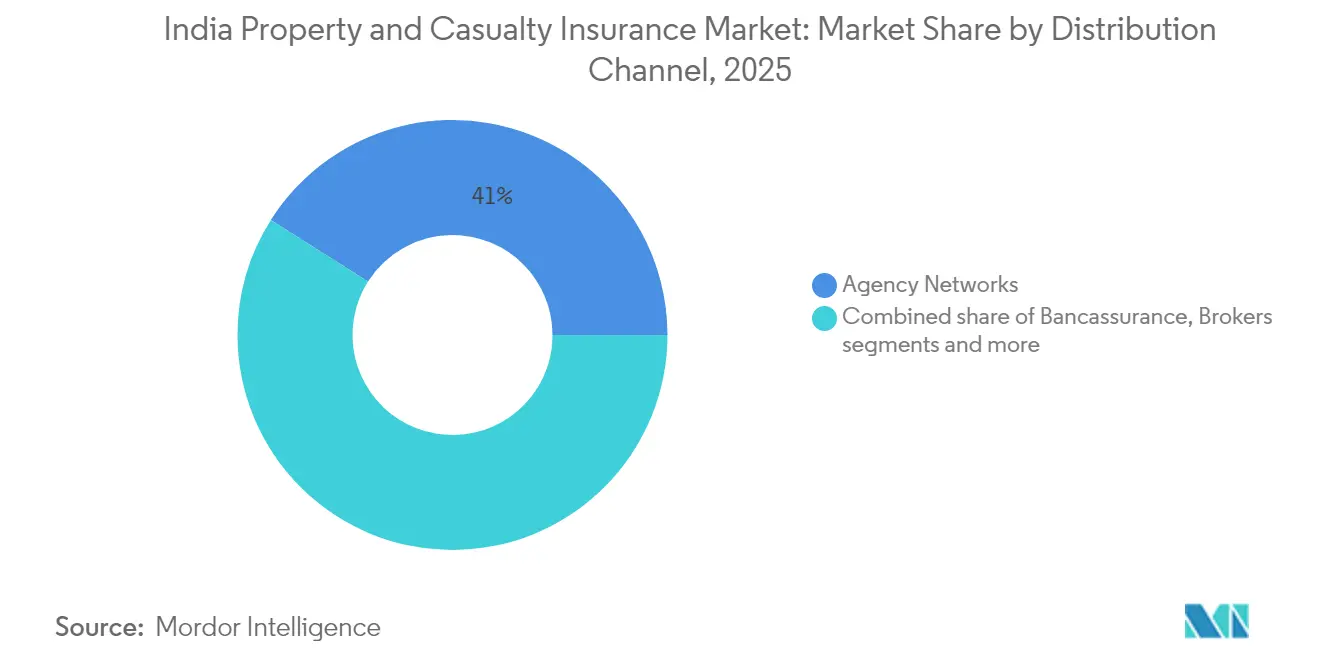
- By distribution channel, agency networks held 41.02% of the India property and casualty insurance market in 2025; digital / web aggregators are forecast to advance at a 9.05% CAGR by 2031.
- By geography, West India represented 23.05% of overall premiums in 2025, whereas North-East India is set to record the fastest growth at 6.32% CAGR by 2031.
- By provider type, public-sector general insurers commanded a 47.78% share in 2025, yet digital-only insurers are expected to grow at 9.84% CAGR over the outlook period.
Note: Market size and forecast figures in this report are generated using Mordor Intelligence’s proprietary estimation framework, updated with the latest available data and insights as of 2026.
India Property and Casualty Insurance Market Trends and Insights
Drivers Impact Analysis*
| Driver | ( ~ ) % Impact on CAGR Forecast | Geographic Relevance | Impact Timeline |
|---|---|---|---|
| Rising motorizations and mandatory third-party cover | +1.2% | National, concentrated in West and South India | Medium term (2-4 years) |
| Government-funded health schemes expanding non-life pool | +0.8% | National, higher impact in North and Central India | Long term (≥ 4 years) |
| Digital-first Insurtech distribution lowering CAC | +0.9% | National, early adoption in West and South India | Short term (≤ 2 years) |
| Climate-related catastrophe awareness driving property cover | +0.7% | National, higher relevance in coastal regions | Medium term (2-4 years) |
| 100% FDI cap-lift unlocking foreign capital and expertise | +1.1% | National, immediate effect in West Indian financial centers | Short term (≤ 2 years) |
| IRDAI ‘Insurance for All 2047’ sandbox and micro-product push | +0.6% | National, focus on North-East India and rural areas | Long term (≥ 4 years) |
| Source: Mordor Intelligence | |||
Rising Motorizations and Mandatory Third-Party Cover
High double-digit growth in vehicle registrations paired with stricter liability ceilings has lifted premium rates by 15-20% in 2025, delivering an immediate earnings uptick for motor underwriters[1]PersonalFN Editorial, “Motor Insurance Premium Revision,” personalfn.com. Insurers further benefit from the regulator’s removal of deductibles, which improves retention on each policy and reduces claims leakage. ICICI Lombard’s 23% surge in new-car premiums and a 7.2 percentage-point motor-loss-ratio improvement demonstrate how scaled carriers convert regulatory tailwinds into margin expansion. Data from connected-car telematics is now fed into pricing engines, allowing real-time risk segmentation and helping offset adverse selection risks as electric vehicle adoption accelerates. Bundled battery-protection riders are also emerging, creating cross-sell opportunities and deepening policy density per vehicle. These layered revenue levers collectively reinforce the driver’s positive 1.2% CAGR contribution over the medium term.
Government-Funded Health Schemes Expanding Non-Life Pool
Pradhan Mantri Fasal Bima Yojana’s 56.80-crore farmer enrolment and claims of USD 18.79 billion give non-life carriers a stable, state-backed premium spine[2]IBEF Analysts, “Insurance Penetration in India,” ibef.org. Satellite and drone imagery adopted under the scheme shorten loss-settlement cycles from months to days, establishing proof-of-concept for parametric triggers in wider property portfolios. Yet, actuarial stress tests reveal high-risk districts where loss ratios exceed 130%, forcing debate on premium realignment toward risk-based pricing. The USD 8.38 billion multi-year budget protects near-term revenue visibility but also incentivizes private carriers to co-create micro-covers that dovetail with government pools. Successful pilots in Odisha now bundle weather-index crop cover with personal-accident add-ons, nudging rural households toward multi-line adoption. Over the long term, these hybrid models are expected to lift absolute penetration while preserving fiscal sustainability for the exchequer.
Digital-First Insurtech Distribution Lowering CAC
The April 2024 e-policy mandate eliminated paper issuance, trimming onboarding costs by 25–35% and giving digital aggregators a structural advantage[3]Business Standard Bureau, “India Embraces e-Insurance Policies,” business-standard.com. BimaSugam’s open-architecture marketplace plans, funded with an initial USD 0.60 million from leading carriers, aim to standardize APIs for pricing, issuance, and claims across life and non-lifelines. Early-stage Insurtech leverages this connectivity to launch situational micro-covers, such as daily-trip travel insurance sold entirely via UPI payment flows. Players report that digitally acquired customers display 1.4 times higher cross-sell conversion as behavioral and transactional data refine propensity models in real time. Nonetheless, the regulator’s sandbox only grants conditional licenses, capping policy limits and premium sizes until risk controls mature, which tempers short-term volume spikes. Overall, the driver sustains a 0.9% positive lift but remains contingent on the speed of full-stack license approvals.
Climate-Related Catastrophe Awareness Driving Property Cover
India’s USD 180 billion climate damage bill from 1993-2022 has heightened corporate and household risk perception, pushing property insurance rates up 3% in Q4 2024. Reinsurers have tightened capacity in flood-exposed zones, compelling cedants to diversify by purchasing parametric layers that trigger payouts once rainfall or river-gauge indices breach set limits. Domestic carriers are collaborating with the Indian Meteorological Department to ingest granular weather feeds, enabling kilometer-level catastrophe modeling previously unavailable in the market. Micro, small, and medium enterprises, often uninsured, are now targeted with parametric flood riders priced at INR 1,200-1,500 annually, delivering instant payouts within 72 hours of event certification. While take-up is nascent, early adopters in Chennai and Guwahati reported business interruption losses reduced by 18-22% during the 2024 monsoon floods, validating the product proposition. These developments reinforce the driver’s medium-term 0.7% boost to market CAGR.
Restraints Impact Analysis*
| Restraint | (≈) % Impact on CAGR Forecast | Geographic Relevance | Impact Timeline |
|---|---|---|---|
| Persistent price competition keeps combined ratios high | -0.9% | National, heightened in West and South India | Medium term (2-4 years) |
| Low penetration in Tier-3/4 towns limits scale | -0.6% | Rural areas and Tier-3/4 cities | Long term (≥ 4 years) |
| Under-pricing of emerging cyber risks | -0.4% | National, severe in tech hubs | Short term (≤ 2 years) |
| Limited domestic reinsurance capacity for NatCat events | -0.7% | National, pronounced in coastal areas | Medium term (2-4 years) |
| Source: Mordor Intelligence | |||
Persistent Price Competition Keeps Combined Ratios High
Although industry combined ratios improved to 103.3% in 2024, break-even remains elusive for many mid-tier players, especially those reliant on commoditized motor and fire lines[4]Rediff Staff, “General Insurers’ Profitability and Motor Segment Trends,” rediff.com. The proposed three-insurer public-sector merger could trigger aggressive discounting as the new entity uses price to defend its 31% share while rationalizing overlapping branches. Private multi-line carriers retaliate by bundling wellness or roadside assistance services at marginal cost, diluting pure-risk pricing discipline. Digital-only entrants compound pressure by leveraging policy-admin systems that run at 10–12 basis-point unit costs, permitting thinner margins without compromising ROE. Reinsurers, wary of prolonged underpricing, have already raised catastrophe treaty costs by 4–6%, squeezing net retentions. Unless tariffs are re-imposed or solvency thresholds tightened, the restraint will continue shaving 0.9% off the forecast CAGR.
Low Penetration in Tier-3/4 Towns Limits Scale
Insurance density sits at 3.7% of GDP, and in many Tier-4 districts, penetration falls below 2%, underscoring latent market potential but also distribution frictions. High agent attrition and low ticket sizes make traditional branch economics unsustainable; field offices often break even only at 11th policy sold per month. Although life insurers have reversed the COVID-era contraction by adding outlets in smaller cities, GI players lag, citing limited product fit and cumbersome KYC norms. Experiments with WhatsApp-based micro-covers show promise in policy issuance in under three minutes and 40% lower servicing cost, yet regulatory caps on sum-assured restrict revenue scalability. Financial literacy scores remain stubbornly low; IRDAI’s awareness drives in Tripura and Assam aim for 100% outreach but require sustained funding over at least five years. Until disposable incomes and education levels rise materially, the gap is expected to subtract 0.6% from the overall CAGR.
*Our forecasts treat driver/restraint impacts as directional, not additive. The impact forecasts reflect baseline growth, mix effects, and variable interactions.
Segment Analysis
By Line of Business: Motor Leadership and Liability Upswing
Motor insurance commands a 37.74% share of the India property and casualty insurance market in 2025, buoyed by sustained vehicle demand and regulatory changes that lifted premium ceilings. The segment captured 15-20% premium increases in 2025, demonstrating the pricing flexibility built into mandatory cover regulations. Liability insurance scales fastest with a 7.84% CAGR on the back of rising corporate governance requirements and escalating cyber-attack costs projected at USD 10.5 trillion by 2025. Property and fire lines benefit from industrial expansion and heightened climate risk awareness, whereas marine growth remains muted due to shallow domestic shipping volumes.
Government-supported crop insurance receives USD 8.38 billion in funding that anchors premium inflows. With infrastructure investments reaching USD 134.94 billion, the demand for engineering covers continues to grow significantly. Gas-pipeline projects, supported by surety bonds ranging from USD 0.18 to 6.02 million, further expand the underwriting landscape by providing financial assurance for project completion. As public spending on infrastructure projects maintains its momentum, engineering insurers are increasingly leveraging these opportunities to strengthen their market presence and capitalize on the growing project pipelines.


By Customer Type: MSME Momentum
In the Indian property and casualty insurance market, individuals command a 54.03% share in 2025, largely driven by mandatory motor insurance and a growing emphasis on health coverage. This dominance is attributed to the increasing awareness of insurance benefits and the government's push for broader health insurance penetration. Micro, Small, and Medium Enterprises (MSMEs) are witnessing the fastest growth, boasting a 6.79% CAGR, fueled by streamlined compliance processes, government incentives, and the advent of digital premium financing, which enhances affordability. The rising adoption of digital tools and platforms by MSMEs further supports this growth trajectory. While large corporates represent a seasoned segment of the market, they increasingly seek advanced solutions, including captive programs and parametric triggers, navigating through intricate regulatory landscapes. These corporates demand innovative risk management strategies to address complex operational risks. Government entities, on the other hand, ensure consistent volumes but tend to focus more on tender pricing than the breadth of coverage, often prioritizing cost efficiency over comprehensive protection.
With digital distribution, insurers can finely tailor products to align with MSME cash-flow patterns, achieving a reduction in acquisition costs by nearly one-third compared to traditional agency models. This approach enhances affordability and improves accessibility for smaller businesses. Additionally, a potential shift in composite licensing could empower insurers to merge life and non-life products, thereby amplifying their share of customer spending across diverse cohorts. Such regulatory changes could pave the way for more integrated and customer-centric insurance offerings.
By Distribution Channel: Agency Weight Meets Digital Speed
In 2025, agency networks commanded a 41.02% market share, underscoring their pivotal role in fostering trust within a relationship-driven landscape. These networks continue to be a cornerstone for face-to-face interactions, which remain critical in building long-term customer relationships. A notable 62% surge in female POSP numbers catalyzed a 15% uptick in premiums sourced from agencies, showcasing the growing contribution of women in this domain. Bancassurance, exemplified by partnerships like Bajaj Allianz with Axis Bank, harnesses the power of 5,250 branches to penetrate rural markets effectively. This channel remains instrumental in bridging the gap between insurers and underserved regions, ensuring broader financial inclusion.
Digital and web aggregators, boasting a 9.05% CAGR, shine in areas of transparency, swift issuance, and minimized acquisition costs. These platforms have gained traction due to their ability to offer instant policy issuance and cost-effective solutions. The push for mandatory e-policy formats amplifies the economic advantages for aggregators, enabling them to scale operations efficiently. Meanwhile, brokers carve out specialized niches in intricate commercial lines, addressing complex insurance needs that require tailored expertise. As insurers blend traditional branch presence with app-driven services, "phygital" strategies are paving the way for fluid omnichannel experiences, enhancing customer convenience and engagement.
By Insurance Provider Type: Digital-Only Disruption
Public-sector general insurers command 47.78% of the total premium market in 2025. However, they grapple with solvency and efficiency challenges, including outdated operational frameworks and limited technological adoption. It has led to a proposed merger, aiming to consolidate a 31% market share, albeit with an urgent need for technological upgrades to enhance competitiveness and operational efficiency. Meanwhile, private-sector players, like ICICI Lombard with its Project Orion, are enhancing their combined ratios through automation and process optimization, which improve cost management and customer service.
Digital-only insurers, boasting a 9.84% CAGR, leverage cloud-native cores, AI-driven underwriting, and direct-to-consumer strategies to significantly cut operating costs while offering personalized insurance solutions. Stand-alone health insurers eye consolidation, especially with LIC contemplating strategic stakes for entry into the segment, which could reshape the competitive landscape. Highlighting the segment's potential, Niva Bupa's upcoming IPO is set against a backdrop of a USD 675.6 million gross written premium for FY 2024, marking an impressive 41.27% CAGR over two years and signaling robust growth opportunities in the health insurance market.
Geography Analysis
In 2025, West India accounted for 23.05% of India's property and casualty insurance market premiums, bolstered by Mumbai's dynamic financial ecosystem and its diverse industrial base. With heightened awareness, insurers are now leveraging risk-based pricing, as seen with a 3% uptick in property rates in Q4 2024, despite soaring reinsurance costs. The region's multinational presence and intricate supply chains fuel a consistent demand for cyber solutions and directors' and officers' liability coverage. South India thrives on the back of tech hubs in Bengaluru and Hyderabad, alongside automotive clusters near Chennai. With a high level of digital readiness, the region is piloting direct-to-consumer portals and telematics-driven motor products. Moreover, ongoing infrastructure corridors and port expansions are invigorating demand for marine and engineering insurance lines.
North India reaps the benefits of expansive agricultural insurance schemes and government-backed health initiatives. Yet, premium growth is sensitive to pricing, a reflection of the region's relatively modest disposable income levels. The region's reliance on government-sponsored programs highlights the need for private insurers to innovate affordable products tailored to rural and semi-urban populations. Additionally, the region's large population base offers significant untapped potential for microinsurance products, which could drive future growth if effectively implemented.
Meanwhile, Central India is gaining momentum due to its burgeoning industrial corridors and logistics parks, which are amplifying the demand for commercial insurance. An uptick in climate-related exposures further bolsters this demand. The region's strategic location as a logistics hub, coupled with increasing investments in warehousing and transportation infrastructure, is creating opportunities for insurers to expand their portfolios. Furthermore, the rise in climate-related risks, such as floods and extreme weather events, is pushing businesses to seek comprehensive coverage, thereby contributing to the region's premium growth.
East India presents a mixed bag: While Kolkata upholds a longstanding insurance tradition, its neighboring states grapple with slower economic growth. However, the tourism boom in Odisha and Bihar is driving a heightened demand for travel and hospitality insurance. The region's cultural and natural attractions are drawing both domestic and international tourists, creating a niche market for insurers to offer tailored travel policies. Starting from a modest base, North-East India is on a growth trajectory, boasting the highest CAGR of 6.32% projected to 2031. This surge is attributed to aggressive financial inclusion drives and mobile distribution channels reaching hitherto untapped markets. Notably, IRDAI's literacy initiatives in Tripura, targeting 100% financial awareness, hint at a promising future for premium growth. The region's unique geographical challenges, including remote locations and limited infrastructure, are being addressed through innovative mobile-based solutions, enabling insurers to penetrate deeper into underserved areas.
Competitive Landscape
The top five players account for close to the majority of total gross written premiums, indicating a moderately concentrated yet competitive environment. Public-sector insurers leverage extensive networks and government backing, ensuring stability and widespread reach. Private insurers, on the other hand, focus on enhancing operational efficiencies through data-driven strategies, enabling them to remain competitive. Meanwhile, digital-only challengers are disrupting the market by rapidly scaling their operations with agile and technology-driven cores, targeting niche customer segments. In 2024, ICICI Lombard, Bajaj Allianz, and New India Assurance topped the profitability charts, posting net profits of USD 231.3 million, USD 186.7 million, and USD 136.1 million, respectively.
Following the FDI ceiling increase to 100%, foreign participation surged, highlighted by Zurich’s USD 670 million investment in Kotak General Insurance. This move reflects growing confidence in the Indian insurance market's potential. Allianz’s upcoming joint venture with Jio Financial underscores the merging realms of insurance and digital platforms, signaling a shift toward integrated financial ecosystems. Key technology focuses include AI-driven underwriting, which enhances risk assessment accuracy, blockchain for claims automation to improve transparency and efficiency, and IoT for real-time risk monitoring, enabling proactive risk management.
Insurers are forging ecosystem partnerships to strengthen their value propositions. Collaborations with hospitals aim to expand cashless health services, improving customer convenience and satisfaction. Partnerships with EV manufacturers focus on offering bundled motor and battery coverage, addressing the growing demand for electric vehicles. This evolution from product-centric to platform-oriented competition is reshaping customer expectations, driving insurers to invest in interconnected and customer-centric value propositions that align with the broader digital transformation of the industry.
India Property and Casualty Insurance Industry Leaders
New India Assurance Co. Ltd.
ICICI Lombard General Insurance
Bajaj Allianz General Insurance
HDFC ERGO General Insurance
United India Insurance
- *Disclaimer: Major Players sorted in no particular order

Recent Industry Developments
- June 2025: An Air India crash leads to insurance claims nearing USD 475 million, highlighting the volatility in aviation coverage. This incident underscores the financial risks associated with aviation insurance and the challenges insurers face in managing such high-value claims.
- April 2025: TATA AIG launches Medicare Select, aiming to boost Tier-2 and Tier-3 markets' share to 35% of health premiums by 2027. The product is designed to cater to the specific healthcare needs of these regions, reflecting the company's strategy to expand its footprint in underserved markets.
- March 2025: LIC intensifies discussions to secure a major stake in an independent health insurer. This move aligns with LIC's broader strategy to diversify its portfolio and strengthen its presence in the growing health insurance market.
- March 2025: Allianz partners with Jio Financial, sealing a preliminary deal for a health and general insurance venture in India. This collaboration aims to leverage Allianz's global expertise and Jio Financial's extensive local network to tap into India's expanding insurance market.
- March 2024: New India Assurance and Niva Bupa each invest USD 0.60 million into Bima Sugam India Federation, sparking governance debates. The investment raises questions about the federation's operational transparency and the role of key stakeholders in decision-making processes.


Research Methodology Framework and Report Scope
Market Definitions and Key Coverage
Our study defines the India property & casualty (P&C) insurance market as all gross written premiums generated within the country from fire, engineering, marine, motor, liability, and specialty lines that indemnify physical assets or third-party claims. The definition aligns with IRDAI's non-life classification, covers business placed directly and through re-insurance accepted, and is expressed in constant-year U.S. dollars for cross-country comparability.
Scope exclusion: life, health, and standalone crop micro-insurance plans sit outside this remit and are not counted.
Segmentation Overview
- By Line of Business (Value)
- Motor Insurance
- Property & Fire Insurance
- Crop Insurance
- Marine Insurance
- Liability Insurance
- Engineering Insurance
- Travel Insurance
- By Customer Type (Value)
- Individuals
- Micro, Small & Medium Enterprises (MSMEs)
- Large Corporates
- Government & Public Sector Entities
- By Distribution Channel (Value)
- Agency Networks
- Bancassurance
- Brokers
- Direct In-house Sales
- Digital / Web Aggregators
- Affinity & Partnership Channels
- By Insurance Provider Type (Value)
- Public-Sector General Insurers
- Private-Sector General Insurers
- Stand-alone Health Insurers
- Digital-only Insurers
- By Region – India (Value)
- North India
- South India
- East India
- West India
- Central India
- North-East India
Detailed Research Methodology and Data Validation
Primary Research
Mordor analysts interviewed senior underwriting managers, digital aggregator executives, and regional brokers across multiple states. These discussions clarified channel shifts, average selling prices, and reserve adequacy, and helped validate assumptions on loss-ratio trends and policy count growth among MSMEs and EV owners.
Desk Research
We began by mapping historic premium pools using readily available tier-1 sources such as IRDAI annual handbooks, Reserve Bank of India macro series, Ministry of Road Transport vehicle registrations, and Central Statistics Office construction completions. Supplementary context came from industry association white papers, select peer-reviewed journals, and company 10-K filings. Proprietary datasets from D&B Hoovers and Dow Jones Factiva supplied insurer financials and deal flow. The sources listed are illustrative; numerous additional public records informed datapoint cross-checks.
Market-Sizing & Forecasting
A top-down model builds the 2025 baseline by indexing line-wise premium growth against nominal GDP, new-vehicle registrations, project pipeline outlays, and combined ratio movements; selective bottom-up roll-ups of sampled ASP × policy volumes for motor and property segments are then used as sense checks. Key variables like urban housing completions, freight ton-kilometers, catastrophe loss severity, and digital direct share feed a multivariate regression and ARIMA blend to extend forecasts to 2030. Where insurer disclosures were incomplete, interpolations were bounded by regional peer medians before being reconciled with primary insights.
Data Validation & Update Cycle
Outputs pass a three-layer review: automated variance flags, peer analyst scrutiny, and a final sector lead sign-off. Models refresh annually, with interim updates triggered by regulatory caps, major catastrophic events, or M&A that materially alters market shares. Clients therefore receive the latest validated view at download.
Why Our India Property and Casualty Insurance Baseline Commands Reliability
Published estimates often diverge because firms pick differing cover lines, inflation bases, and forecast cadences.
Key Gap Drivers include whether crop and engineering covers are counted, the aggressiveness of assumed ASP escalation, currency conversion dates, and the depth of on-ground interviews feeding scenario tests.
Benchmark comparison
| Market Size | Anonymized source | Primary gap driver |
|---|---|---|
| USD 37.32 B (2025) | Mordor Intelligence | - |
| USD 29.57 B (2025) | Regional Consultancy A | Excludes engineering & liability lines; relies on 2023 motor tariff freeze without adjustment |
| USD 35.28 B (2025) | Trade Journal B | Uses straight-line GDP multiplier, limited primary validation |
| USD 24.80 B (2025) | Industry Association C | Counts only direct premiums from licensed insurers; omits digital-only entrants and inward reinsurance |
In sum, by applying a clearly defined scope, blending authoritative statistics with frontline interviews, and re-checking every variance, Mordor's baseline offers decision-makers a balanced, transparent yardstick that is repeatable and readily auditable.


Key Questions Answered in the Report
What is the current size of the India property and casualty insurance market?
The market stands at USD 39.34 billion in 2026 and is projected to reach USD 51.22 billion by 2031.
Which line of business holds the largest India property and casualty insurance market share?
Motor insurance leads with a 37.74% share in 2025, supported by mandatory third-party coverage reforms.
How fast is the liability segment expected to grow?
Liability insurance is forecast to expand at a 7.84% CAGR between 2026 and 2031.
Which distribution channel is growing the quickest?
Digital / web aggregators exhibit the highest 9.05% CAGR due to mandatory e-policy issuance and lower acquisition costs.
Why is North-East India the fastest-growing regional market?
Financial inclusion drives, improving connectivity, and IRDAI literacy campaigns are lifting penetration, resulting in a 6.32% CAGR to 2031.
How does the new 100% FDI cap affect competition?
The cap allows foreign insurers to establish wholly owned subsidiaries, injecting capital and technology and intensifying competitive dynamics across segments.
Page last updated on:


