Market Overview
| Study Period | 2020 - 2031 |
|---|---|
| Forecast Data Period | 2026 - 2031 |
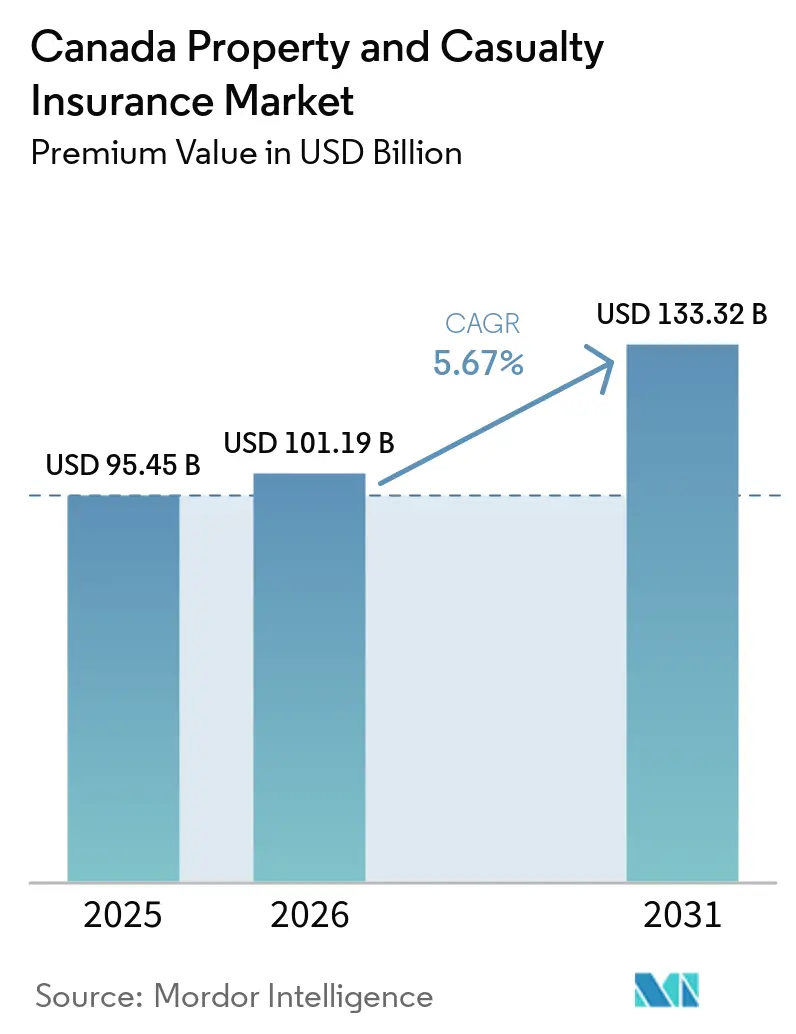
| Base Year Market Size (2025) | USD 95.45 Billion |
| Market Size (2026) | USD 101.19 Billion |
| Market Size (2031) | USD 133.32 Billion |
| Growth Rate (2026 - 2031) | 5.67% CAGR |
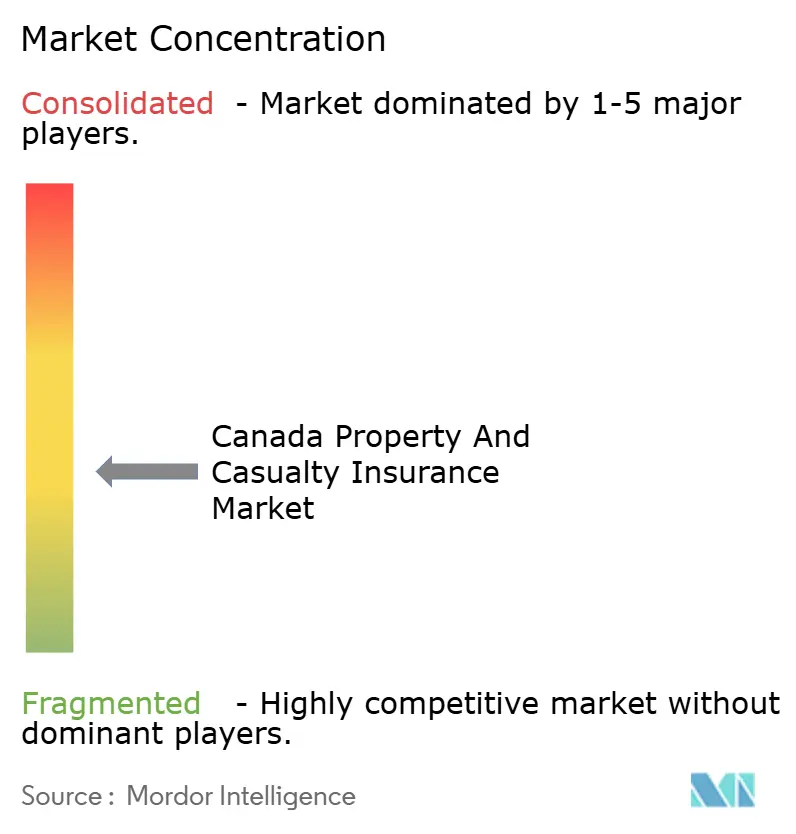
| Market Concentration | Medium |
Major Players *Disclaimer: Major Players sorted in no particular order Image © Mordor Intelligence. Reuse requires attribution under CC BY 4.0. | |
Canada Property and Casualty Insurance Market Analysis by Mordor Intelligence
The Canada Property And Casualty Insurance Market size in terms of premium value was valued at USD 95.45 billion in 2025 and is estimated to grow from USD 101.19 billion in 2026 to reach USD 133.32 billion by 2031, at a CAGR of 5.67% during the forecast period (2026-2031).
Growth tracks structural shifts in risk and distribution as climate-driven catastrophes increase loss volatility, auto repair and theft trends lift severity, and carriers scale modernization programs to expand digital distribution. The Canada property and casualty insurance market continues to absorb event losses through disciplined underwriting, prudent reinsurance, and active accumulation controls that preserve capital strength across cycles. Regulatory transitions in key provinces shape profitability pathways, particularly in auto lines where reforms revise benefits and litigation dynamics and where market function depends on sustained rate adequacy. Digital partnerships deepen in parallel as embedded offerings and API-first infrastructure move more quoting, issuance, payments, and servicing into partner ecosystems that fit consumer purchase journeys.
Key Report Takeaways
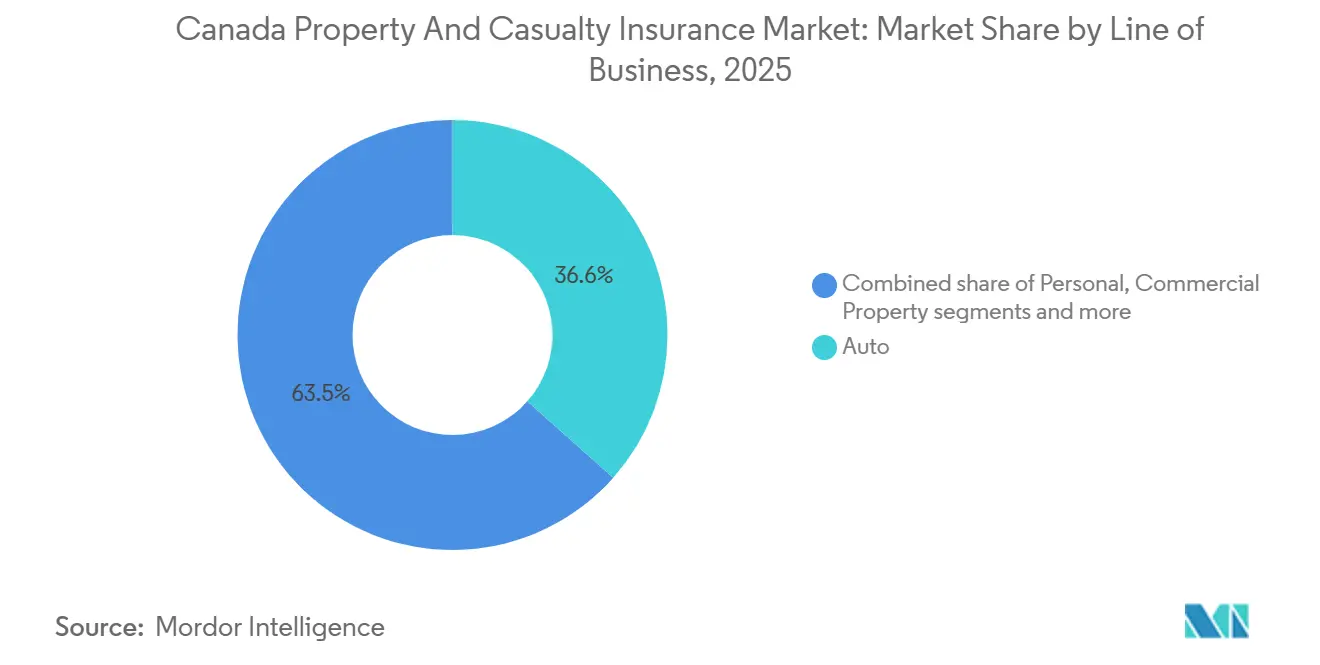
- By line of business, auto led with 36.55% of the Canada property and casualty insurance market share in 2025, while specialty lines are forecasted to expand at an 8.46% CAGR through 2031.
- By distribution channel, brokers and independent agents held 54.23% of the Canada property and casualty insurance market share in 2025, while embedded and affinity partnerships are projected to grow at a 9.02% CAGR to 2031.
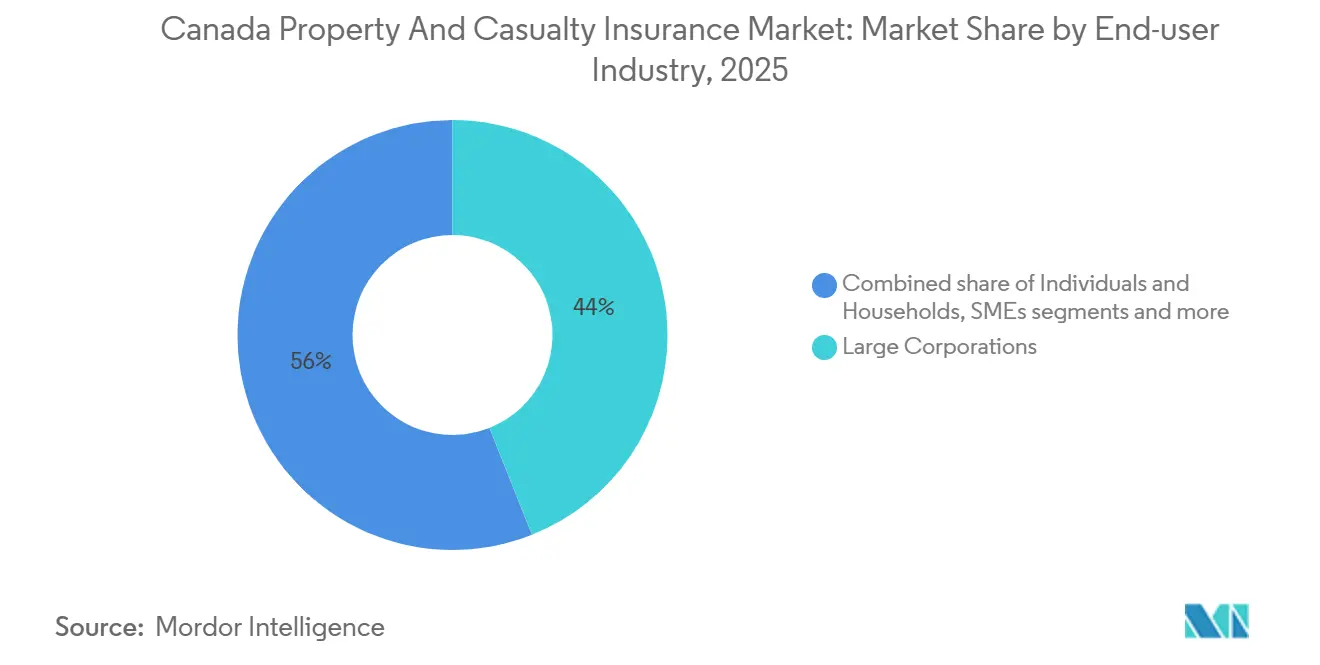
- By end-user industry, large corporations accounted for 43.98% of the Canada property and casualty insurance market share in 2025, while public sector and non-profit entities are expected to advance at a 7.21% CAGR through 2031.
- By geography, Ontario captured 36.06% of the Canada property and casualty insurance market share in 2025, and Alberta is projected to be the fastest-growing province at a 6.39% CAGR through 2031.
Note: Market size and forecast figures in this report are generated using Mordor Intelligence’s proprietary estimation framework, updated with the latest available data and insights as of January 2026.
Canada Property and Casualty Insurance Market Trends and Insights
Drivers Impact Analysis*
| Driver | (~) % Impact on CAGR Forecast | Geographic Relevance | Impact Timeline |
|---|---|---|---|
| Increasing frequency & severity of climate-driven catastrophes | +1.8% | National, with early gains in Ontario, Alberta, and British Columbia | Long term (≥ 4 years) |
| Escalating auto-repair costs & theft boosting premiums | +1.4% | National, spill-over to Alberta, Ontario | Medium term (2-4 years) |
| Evolving commercial lines market amid inflation & liability claims | +0.9% | National, concentrated in Ontario, Quebec | Medium term (2-4 years) |
| Embedded insurance partnerships with fintech/e-commerce | +0.7% | National, with early gains in Ontario and British Columbia | Short term (≤ 2 years) |
| Open-Banking data enabling hyper-personalised usage-based cover | +0.6% | National, early adoption in Ontario, Quebec | Medium term (2-4 years) |
| AI-driven claims automation lowers expense ratios | +0.5% | National | Short term (≤ 2 years) |
| Source: Mordor Intelligence | |||
Increasing Frequency & Severity of Climate-Driven Catastrophes
In 2024, Canada experienced the costliest year on record for severe weather-related insured losses, totalling CAD 8.5 billion (USD 5.9 billion), surpassing the previous record. This dramatic increase, nearly three times higher than 2023’s losses, reflects the growing frequency and intensity of extreme weather events. Major contributors included a massive hailstorm in Calgary, causing around C$3 billion in damage, widespread wildfires near Jasper, and severe floods and storms affecting cities like Toronto and Montreal. More than 250,000 insurance claims were filed nationwide, demonstrating both the scale of the destruction and the strain on the insurance system. These events are exerting ongoing pressure on home and property insurance premiums and highlight the urgent need for adaptation strategies to mitigate the financial impacts of climate change in Canada [1]Insurance Bureau of Canada, “2024 Shatters Record for Costliest Year for Severe Weather-Related Losses in Canadian History at $8.5 Billion,” Insurance Bureau of Canada, ibc.ca. Secondary perils such as flood, hail, and wildfire accounted for a large share of the losses and have become the central underwriting challenge for property portfolios in urban corridors and wildland-urban interfaces. Catastrophic convective storm activity highlighted the concentration of assets in fast-growing urban centers and reinforced the need for sublimits, higher event deductibles, and refined accumulation management in the Canada property and casualty insurance market. Climate science indicates that Canada is warming faster than the global average, which extends wildfire seasons and intensifies storm patterns, so carriers continue to shift toward granular postal-code level moratoriums and risk selection practices. Federal support for resilience includes a Budget 2024 allocation to advance a national flood insurance program that targets protection gaps, which can improve coverage availability where 1.5 million households face elevated flood exposure, and awareness remains limited.[2]Government of Canada, “Government of Canada Adaptation Action Plan,” Government of Canada, canada.ca
Escalating Auto-Repair Costs & Theft Boosting Premiums
Auto insurance premiums increased 36.4% from December 2014 to December 2024, with year-over-year gains peaking in 2024 as rising parts and labor costs, vehicle complexity, and theft trends drove claim severity in the Canada property and casualty insurance market. Electric vehicle repairs have required specialized diagnostics and parts sourcing that add cost and time, which influences physical damage coverage pricing in larger provincial markets.[3]Statistics Canada, “Impacts of Rising Costs and Claims on Personal Automobile Insurance Profitability and Consumers in Canada,” Statistics Canada, 150.statcan.gc.ca Organized theft targeting keyless entry vehicles elevated loss costs and led to a national enforcement plan that empowered border agency seizures and increased penalties for carjacking, which supported an early decline in theft claims in 2025, while the longer trend remains elevated. Pressure is not uniform across provinces because Ontario’s claim ratios and urban theft incidence complicate rate adequacy, and Alberta’s rate caps created structural unprofitability that resulted in market exits and tight capacity within the Canada property and casualty insurance market. Vehicle price inflation has raised total loss thresholds and increased total loss frequency, which sustains higher severity in physical damage claims and prompts underwriting adjustments to restore profitability.
Evolving Commercial-Lines Market Amid Inflation & Liability Claims
Commercial lines saw capacity return and competition increase in 2025, with composite pricing trending lower, even as claims inflation and social inflation maintained a focus on rate adequacy and attachment points across casualty programs in the Canada property and casualty insurance market. Litigation funding and broader liability theories lifted severity and settlement values, which required tighter reserving and exclusions for emerging risks such as PFAS, biometric privacy, and greenwashing assertions. Legal costs in certain auto liability segments rose faster than headline inflation, which added friction to the cost structure and led to further rate reviews in markets already contending with theft and repair pressure. Property capacity has been more selective with favorable pricing for well-protected risks and higher deductibles in catastrophe zones, which supports targeted growth while preserving risk-adjusted returns in the Canada property and casualty insurance market. Cyber stabilized after the 2021 to 2023 loss cycle, as underwriting recalibration and control-based pricing improved insurance service results in 2024 and anchored continued premium growth.
Open-Banking Data Enabling Hyper-Personalised Usage-Based Cover
Canada’s open banking framework under Budget 2025 sets a January 2026 start for secure data sharing with accredited providers, which will enable verified financial information to support pricing and claims verification use cases in the Canada property and casualty insurance market[4]NCFA Canada, “Budget 2025 Accelerates Fintech, AI, and Capital Growth,” NCFA Canada, ncfacanada.org. Many consumers already share data through less secure practices, and the transition to regulated rails will reduce liability issues while expanding compliant integrations that can improve underwriting precision and payment reliability. Usage-based insurance is well-positioned to combine telematics with verified financial indicators, and safe drivers can access meaningful savings through behaviour-based programs administered through carrier apps. Enrollment remains lower than expressed interest, and carriers respond with enrollment incentives tied to renewal savings based on driving behaviour, distraction metrics, and time-of-day patterns in the Canada property and casualty insurance market. Privacy frameworks such as those in Quebec require explicit consent and purpose limitation, which shape program communications and transparency around scoring to sustain customer trust.
Restraints Impact Analysis*
| Restraint | (~) % Impact on CAGR Forecast | Geographic Relevance | Impact Timeline |
|---|---|---|---|
| Provincial rate caps/government monopolies in auto lines | -0.8% | Alberta, British Columbia, Saskatchewan, and Manitoba | Medium term (2-4 years) |
| Rising reinsurance costs after record NatCat losses | -0.6% | National | Short term (≤ 2 years) |
| Social-inflation-led litigation pressures on liability reserves | -0.4% | National, concentrated in Ontario | Long term (≥ 4 years) |
| Maturing IFRS-17 implementation raising capital strain for small insurers | -0.2% | National, particularly small mutual insurers | Medium term (2-4 years) |
| Source: Mordor Intelligence | |||
Provincial Rate Caps / Government Monopolies in Auto Lines
Alberta’s 7.5% good-driver rate cap for 2025 and 2026 followed a 2023 rate pause and a 2024 limit, which resulted in collective auto underwriting losses in 2024 and triggered capacity withdrawals that reduced consumer choice in the Canada property and casualty insurance market. Some carriers exited the Alberta auto market or restricted new business, while others adjusted underwriting appetite, which placed pressure on private competition during a period of elevated claim costs. Provinces with public monopolies for basic auto coverage restrict private carriers to optional coverages, which limits competitive price discovery and constrains private market innovation in telematics and usage-based pricing across the Canada property and casualty insurance market. Alberta’s transition to a care-first no-fault model on January 1, 2027, will fundamentally change benefits and reserving patterns during the changeover period, and carriers will recalibrate frequencies and severities without long historical data for the new system.
Rising Reinsurance Costs After Record NatCat Losses
Record catastrophe losses in 2024 elevated gross burdens, and while global rate-on-line eased in 2025, reinsurers raised attachment points from historical levels, which shifted more risk retention to primary carriers in the Canada property and casualty insurance market. These severe catastrophe losses have increased the overall cost of reinsurance, prompting reinsurers to tighten terms and shift more risk back to primary insurers. Treaty agreements have become more selective, with provisions such as hours clauses, reinstatement premiums, and aggregate deductibles becoming more common in catastrophe coverage programs. Regulatory oversight emphasizes stress testing for reinsurance failure and managing concentration risk, highlighting the need for careful counterparty evaluation and diversified reinsurance panels to maintain capital resilience. Large-scale events, such as earthquakes, pose systemic tail risks, and gaps in private coverage underline the ongoing importance of government backstops for extreme scenarios. While alternative capital and innovative catastrophe structures provide additional options, they introduce basis risk if triggers do not align perfectly with underlying exposures, requiring careful alignment between insurers’ risk profiles and the instruments used.
*Our forecasts treat driver/restraint impacts as directional, not additive. The impact forecasts reflect baseline growth, mix effects, and variable interactions.
Segment Analysis
By Line of Business: Specialty Lines Accelerate as Traditional Auto Dominates Share
Auto insurance commanded 36.55% of 2025 premiums and maintained the largest share of the Canada property and casualty insurance market as carriers applied rate actions and underwriting measures to balance persistent cost pressures across provinces. Profitability remained uneven due to faster growth in repair and theft costs and higher bodily injury severity, so carriers emphasized subsegment segmentation, surcharges for high-theft models, and usage-based pricing where feasible in the Canada property and casualty insurance market. Personal property results reflected catastrophe volatility from 2024 and were subsequently stabilized by deductible structures, sublimits for hail and flood, and reinsurance capping net event exposure. Commercial property and liability benefited from improved capacity and selective rate moderation for well-controlled risks supported by refined modelling and engineering. Telematics adoption advanced to enable more precise risk-based pricing and renewal savings tied to safe driving behaviour, distraction metrics, and time-of-day scoring as part of broader product design.
Specialty lines are forecast to expand at an 8.46% CAGR through 2031 and are positioned as the fastest-growing area within the Canada property and casualty insurance market as digitalization and infrastructure cycles drive cyber, marine, aviation, and surety demand. Cyber premium growth stabilized following prior loss volatility due to tighter underwriting and control-based pricing, and carriers increased service components such as incident response and risk monitoring to reduce frequency and severity. Marine and aviation capacity stayed cautious in selected classes, and underwriters emphasized risk differentiation and event aggregation management to maintain risk-adjusted returns. Commercial auto continued to focus on fleet telematics to manage theft and collision costs, and property underwriters used construction, protection, and exposure profiles to calibrate pricing in capacity-rich segments. The Canada property and casualty insurance industry continues to invest in product design and data capabilities for specialty classes, and that supports growth with improved loss selection.


By Distribution Channel: Brokers and Independent Agents dominate market share while Embedded and Affinity Partnerships lead in growth.
In 2025, the largest sub-segment within the distribution channel for property and casualty insurance in Canada is dominated by brokers and independent agents, who hold a significant market share of approximately 54.23%. This reflects the strong role these intermediaries play in connecting customers with insurers, leveraging their expertise to guide clients through complex insurance products. Brokers and independent agents benefit from established relationships and personalized service, which remain highly valued by policyholders seeking tailored insurance solutions. Their market dominance also highlights the trust and credibility they have built in the Canadian insurance landscape. This sub-segment’s leadership underlines the continued importance of traditional, relationship-driven distribution methods despite evolving digital trends. As a result, brokers and independent agents continue to serve as a critical link between insurers and consumers, supporting a large portion of insurance transactions across the country.
Looking ahead to the 2026-2031 period, the fastest-growing sub-segment within the distribution channel is expected to be “Others,” which includes embedded and affinity partnerships, with a CAGR of 9.02%. This growth reflects the rising importance of alternative distribution models that integrate insurance offerings into non-traditional platforms and partnerships. Embedded insurance, where coverage is seamlessly bundled with other products or services, and affinity partnerships, which leverage established relationships with organizations or communities, are gaining traction by providing greater convenience and targeted access to customers. These innovative approaches align with shifting consumer preferences towards digital-first experiences and on-demand insurance solutions. The growth of these sub-segments signals a gradual transformation in the distribution landscape, where technology and collaboration enable broader market reach and enhanced customer engagement. Consequently, while brokers and independent agents remain central, the emergence of these new channels is reshaping how property and casualty insurance is accessed and purchased in Canada.
By End User: Large Corporations hold the largest share, with Public Sector and Non-Profits accelerating fastest
In 2025, large corporations represent the largest sub-segment within the end-user industry for property and casualty insurance in Canada, holding a significant market share of approximately 43.98%. This dominance reflects the substantial insurance needs of big businesses, which typically require extensive coverage due to their complex operations, higher asset values, and greater exposure to various risks. Large corporations often demand tailored insurance solutions that address risks ranging from property damage to liability and business interruption. Their prominence in the market also underscores the critical role insurers play in supporting corporate risk management strategies across diverse industries. The sizable market share held by this group illustrates the concentration of insurance demand within the corporate sector. Consequently, insurers focus heavily on developing comprehensive and customizable policies to meet the evolving needs of these large clients.
Looking ahead to the 2026-2031 period, the fastest-growing sub-segment in the end-user industry is expected to be the public sector and non-profit organizations, with a CAGR of 7.21%. This growth signals increasing recognition of insurance needs among public institutions and non-profit entities, which face unique risks related to their operations, funding, and community roles. As these organizations expand and take on more responsibilities, their demand for specialized property and casualty insurance coverage rises. The growth in this segment reflects broader trends in public sector investment and risk management modernization. Additionally, insurers are adapting their offerings to better address the distinct challenges faced by non-profits and government bodies. This expanding sub-segment represents an important opportunity for insurers to diversify their client base and provide tailored solutions that support the stability and resilience of public and community-focused organizations.
Geography Analysis
Ontario remains the largest provincial market in Canada’s property and casualty insurance sector, accounting for 36.06% of premiums in 2025. This dominance is driven by the concentration of high-value residential and commercial properties, as well as dense auto exposure in the Greater Toronto Area (GTA). Severe rainfall in July 2024 caused significant flood losses across the GTA, highlighting the need for more granular flood underwriting and higher deductibles in vulnerable neighbourhoods. Carriers are also adjusting property pricing to reflect persistently higher construction and rebuild costs in major urban centers. Ontario’s upcoming auto insurance reforms, effective July 1, 2026, will alter the mix of mandatory and optional benefits, requiring clear communication to policyholders. Additionally, digital distribution and telematics are becoming increasingly important in Ontario due to consumer adoption and scale, with embedded distribution through financial and retail channels expanding market access.
Quebec operates under a hybrid auto insurance model that combines public bodily injury coverage with private property damage coverage, providing a stable and steady pricing environment relative to other provinces. The major weather events of 2024 led to significant losses in southern Quebec, prompting adjustments in flood accumulations, deductibles, and sublimits for basement flooding in high-risk municipalities. Desjardins’ 2025 performance reflected normalization after a challenging 2024 marked by catastrophic events, enabling underwriting improvements by mid-year. Quebec’s regulatory environment has introduced higher administrative penalties and faster complaint resolution, enhanced consumer protection and conduct oversight. This stability in Quebec’s market balances the scale-driven dynamics of Ontario and the growth momentum in Alberta. As a result, Quebec plays a key role in national portfolio strategies for insurers across Canada.
Alberta is projected to be the fastest-growing provincial market through 2031, with a CAGR of 6.39%, fueled by energy sector exposure, infrastructure development, and population growth in Calgary and Edmonton. The catastrophe volatility experienced in 2024 emphasized the need for higher retentions, sublimits, and strict controls on risk accumulations, especially in hail and wildfire-prone areas. Auto insurance interventions led to collective underwriting losses in 2024, causing some carriers to exit or limit new business under the rate cap framework, which impacted market availability and competition. Alberta will transition to a care-first no-fault auto insurance model on January 1, 2027, changing claims handling and reserving practices, requiring extensive industry recalibration. In contrast, provinces like British Columbia, Manitoba, and Saskatchewan maintain public monopolies for basic auto coverage, with private carriers providing optional coverages. British Columbia has managed to keep premium increases moderate through regulated pricing and strict conduct standards overseen by the provincial regulator.
Competitive Landscape
The Canada property and casualty insurance market continues to show increasing concentration at the top, with the largest carriers holding a majority share and one leading company standing out prominently. Strategic consolidation has accelerated as insurers seek to modernize technology and manage the financial impacts of catastrophic events. Major players have also integrated vertically by expanding brokerage networks to gain direct customer access and capture additional revenue streams. Private equity-backed firms and national brokers are actively acquiring smaller agencies and managing general agents, reshaping the distribution landscape. Success in this evolving market increasingly depends on providing seamless digital experiences, data-driven underwriting, and resilience against weather-related volatility supported by robust reinsurance arrangements.
The market is rapidly adopting cloud-based policy administration, payments, and analytics platforms to enhance embedded distribution, automate claims processes, and manage catastrophes with greater precision. Digital payment integrations are enabling faster settlements and improving the customer experience, while direct-to-consumer digital channels continue to challenge traditional pricing models in sensitive product lines. Reinsurance terms remain selective despite some easing of pricing, with carriers that demonstrate sophisticated risk modeling securing more favourable renewal terms under regulatory guidance. Growth opportunities are emerging in specialty lines such as cyber insurance, surety for infrastructure projects, and parametric weather products. Additionally, insurers are increasingly layering services onto traditional risk transfer solutions to meet evolving customer needs.
Financial performance in the sector has stabilized as catastrophe-related burdens returned to more typical levels, with leading carriers reporting improved underwriting results and stronger capital positions. Regulatory focus remains on resilience through rigorous stress testing, model governance, and prudent reinsurance practices that align with evolving risk landscapes. As consolidation reshapes the top tier, mid-sized carriers differentiate themselves through specialized expertise, strong broker partnerships, and agility in quoting and binding coverage. The competitive environment in the coming period emphasizes controlled growth, expense management via automation, and disciplined rate adjustments in lines exposed to natural catastrophes. Overall, the market is adapting to balance scale, technology, and risk management in a dynamic and challenging environment.
Canada Property and Casualty Insurance Industry Leaders
Intact Financial Corporation
Desjardins General Insurance Group
Aviva Canada
TD Insurance
The Co-operators Group
- *Disclaimer: Major Players sorted in no particular order

Recent Industry Developments
- January 2026: Definity Financial Corporation announced that it has completed its acquisition of the personal insurance business and most of the commercial insurance operations of Travelers’ Canadian arm, marking a major milestone in its growth strategy and welcoming new team members into the company.
- January 2026: Beneva and Gore Mutual officially completed their merger, uniting two long-established Canadian mutual insurers. The merger enhances Beneva’s national footprint and strengthens its position in the property and casualty market by combining resources, expertise, and distribution networks.
- October 2025: HSB Canada, part of Munich Re, launched HSB CyberPro™, a new comprehensive cyber insurance product for Canadian businesses, providing broad, customizable coverage and risk‑management services through brokers. The solution includes specialized claims support, active threat monitoring, and tools to help firms respond to cyber-attacks and evolving regulatory and technological risks.
- August 2025: Desjardins Group signed a definitive agreement to acquire Guardian Capital Group Limited, a publicly traded global investment management company, for USD 1.7 billion, with expected closing by the end of Q1 2026, positioning Desjardins among asset management leaders and accelerating growth in Canada and internationally.


Research Methodology Framework and Report Scope
Market Definitions and Key Coverage
Our study defines Canada's property & casualty (P&C) insurance market as all direct premiums written in Canada that protect physical assets and cover third-party liability across personal, commercial, and specialty lines; this encompasses auto, property, liability, marine, aviation, cyber, and other non-life covers placed through licensed carriers and Lloyd's syndicates.
Life, accident & sickness, mortgage default, and out-of-country reinsurance transactions sit outside this scope.
Segmentation Overview
- By Line of Business
- Auto
- Personal Property
- Commercial Property
- Liability
- Specialty Lines (Marine, Aviation, Cyber, etc.)
- By Distribution Channel
- Brokers / Independent Agents
- Direct-to-Consumer
- Banks
- Others (Embedded & Affinity Partnerships, etc.)
- By End-user Industry
- Individuals & Households
- Small & Medium-sized Enterprises (SMEs)
- Large Corporations
- Public Sector & Non-Profits
- By Region
- Ontario
- Québec
- Alberta
- British Columbia
- Manitoba & Saskatchewan
- Atlantic Canada
- Northern Territories
Detailed Research Methodology and Data Validation
Primary Research
Mordor analysts held structured calls with underwriting heads, provincial brokers, and claims-management experts across Ontario, Alberta, Québec, and the Atlantic provinces. These conversations validated market-share shifts, embedded-insurance penetration, average selling prices, and expected rate-filing outcomes, filling gaps that secondary data alone could not close.
Desk Research
We began with publicly available regulatory filings from the Office of the Superintendent of Financial Institutions, provincial regulators, and Statistics Canada that disclose premium volumes, claim ratios, and solvency metrics; these provided the statutory starting point. Analysts then layered industry data from the Insurance Bureau of Canada, CatIQ catastrophe loss databases, and trade-association yearbooks such as the Canadian Independent Adjusters Association to capture loss-cost trends and weather-related impacts. Complementary inputs came from company annual reports, investor decks, and media coverage accessed via Dow Jones Factiva, while economic baselines, GDP, housing starts, and vehicle fleet growth were sourced from the Bank of Canada and CMHC. This list is illustrative, not exhaustive; many additional documents informed specific clarifications during modeling.
Market-Sizing & Forecasting
A top-down build starts with 2024 direct premium totals by line, converts them to U.S. dollars, and adjusts for IFRS-17 restatements before applying forecast drivers, housing completions, fleet additions, repair-cost inflation, catastrophe loss frequency, and cyber-attack incidence. Results are cross-checked through a selective bottom-up roll-up of carrier premium disclosures and sampled average-premium-per-policy figures, allowing us to fine-tune line items where statutory groupings mask specialty covers. Forecasts to 2030 rely on multivariate ARIMA models, and coefficients are benchmarked with consensus expectations surfaced in primary interviews. Where bottom-up visibility is thin (for example, embedded micro-policies), gap factors are back-solved so total written premium aligns with broker commission pools and reinsurer cession ratios.
Data Validation & Update Cycle
Outputs pass three filters: automated variance flags against historical series, peer-market cross-checks, and a second-analyst audit before sign-off. We refresh every twelve months; mid-cycle reviews trigger if NatCat losses or regulatory shifts move premiums by three percent or more.
Why Mordor's Canada Property And Casualty Insurance Industry Size - Market Report On Share, Growth Trends & Forecasts Analysis Baseline Commands Reliability
Published estimates often diverge because firms differ on currency translation, IFRS-17 treatment, and whether public auto insurers or embedded add-ons are inside scope.
Key gap drivers include Mordor's inclusion of specialty cyber premiums, use of forward exchange rates rather than spot, and an annual refresh cadence versus occasional project work elsewhere.
Benchmark comparison
| Market Size | Anonymized source | Primary gap driver |
|---|---|---|
| USD 95.76 B (2025) | Mordor Intelligence | - |
| CAD 74.79 B (2023) | Global Consultancy A | Excludes Lloyd's & public auto, uses calendar-year DPW only |
| CAD 80 B (2022 avg.) | Industry Association B | Omits specialty lines; pre-IFRS-17 figures |
| CAD 84.1 B (2022) | Regional Consultancy C | Currency not converted; reserve releases inflate base |
These comparisons show that Mordor's disciplined scope choices, currency normalization, and mixed-method checks deliver a balanced, transparent baseline that decision-makers can trace back to clear variables and repeatable steps.


Key Questions Answered in the Report
What is the size and growth outlook for the Canada property and casualty insurance market by 2031?
The Canada property and casualty insurance market size is USD 101.19 billion in 2026 and is projected to reach USD 133.32 billion by 2031 at a 5.67% CAGR, supported by disciplined underwriting, reinsurance, and expanding digital distribution.
Which segments lead share and which grow fastest within the Canada property and casualty insurance market?
Auto leads with 36.55% of 2025 premiums, while specialty lines are the fastest-growing segment with an 8.46% CAGR through 2031, reflecting digitalization and infrastructure cycles.
How are provincial regulations shaping auto profitability in the Canada property and casualty insurance market?
Alberta’s rate caps created structural unprofitability in 2024, and the province will transition to a care-first no-fault model in 2027, while Ontario’s July 2026 changes reduce mandatory benefits and shift some coverages to optional.
What distribution shifts are most impactful in the Canada property and casualty insurance market?
Brokers remain the largest channel with 54.23% share in 2025, while embedded and affinity partnerships are growing at a 9.02% CAGR as API-first architectures enable real-time rating and instant issuance in partner ecosystems.
Which provinces lead, and where is growth fastest in the Canada property and casualty insurance market?
Ontario holds 36.06% of premiums due to asset concentration and dense auto exposure, and Alberta is forecast to grow fastest at a 6.39% CAGR through 2031 as energy and infrastructure demand expand coverage needs.
How is AI changing operations in the Canada property and casualty insurance market?
AI improves fraud detection hit rates and accelerates claims through computer vision and NLP, while OSFI’s model risk rules, effective in 2027, guide governance and explainability for production models.
Page last updated on:


