Market Overview
| Study Period | 2020 - 2031 |
|---|---|
| Forecast Data Period | 2026 - 2031 |
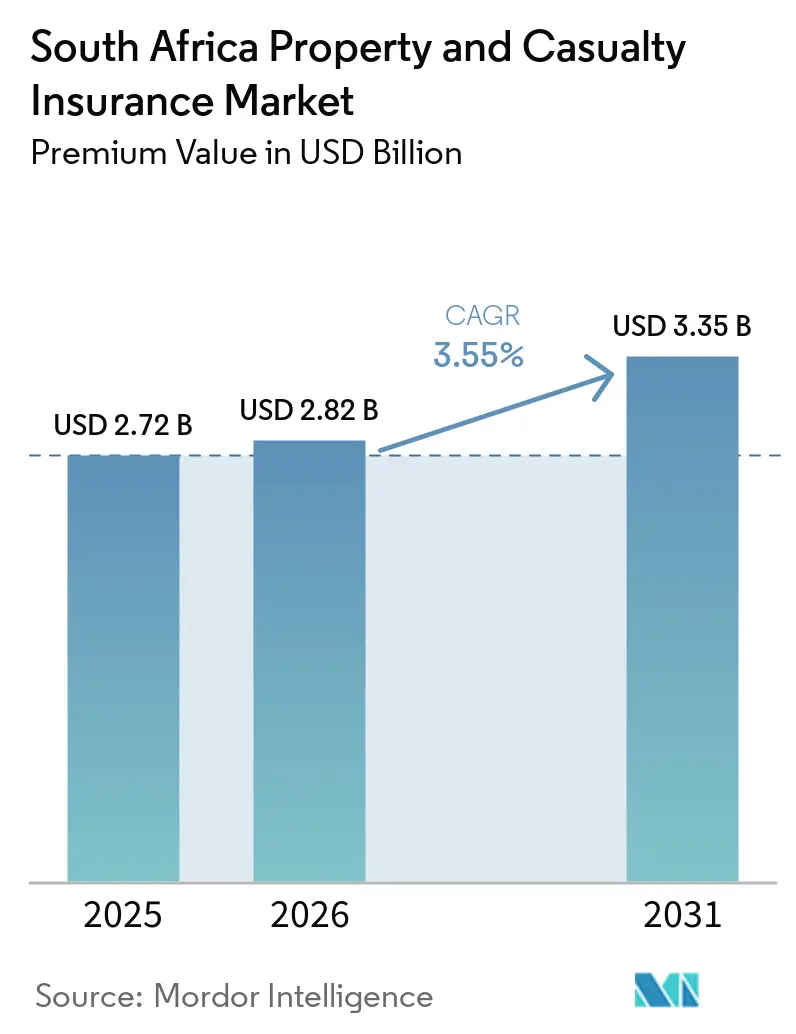
| Base Year Market Size (2025) | USD 2.72 Billion |
| Market Size (2026) | USD 2.82 Billion |
| Market Size (2031) | USD 3.35 Billion |
| Growth Rate (2026 - 2031) | 3.55% CAGR |
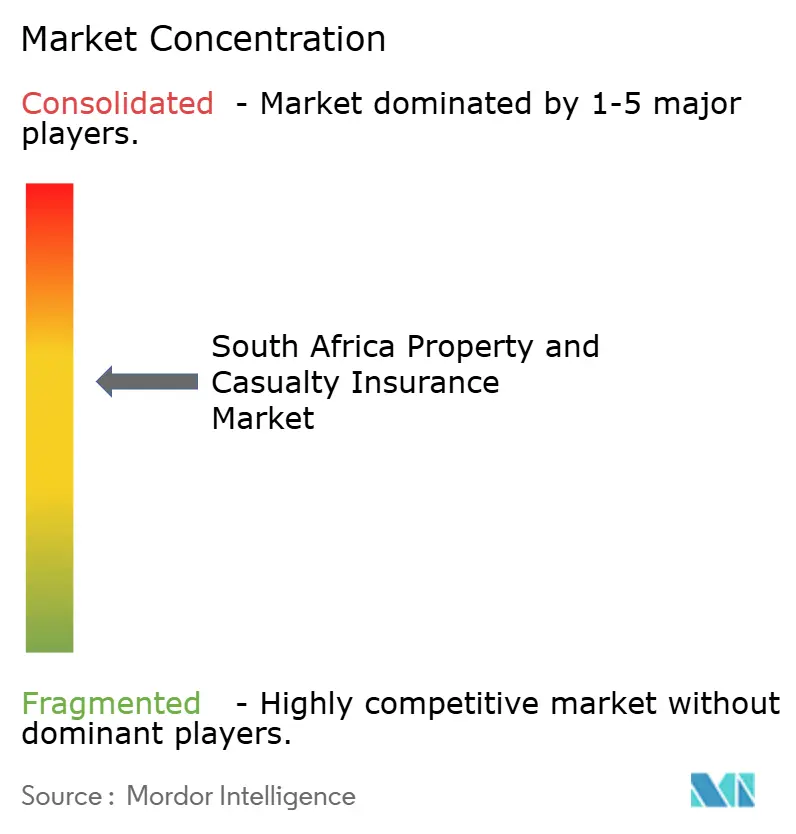
| Market Concentration | Medium |
Major Players *Disclaimer: Major Players sorted in no particular order Image © Mordor Intelligence. Reuse requires attribution under CC BY 4.0. | |
South Africa Property and Casualty Insurance Market Analysis by Mordor Intelligence
The South Africa Property And Casualty Insurance Market size in terms of premium value is expected to grow from USD 2.72 billion in 2025 to USD 2.82 billion in 2026 and is forecast to reach USD 3.35 billion by 2031 at 3.55% CAGR over 2026-2031.
Continued premium repricing, increasing catastrophe claims, and rising small-business demand sustain moderate growth despite persistent energy disruptions and reinsurance cost spikes. Transparent IFRS-17 reporting attracts capital and accelerates digital investment, while usage-based telematics and embedded policies reshape risk assessment and customer acquisition. Climate-driven infrastructure damage, higher motor parts theft, and mounting power surge losses are pushing insurers to redesign products, invest in real-time data, and seek parametric solutions. Competitive pressure is intensifying as digital-first carriers challenge incumbent brokers and large composite groups for profitable niches across the South Africa property and casualty insurance market.
Key Report Takeaways
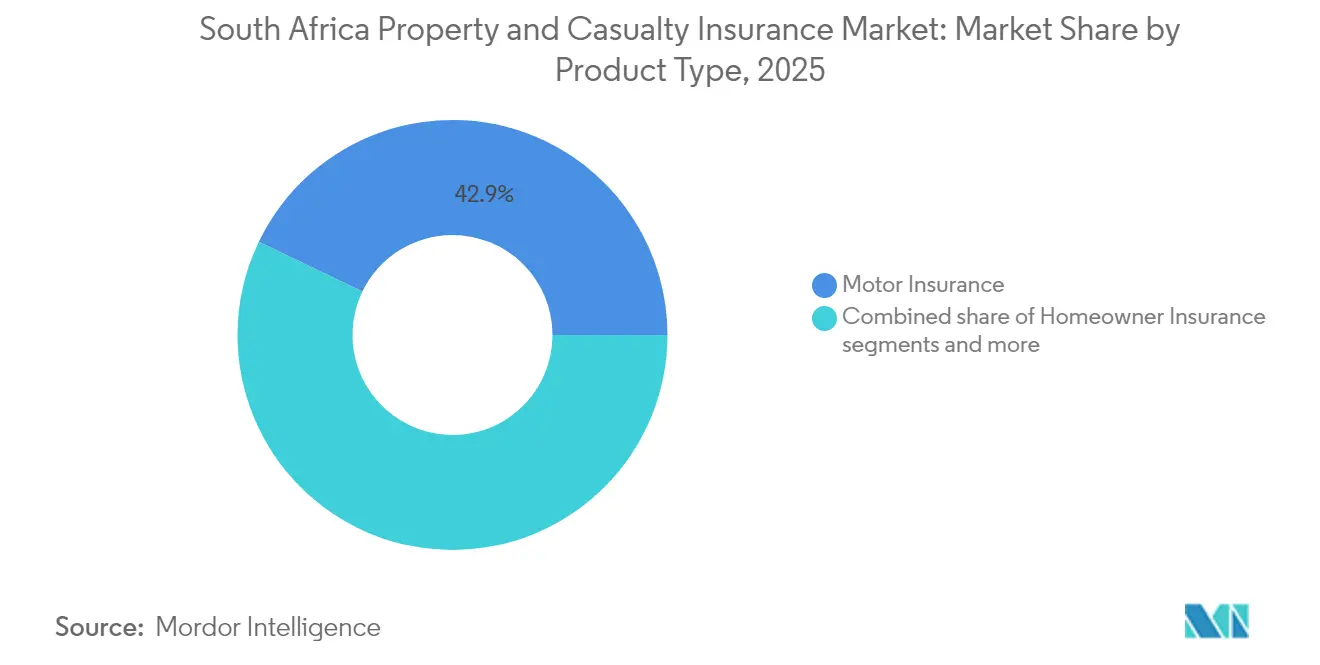
- By product type, motor insurance led with 42.85% of South Africa property and casualty insurance market share in 2025; liability insurance is forecast to expand at an 8.07% CAGR to 2031.
- By distribution channel, brokers held 44.85% share of the South Africa property and casualty insurance market size in 2025, while digital aggregators and InsurTechs record the highest projected CAGR at 4.48% through 2031.
- By customer type, individuals accounted for 55.10% of the South Africa property and casualty insurance market size in 2025; SMEs post the fastest growth at a 5.23% CAGR to 2031.
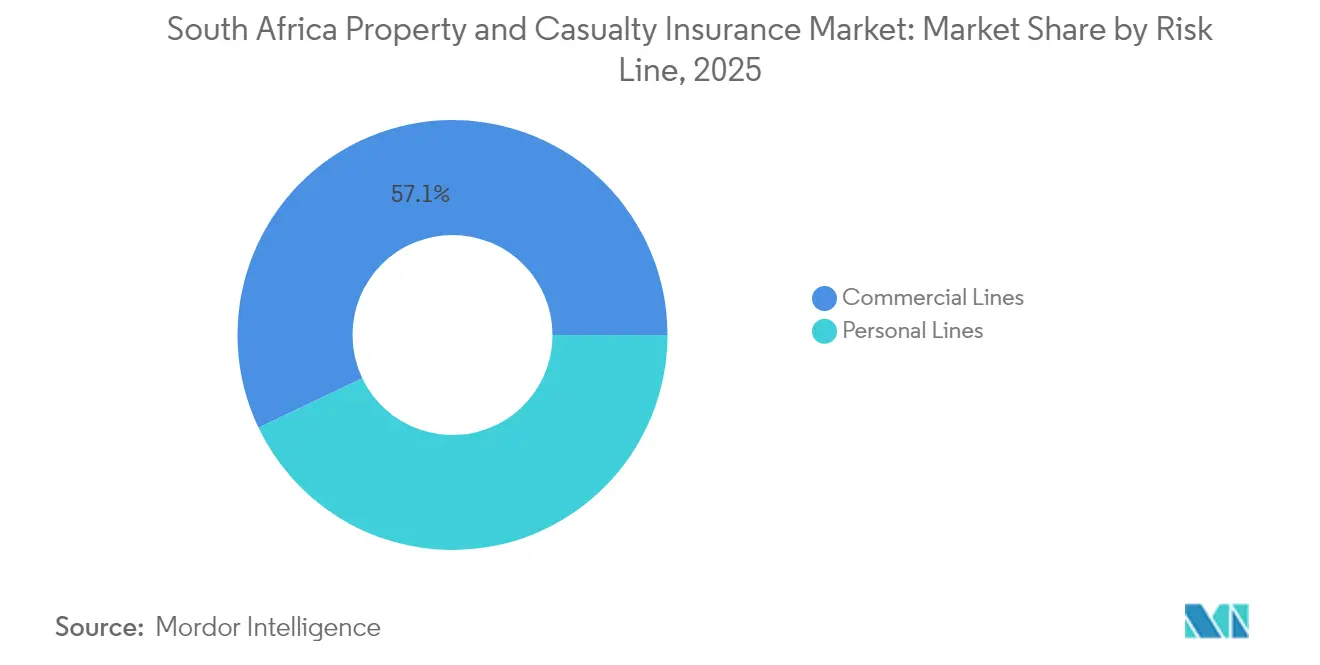
- By risk line, commercial lines commanded a 57.10% share of the South Africa property and casualty insurance market in 2025, but personal lines are advancing at a 6.32% CAGR through 2031.
- By region, Gauteng dominated with 44.95% revenue share in 2025, while Western Cape is forecast to expand at a 3.61% CAGR to 2031.
- Santam, Hollard, and Old Mutual jointly controlled more than half of gross written premiums in 2024, reinforcing mid-level concentration across the South Africa property and casualty insurance market.
Note: Market size and forecast figures in this report are generated using Mordor Intelligence’s proprietary estimation framework, updated with the latest available data and insights as of 2026.
South Africa Property and Casualty Insurance Market Trends and Insights
Drivers Impact Analysis*
| Driver | (~) % Impact on CAGR Forecast | Geographic Relevance | Impact Timeline |
|---|---|---|---|
| Motor-claims inflation prompts premium recalibration | +0.8% | National with focus on Gauteng and Western Cape | Medium term (2-4 years) |
| Infrastructure-related NatCat losses accelerate property cover demand | +0.6% | KwaZulu-Natal, Western Cape, Eastern Cape | Long term (≥ 4 years) |
| Rapid uptake of usage-based telematics and data analytics | +0.4% | Urban centers: Gauteng, Western Cape, KwaZulu-Natal | Short term (≤ 2 years) |
| Fleet electrification creating new motor-risk pools | +0.3% | Gauteng corridors, Western Cape logistics hubs | Medium term (2-4 years) |
| Embedded insurance partnerships with e-commerce ecosystems | +0.2% | National urban markets | Short term (≤ 2 years) |
| IFRS-17 transparency boosting investor appetite | +0.1% | Nationwide | Medium term (2-4 years) |
| Source: Mordor Intelligence | |||
Motor-claims inflation prompts premium recalibration
Parts inflation, labor cost spikes, and longer repair cycles are forcing carriers to raise motor premiums faster than general consumer prices. Swiss Re notes that global motor repricing has reached cyclical peaks, and South African insurers mirror the trend as claims severity climbs. Theft-for-parts exacerbates losses, compelling tighter geographic underwriting and data-driven pricing. The insurance and financial services CPI rose 0.9% month on month in January 2025, confirming persistent pressure on household budgets [1]Statistics South Africa, “Consumer Price Index January 2025,” statssa.gov.za. Usage-based policies now reward low-risk drivers, and carriers that calibrate telematics data effectively defend margins while differentiating on price.
Infrastructure-related NatCat losses accelerate property cover demand
Successive storms and floods culminating in a national disaster declaration in November 2024 spotlight South Africa’s infrastructure vulnerability [2]Insurance Journal Staff, “South Africa Declares National Disaster After Severe Floods,” insurancejournal.com. Swiss Re estimates USD 280 billion in 2023 global NatCat losses, reinforcing the urgency to close emerging-market protection gaps. Insurers respond with parametric triggers that shorten settlement cycles and enhance customer trust. Government consultation with the World Bank on climate-risk financing signals forthcoming public-private schemes that could enlarge premium pools. Businesses increasingly treat comprehensive property cover as a prerequisite for operational continuity.
Rapid uptake of usage-based telematics and data analytics
Discovery’s shared-value model illustrates how real-time driving data can cut claims and improve client engagement. Old Mutual Insure’s partnership with Sapiens shows industry-wide acceleration of predictive analytics to refine underwriting. Telematics expands into fleet management, providing insurers with diversified revenue and cross-selling avenues. Broader applications, such as home sensors, enhance property risk visibility and customer retention. Data privacy rules and consumer attitudes will govern adoption speed, yet early movers are already capturing behaviour-based discounts and loyalty benefits.
Fleet electrification creating new motor-risk pools
Commercial operators signal rising interest in electric vehicles, with 38% of paratransit firms willing to adopt once reliable units become available. Battery repair costs, specialized parts, and cyber threats require bespoke coverage structures. Insurers that collaborate with charging-infrastructure providers can offer bundled risk and maintenance packages. Lack of historical claims data presents pricing difficulty, but carriers that develop actuarial models early will win market share as fleets decarbonize. Corporate sustainability targets add momentum to the South Africa property and casualty insurance market transition.
Restraints Impact Analysis*
| Restraint | (~) % Impact on CAGR Forecast | Geographic Relevance | Impact Timeline |
|---|---|---|---|
| Escalating theft-for-parts and hijacking rates weigh on loss ratios | -0.7% | Gauteng, KwaZulu-Natal, Eastern Cape | Short term (≤ 2 years) |
| Load-shedding-driven claims spike erodes underwriting margins | -0.5% | Nationwide with industrial clusters | Medium term (2-4 years) |
| Rising reinsurance costs amid global NatCat cycle | -0.3% | National | Long term (≥ 4 years) |
| Persistent insurance fraud and ghost-broking rings | -0.2% | Urban centers | Medium term (2-4 years) |
| Source: Mordor Intelligence | |||
Escalating theft-for-parts and hijacking rates weigh on loss ratios
Organized crime syndicates target high-value vehicle components, driving projected USD 189 million in annual fraud exposure[3]Insurance Journal Staff, “South Africa Declares National Disaster After Severe Floods,” insurancejournal.com. Geographic clustering around highway exit nodes forces granular rating approaches. Advanced telematics combined with recovery tech mitigates claims, yet some carriers now exclude persistent hotspots or impose excess layers. Collaboration with law enforcement and security firms is critical to curb losses and protect affordability in the South Africa property and casualty insurance market.
Load-shedding-driven claims spike erodes underwriting margins
Discovery Insure recorded a 50% surge in power surge claims over six months during intensified stage-6 outages. Business interruption, spoilage, and electronics failures magnify property and engineering line exposures. Constantia Insurance cautions that a total blackout could overwhelm industry capital buffers. Carriers introduce surge-protection compliance clauses and explore parametric triggers tied to grid-downtime thresholds. Generators and battery-backup installations shift risk profiles but raise moral-hazard concerns if poorly maintained.
*Our forecasts treat driver/restraint impacts as directional, not additive. The impact forecasts reflect baseline growth, mix effects, and variable interactions.
Segment Analysis
By Product Type: Motor Insurance Dominance Faces Liability Growth
Motor insurance generated 42.85% of total written premiums in 2025, securing the largest slice of the South Africa property and casualty insurance market. Mandatory third-party cover and the country’s car-dependent mobility sustain solid volume, yet claims inflation and electric-vehicle adoption are reshaping profitability. Usage-based telematics enables finer risk pricing and encourages safe driving behaviours that lower loss costs. Liability policies, by contrast, deliver the fastest 8.07% CAGR as professional indemnity, cyber, and product-recall exposures expand across service and manufacturing sectors. Demand for parametric weather covers also supports agriculture and property sublines.
Continued urban expansion feeds homeowner and contents insurance, while infrastructure investment spurs commercial property cover across logistics corridors. Agriculture weather products gain relevance as drought and flood patterns intensify, adding premium diversity to the South Africa property and casualty insurance market. Specialized marine and aviation segments benefit from Durban and Cape Town port activities that channel regional trade flows. Liability’s robust trajectory reflects heightened litigation awareness and regulatory scrutiny, prompting firms with AI-driven operations to seek bespoke policy extensions.


By Distribution Channel: Brokers Lead While Digital Disrupts
Brokers maintained 44.85% of premium flows in 2025, underscoring their role in structuring complex corporate covers and advising family offices. Relationship depth, claims advocacy, and compliance expertise reinforce their stickiness within the South Africa property and casualty insurance market. Digital aggregators and InsurTechs, expanding at 4.48% annually, chip away at commoditized lines such as motor and gadget cover through instant quotes and behavioural pricing. Bancassurance continues to cross-sell via integrated mobile banking apps, while agents modernize through customer-relationship tools and real-time quoting engines.
Embedded insurance emerges as the most disruptive pathway by inserting opt-in cover at the checkout stage of e-commerce purchases. Consumers opt for convenience and transparent micro-premiums, effectively bypassing traditional acquisition costs. Insurers respond by adopting open-API architectures that plug products into retailer, airline, and fintech ecosystems. The distribution mix hence pivots toward omnichannel strategies that match product complexity with the right advice or digital speed.
By Customer Type: Individual Dominance Meets SME Acceleration
Individuals generated 55.10% of 2025 premiums, supported by compulsory motor cover and rising household wealth. Digital tools empower price comparison, and behaviour-based discounts reward safe practice, lifting retention and cross-sell ratios. SMEs, advancing at a 5.23% CAGR, reflect heightened risk awareness around load-shedding, cyberattacks, and supply-chain disruptions. Simplified package policies attract first-time buyers seeking combined cover for property, liability, and interruption risks.
Large corporates require bespoke programmes combining local policies with multinational master wording, especially for cross-border projects. Public-sector entities purchase catastrophe and terrorism cover to safeguard essential services. Micro-enterprises and low-income households remain underinsured outside of funeral plans, though regulatory support for inclusive products could unlock latent demand, thereby enlarging the South Africa property and casualty insurance market.
By Risk Line: Commercial Strength Balances Personal Growth
Commercial lines held 57.10% revenue share in 2025, anchored by complex liability, engineering, and property portfolios for mining, manufacturing, and logistics groups. ESG reporting pressures stimulate cover for climate and social impacts, while supply-chain complexities necessitate contingent-business interruption solutions. Personal lines show a brisk 6.32% CAGR as mid-income consumers add homeowners, contents, and travel policies. Telematics and smartphone claims reporting enhance convenience, improving satisfaction scores.
Cross-selling between personal and commercial lines accelerates as entrepreneurs bundle vehicle and small-business assets under unified dashboards. Institutions leverage data lakes to refine segmentation, supporting profitable tail-risk selection. The balanced risk mix stabilizes overall volatility for carriers active across both segments in the South Africa property and casualty insurance market.
Geography Analysis
Gauteng contributes 44.95% of national premiums in 2025, driven by the Johannesburg-Pretoria economic corridor and a high concentration of corporate headquarters. Advanced financial services activities spur complex liability and cyber demand, while dense traffic volumes sustain motor premium pools. Load-shedding poses outsized interruption risks to data centers and manufacturers, pushing policy uptake for specialized equipment and downtime endorsements.
Western Cape, with a projected 3.61% CAGR through 2031, benefits from revitalized tourism, growing tech clusters, and port upgrades. High-value residential developments along the Atlantic Seaboard create premium personal lines opportunities. Coastal flood and drought events heighten the need for parametric climate solutions, extending the reach of the South Africa property and casualty insurance market in the province.
KwaZulu-Natal’s industrial belt and Durban port drive marine, cargo, and heavy-industry cover, although the 2022 flood recovery raises pricing for property and engineering policies. Agricultural insurance gains traction across sugarcane estates. Eastern Cape sees renewable-energy investments and auto assembly expansion, fostering combined property and machinery protection. Interior provinces remain reliant on mining and agribusiness risk, yet infrastructure corridor funding may attract new entrants as niche specialists.
Competitive Landscape
The market remains moderately concentrated, with Santam, Hollard, and Old Mutual Insure collectively producing more than 50% of written premiums in 2024. Santam posted USD 1.78 billion in turnover, retaining scale advantages in distribution and reinsurance procurement. Hollard bolsters regional diversification through the pending purchase of Absa’s Mozambique, Botswana, and Zambia units, while Old Mutual Insure deploys advanced analytics via its Sapiens roll-out to sharpen pricing and claims fraud detection.
Digital-native players such as OUTsurance and Pineapple attract younger demographics with app-based onboarding and rapid payouts, pressuring incumbents to accelerate process automation. Western National Insurance secures three consecutive Non-Life Insurer of the Year Commercial awards by focusing on broker partnerships and superior service, illustrating that niche excellence thrives alongside scale. Regulatory actions totalling USD 51 million in fines during 2024 reinforce that governance and compliance capabilities are non-negotiable for sustainable growth within the South Africa property and casualty insurance market.
Strategic priorities include telematics ecosystem alliances, climate-risk product design, and regional expansion into high-growth Southern African economies. Carriers able to combine deep capital pools with data-centric operating models stand positioned to protect margins while meeting emerging client expectations for transparent, real-time service.
South Africa Property and Casualty Insurance Industry Leaders
Santam
Hollard
Old Mutual Insure
OUTsurance
Momentum Insure
- *Disclaimer: Major Players sorted in no particular order

Recent Industry Developments
- March 2025: Standard Bank Group reported ZAR 45 billion (USD 2.43 billion) headline earnings, with the insurance business contributing ZAR 3.3 billion (USD 34 million) and Liberty integration synergies exceeding ZAR 620 million.
- March 2025: Old Mutual Insure selected Sapiens for a comprehensive data-and-analytics platform deployment.
- February 2025: Sanlam Limited announced 2024 headline earnings per share growth of 30-40%.
- November 2024: South Africa declared a national disaster after severe multi-province floods, triggering large property-catastrophe claims.


Research Methodology Framework and Report Scope
Market Definitions and Key Coverage
Our study defines the South African property and casualty insurance market as the total gross written premiums from all non-life covers, motor, homeowner, home-contents, commercial property, liability, agriculture, marine, aviation, and other specialist lines, underwritten by licensed insurers within the country. Liability for third-party injury or damage is included, while life, health, pension, reinsurance cessions, and captive premiums are excluded.
Scope Exclusion: credit-life and funeral policies remain outside the present analysis.
Segmentation Overview
- By Product Type
- Motor Insurance
- Homeowner Insurance
- Home-Content Insurance
- Commercial Property
- Liability (General, Professional, D&O)
- Agriculture & Weather
- Marine, Aviation & Transport
- By Distribution Channel
- Brokers
- Agents
- Banks (Bancassurance)
- Direct-to-Consumer
- Digital Aggregators & InsurTechs
- By Customer Type
- Individuals
- SMEs
- Large Corporates
- Public-sector / SOEs
- By Risk Line (Personal vs Commercial)
- Personal Lines
- Commercial Lines
- By Region
- Gauteng
- Western Cape
- KwaZulu-Natal
- Eastern Cape
- Rest of South Africa
Detailed Research Methodology and Data Validation
Primary Research
Mordor analysts held interviews with underwriting heads, claims managers, broker principals, and insurtech founders across Gauteng, the Western Cape, and KwaZulu-Natal. The discussions verified distribution-mix shifts, average claims severity, and forthcoming regulatory tweaks, closing gaps left by public data.
Desk Research
We first built the foundation with open data from the Financial Sector Conduct Authority, Prudential Authority quarterly returns, Statistics South Africa macro series, National Treasury budget papers, and South African Insurance Association fact sheets. D&B Hoovers and Dow Jones Factiva supplemented company filings and news flow, while peer-reviewed journals on NatCat losses and new-vehicle sales releases fleshed out trend indicators. These sources are illustrative; numerous additional references supported data collection and validation.
Market-Sizing & Forecasting
We combined a top-down reconstruction of gross written premiums from regulator filings with selective bottom-up sanity checks on channel splits and sampled average premium per policy. Key drivers include new-vehicle registrations, building-plan approvals, CPI-adjusted repair costs, NatCat loss ratios, broker commission trends, and digital-aggregator penetration. A multivariate regression projects each driver under base, upside, and downside scenarios; the weighted scenario feeds the five-year forecast. Data voids in smaller lines were bridged through expert-confirmed penetration rates.
Data Validation & Update Cycle
Outputs face variance checks against macro indicators and historic loss ratios before a two-stage peer review. Reports refresh annually, with interim updates for material events so clients receive the latest view.
Why Mordor's Property And Casualty Insurance Market In South Africa Size & Share Analysis Baseline Commands Reliability
Published estimates often diverge because firms differ on segment scope, currency conversion, and refresh cadence. Our disciplined variable selection and annual modelling deliver a balanced, traceable mid-point that decision-makers can repeat with confidence.
Key Gap Drivers include whether personal-accident add-ons are counted, life hybrids included, reinsurer shares removed, and the exchange-rate vintage applied at conversion.
Benchmark comparison
| Market Size | Anonymized source | Primary gap driver |
|---|---|---|
| USD 2.72 B (2025) | Mordor Intelligence | - |
| USD 5.32 B (2024) | Regional Consultancy A | Combines life-linked riders and levies |
| USD 5.20 B (2023) | Industry Portal B | Uses 2021 exchange rate and omits policy lapses |
| USD 9.00 B (2025) | Global Consultancy C | Aggregates wider Sub-Saharan premium pool with fixed 6 % CAGR |
The comparison shows that Mordor's rigor, timely refresh, and clear scope produce the most dependable baseline for South African P&C strategy planning.


Key Questions Answered in the Report
What is the current size of the South Africa property and casualty insurance market?
The market is valued at USD 2.82 billion in 2026 and is forecast to reach USD 3.35 billion by 2031.
Which product line holds the largest share in the South Africa property and casualty insurance market?
Motor insurance leads with 42.85% of total written premiums in 2025.
Which segment is growing fastest by distribution channel?
Digital aggregators and InsurTech platforms are expanding at a 4.48% CAGR through 2031.
How is load shedding affecting insurance claims?
Power-surge and related interruption claims rose 50% over six months, significantly squeezing property underwriting margins.
Which province is projected to grow quickest?
Western Cape is expected to expand premiums at a 3.61% CAGR between 2026 and 2031 due to tourism recovery and infrastructure projects.
Who are the leading insurers in South Africa’s property and casualty space?
Santam, Hollard, and Old Mutual Insure collectively write more than half of national premiums, with Santam alone posting ZAR 33 billion turnover in 2024.
Page last updated on:


