Produce Packaging Market Size and Share
Market Overview
| Study Period | 2020 - 2031 |
|---|---|
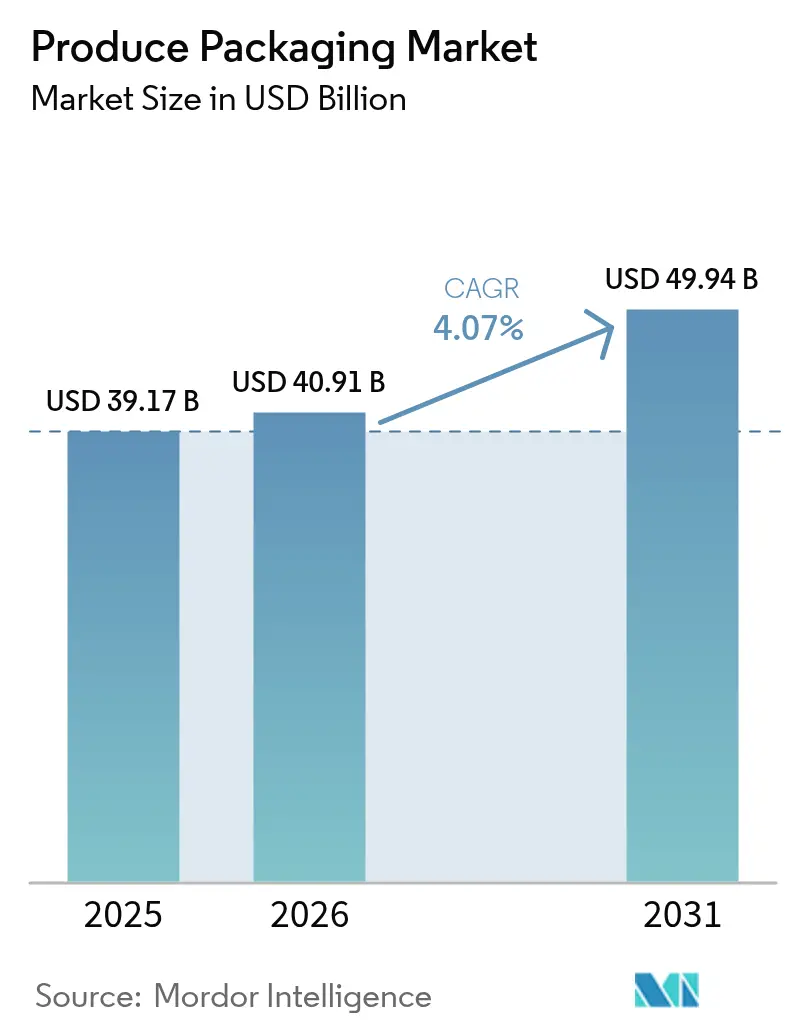
| Market Size (2026) | USD 40.91 Billion |
| Market Size (2031) | USD 49.94 Billion |
| Growth Rate (2026 - 2031) | 4.07% CAGR |
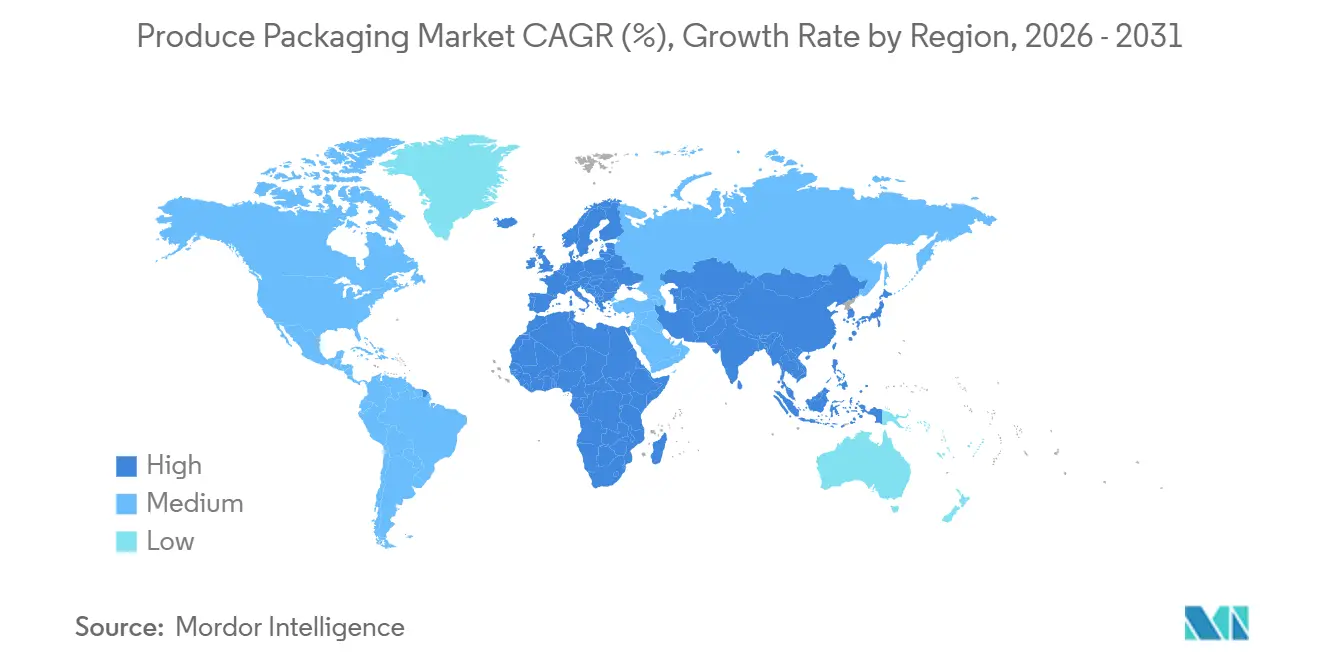
| Fastest Growing Market | Middle East |
| Largest Market | Asia-Pacific |
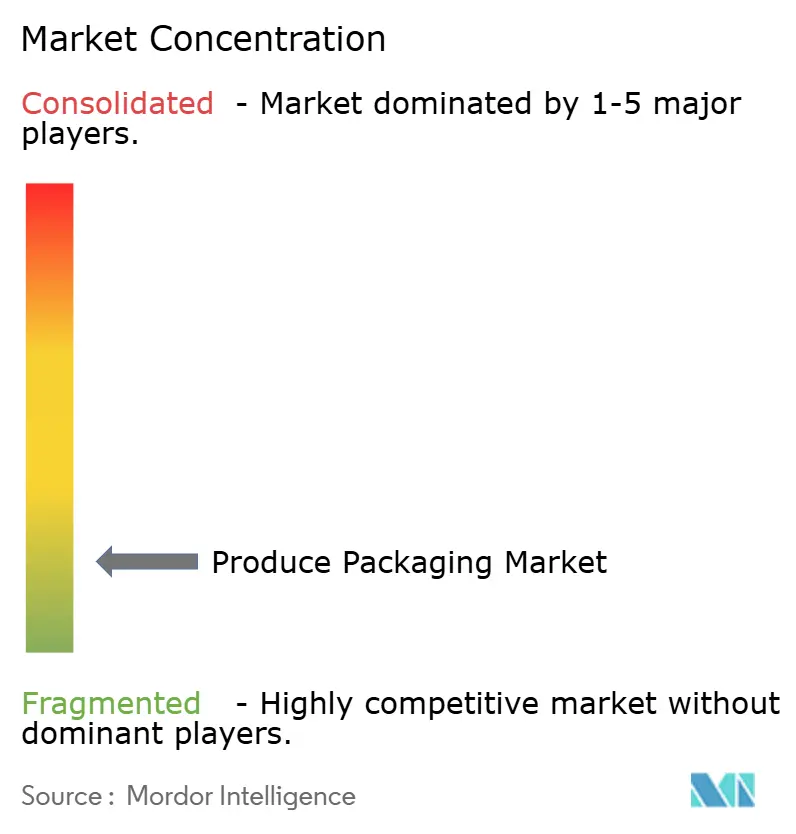
| Market Concentration | Low |
Major Players *Disclaimer: Major Players sorted in no particular order Image © Mordor Intelligence. Reuse requires attribution under CC BY 4.0. | |
Produce Packaging Market Analysis by Mordor Intelligence
The produce packaging market size is projected to expand from USD 39.17 billion in 2025 and USD 40.91 billion in 2026 to USD 49.94 billion by 2031, registering a CAGR of 4.07% between 2026 to 2031. The growth path reflects a steady realignment of supply-chain priorities as retailers, growers, and converters focus on extending shelf life, safeguarding food safety, and optimizing packs for omnichannel distribution. Convenience-driven purchases, tighter cold-chain links, and mounting sustainability mandates combine to accelerate technology adoption, especially in modified-atmosphere and antimicrobial formats. Brand owners are also reshaping pack aesthetics, using clear windows, QR codes, and minimal-ink graphics to signal freshness while curbing material usage. As a result, capital expenditure on advanced forming, coating, and digital printing lines is rising, with large converters locking in multiyear supply contracts to defend margins against raw-material volatility.
Key Report Takeaways
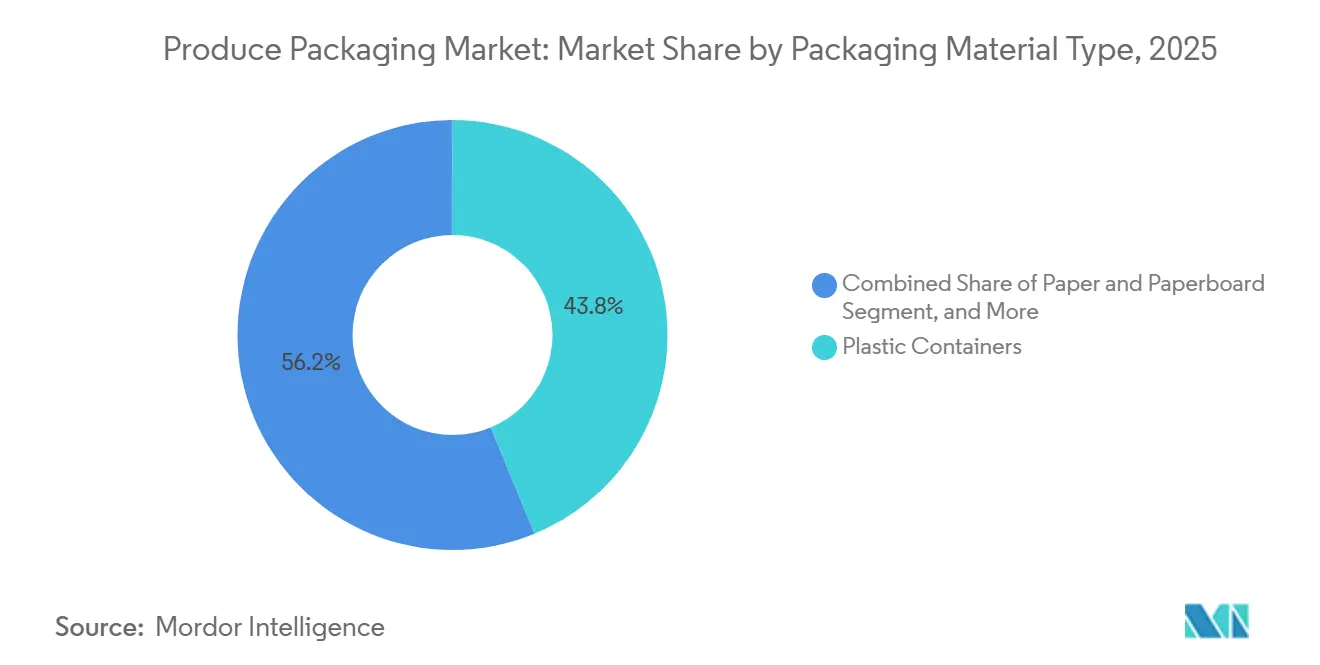
- By packaging material, plastic containers led with 43.76% of the produce packaging market share in 2025, while bioplastics were the fastest-growing material at a 5.43% CAGR through 2031.
- By pack type, flexible formats commanded 47.23% of the produce packaging market in 2025 and are expanding at a 4.62% CAGR through 2031.
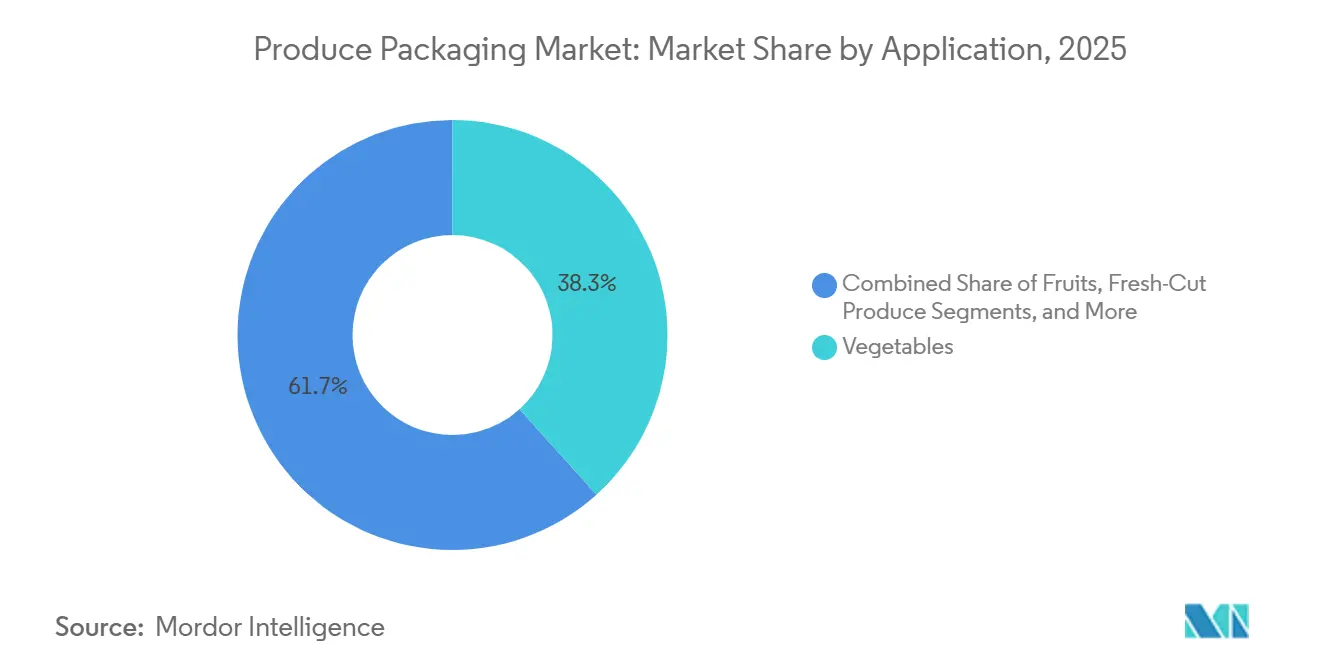
- By application, vegetables accounted for 38.32% of the produce packaging market size in 2025, whereas organic produce is advancing at a 5.09% CAGR through 2031.
- By technology, modified-atmosphere packaging held 42.41% of the produce packaging market share in 2025, and edible and biodegradable coatings posted the highest projected CAGR at 5.04% to 2031.
- By geography, Asia-Pacific captured 33.92% of the produce packaging market share in 2025, while the Middle East is forecast to post a 5.11% CAGR over 2026-2031.
Note: Market size and forecast figures in this report are generated using Mordor Intelligence’s proprietary estimation framework, updated with the latest available data and insights as of 2026.
Global Produce Packaging Market Trends and Insights
Drivers Impact Analysis*
| Driver | % Impact on CAGR Forecast | Geographic Relevance | Impact Timeline |
|---|---|---|---|
| Surge In Convenience-Oriented Fresh Produce Demand | +1.2% | Global, Concentrated In North America And Europe | Medium Term (2–4 Years) |
| Rapid Uptake Of Modified-Atmosphere And Antimicrobial Films | +1.0% | Asia-Pacific And North America | Short Term (≤ 2 Years) |
| Expansion Of Global Fresh Produce E-Commerce And Cold-Chain Logistics | +0.9% | Asia-Pacific Core, Spillover To Middle East And South America | Medium Term (2–4 Years) |
| Sustainability Mandates Boosting Paper-Based And Compostable Formats | +0.7% | Europe And North America, Emerging In Asia-Pacific | Long Term (≥ 4 Years) |
| Stricter Food Safety And Traceability Regulations | +0.6% | Global, With Early Adoption In Europe And North America | Short Term (≤ 2 Years) |
| Automation And Robotics Lowering Unit Packing Costs For Growers | +0.5% | North America And Europe, Expanding To Asia-Pacific | Medium Term (2–4 Years) |
| Source: Mordor Intelligence | |||


Surge in Convenience-Oriented Fresh Produce Demand
Rising urban lifestyles are driving demand for pre-washed, cut, and portion-controlled packs that reduce preparation time and household waste. United States Department of Agriculture data showed that fresh-cut produce sales reached USD 18.3 billion in 2025, an 11% increase from 2024. Shoppers gravitate toward micro-perforated films that manage moisture and prevent enzymatic browning, and toward transparent rigid trays that highlight freshness in grab-and-go fixtures. Indian metro retailers rolled out value-added trays in 2025 to satisfy growing hygiene concerns among middle-class consumers. Convenience formats also align with sustainability goals because they often deliver right-sized portions that reduce spoilage at home.
Rapid Uptake of Modified-Atmosphere and Antimicrobial Films
Tailored gas blends inside MAP pouches slow respiration, allowing fruit and vegetable exporters to serve distant markets without compromising quality. Sealed Air logged 23% volume growth for its Cryovac MAP solutions in 2025 on the back of berry-sector contracts in North America. Complementary antimicrobial layers containing silver ions or essential oils suppress pathogen growth; a Food Control study noted a 99.7% reduction in Salmonella on tomatoes when thyme-oil polyethylene film was used. Although the European Food Safety Authority now requires migration testing for nanomaterial-based films, converters targeting the European Union accept the extra compliance cost to unlock premium retailer programs.[1]European Food Safety Authority, “Updated Guidance on Nanomaterials,” EFSA Journal, efsa.europa.eu
Expansion of Global Fresh Produce E-Commerce and Cold-Chain Logistics
Digital grocery platforms that gained traction during the pandemic retain high order rates, and fresh produce remains critical for repeat purchases. Alibaba’s Freshippo unit reported a 34% upturn in online fruit and vegetable orders during 2025, prompting investments in automated micro-fulfillment centers with climate-controlled zones.[2]Alizila Staff, “Freshippo Produce Orders Surge,” Alibaba Group, alizila.com Packs engineered for last-mile delivery use corrugated trays with shock-absorbing inserts and vacuum-skin films that minimize headspace. Governments in the Gulf region co-invest in refrigerated warehousing; the United Arab Emirates committed USD 1.2 billion in 2025 to lift cold-store capacity by 40%. Where refrigeration gaps persist, packaging acts as a critical buffer against temperature swings that still degrade quality in transit.
Sustainability Mandates Boosting Paper-Based and Compostable Formats
Regulators and retailers push converters to pivot away from conventional plastic toward recyclable or compostable choices. The European Union Packaging and Packaging Waste Regulation that took effect in 2025 requires 70% of packs to be recyclable or compostable by 2030.[3]European Commission, “Packaging and Packaging Waste Regulation,” ec.europa.eu Mondi’s paper punnet for berries entered 15 European markets in 2025 and meets EN 13432 rules even though unit cost sits 12% higher than the polystyrene it replaced. In North America, California’s Senate Bill 54 introduces producer-responsibility fees beginning January 2026, spurring rapid reformulation of adhesives to secure ASTM D6400 certification.
Restraints Impact Analysis*
| Restraint | % Impact on CAGR Forecast | Geographic Relevance | Impact Timeline |
|---|---|---|---|
| Volatile Polymer And Paper Input Prices | -0.8% | Global, Acute In Importing Regions | Short Term (≤ 2 Years) |
| Regulatory Bans And Taxes On Single-Use Plastics | -0.6% | Europe And North America, Select Asia-Pacific Markets | Medium Term (2–4 Years) |
| High Capital Cost Of Next-Generation Sustainable Materials And Machinery | -0.4% | Global, Skewed Toward Small And Mid-Sized Firms | Long Term (≥ 4 Years) |
| Post-Harvest Loss Risk From Packaging Specification Errors | -0.3% | Global, Pronounced In Emerging Markets | Short Term (≤ 2 Years) |
| Source: Mordor Intelligence | |||
Volatile Polymer and Paper Input Prices
Crude-oil swings drove resin prices up to 35% in 2024, while paperboard rose 22% on fiber shortages. Small converters lacking hedging tools or volume contracts experienced margin compression that triggered consolidation waves. Frequent re-pricing disrupted grower-packer contracts, delaying roll-outs of new packaging that carries higher material cost. Currency shifts worsened instability for exporters purchasing inputs in EUR or USD while selling in local currencies. While large multinationals weather volatility through scale, sustained price turbulence restrains investment in sustainable innovation within the produce packaging market.
Regulatory Bans and Taxes on Single-Use Plastics
California outlawed expanded polystyrene clamshells for produce in July 2025, eliminating a format that once held 18% of the state’s berry segment.[4]California Department of Resources Recycling and Recovery, “Expanded Polystyrene Ban,” calrecycle.ca.gov The European Single-Use Plastics Directive imposes fines of up to EUR 50,000 (USD 56,500) per infraction, prompting retailers to demand verified alternatives. Indian states expanded plastic carry-bag bans to include thin-gauge produce films, adding complexity for converters serving multiple regions. Divergent definitions of compostability raise compliance costs and slow material rollouts.
*Our forecasts treat driver/restraint impacts as directional, not additive. The impact forecasts reflect baseline growth, mix effects, and variable interactions.
Segment Analysis
By Packaging Material Type: Bioplastics Gain Amid Plastic Dominance
Plastic containers retained 43.76% of the produce packaging market share in 2025, largely because clear polyethylene terephthalate clamshells showcase berries and cherry tomatoes while surviving high-speed pack lines. Bioplastics, though still niche, post a 5.43% CAGR thanks to retailer scorecards that favor compostable or recyclable packs. Amcor doubled production of its PLA berry punnet line in Europe during 2025 as supermarket chains aligned sustainability branding with shopper demand. Paper and corrugated formats find traction in dryer produce categories such as potatoes, while molded pulp trays appear in mushroom aisles where breathability outweighs transparency.
Regulation shapes the material field. ASTM D6400 and EN 13432 standards require third-party testing at a cost of upwards of USD 20,000 per formulation, creating financial barriers for smaller innovators. Paper coatings that once relied on fluorochemicals are switching to water-based dispersions after the U.S. Food and Drug Administration flagged potential PFAS migration in 2025. Raw-material sourcing also shapes regional market dynamics, as PLA resin plants cluster in the U.S. Midwest, while polyhydroxyalkanoate supply hinges on fermentation units in Southeast Asia.


By Pack Type: Flexible Formats Lead on Efficiency
Flexible pouches captured 47.23% revenue in 2025 and are growing at 4.62% through 2031, as they require up to 70% less polymer than equivalent rigid tubs and run on vertical form-fill-seal equipment that cuts labor cost by nearly one-third. Rigid clamshells, though more material-intensive, remain the standard for premium berries and fresh-cut salads that require robust crush protection and shelf impact resistance. Semi-rigid thermoforms offer middle-ground economics and add tamper-evident features valued by retailers battling shrink.
E-commerce accelerates the shift toward flexibility because small, lightweight packs reduce dimensional-weight fees, yet laminated structures often frustrate recycling. The Association of Plastic Recyclers issued a mono-material polyethylene design guide in 2025 to solve that challenge. Rigid PET and polypropylene enjoy mature recycling streams, though food-soil contamination reduces actual recovery rates to below 30%. Bio-based PET grades are entering semi-rigid trays and claim a carbon footprint reduction of almost 40% compared to fossil-based equivalents.
By Application: Organic Produce Drives Premium Packaging
Vegetables accounted for 38.32% of the produce packaging market in 2025, on account of their inherently shorter shelf life and moisture-loss sensitivity. Organic produce, growing at a 5.09% CAGR, is driving the adoption of compostable films because post-harvest fungicides are prohibited. Whole Foods Market cited 19% year-over-year organic produce growth in 2025 and is asking suppliers to migrate to certified compostable or recyclable packs by 2027. Fresh-cut fruit and vegetable medleys demand the highest barrier protection, pushing vacuum-skin packaging into mainstream use.
Exotic and specialty crops such as dragon fruit and heirloom tomatoes rely on traceability messaging to validate premium prices. Packaging Corporation of America embedded QR codes into fiber trays in 2025, enabling end-buyers to view farm-level data, which resonated with transparency-oriented shoppers. Seasonal spikes, especially in berries, obligate converters to maintain flexible capacity and inventory multipurpose tooling that pivots between pack formats as harvest flows shift.
By Technology: Edible Coatings Emerge as Disruptive Alternative
Modified-atmosphere systems accounted for 42.41% of the produce packaging market share in 2025, built on decades of refinements to film permeability that align oxygen and carbon dioxide ratios with crop physiology. Edible coatings are rising at a 5.04% CAGR, with Apeel Sciences extending treated avocado life by two extra weeks at retail during global rollouts in 2025. Active and intelligent packs, including sensors that verify cold-chain integrity, gain ground in high-value berries; Huhtamaki embedded time-temperature strips in punnet lids through a 2025 partnership.
Silver-ion antimicrobial formulations meet retailer food-safety checklists, though the European Chemicals Agency flagged some nanoparticle versions as substances of very high concern in 2025, requiring additional authorization filings. Vacuum-skin packs extend the color life of sliced melons and root vegetables but require thermoforming units that cost upward of USD 3 million, which deters smaller growers.
Geography Analysis
Asia-Pacific dominated the produce packaging market with a 33.92% share in 2025, powered by China’s USD 8.7 billion state-backed cold-chain upgrades and India’s INR 42 billion (USD 505 million) grant program supporting integrated logistics hubs. Japanese and South Korean retailers are demanding traceability QR codes, driving the adoption of blockchain ledger systems within pack graphics. Australia’s grape exporters leverage MAP liners to achieve 95% arrival quality in Southeast Asian ports, demonstrating that packaging can mitigate multi-week sea freight transit risks.
The Middle East is the fastest-growing region at a 5.11% CAGR through 2031. The United Arab Emirates imported USD 3.2 billion in fresh produce during 2025, and caregivers mandate robust packs that tolerate 45 °C tarmac temperatures at air freight hubs. Saudi Arabia’s Vision 2030 aims to localize 40% of domestic fruit and vegetable demand, stimulating investment in hydroponic systems that favor humidity-resistant polymer films. Turkey channels corrugated exports to Gulf Cooperation Council customers, marrying European eco-standards with Gulf transit durability and logging an 18% rise in outbound tonnage during 2025.
North America and Europe grow at roughly 3.5% CAGR but remain sources of technological and regulatory firsts that later ripple into emerging markets. South America advances more slowly, hampered by uneven cold-chain coverage, yet Brazil’s organized retail expansion and Argentina’s berry export programs anchor selective pack-format upgrades.

Competitive Landscape
The top five suppliers, Amcor, Sealed Air, Mondi, Smurfit Westrock, and International Paper, collectively hold about 28% of the produce packaging market, indicating moderate fragmentation. Firms with scale pursue vertical integration; Sealed Air purchased a polyethylene compounder in 2024, securing resin supply for MAP applications and safeguarding margins when crude-linked pricing spikes. Sustainability credentials drive deal flows, as retailers shorten vendor lists to partners that can deliver certified circularity. Mondi’s PerFORMing Future pledge unlocked EUR 1.8 billion (USD 2.0 billion) in combined retailer contracts after the firm committed to complete recyclability or compostability by 2025.
Automation remains another axis of competition. Berry Global invested USD 45 million in robotic palletizing across three North American plants in 2025, trimming labor costs by 28% while boosting uptime. Innovation also comes from venture-backed entrants: Notpla secured USD 15 million to scale seaweed-based films that dissolve in water, targeting herb packs that otherwise rely on multilayer plastic. Patent activity underscores momentum, with 1,247 biodegradable food-packaging filings lodged worldwide in 2025, 42% from Chinese applicants.
Scale advantages are likely to widen because shifting to multiple new materials and technologies forces heavy capital outlays that smaller converters struggle to fund. Nevertheless, regional specialists remain competitive where crop mix or trade lanes require tailored solutions, such as phase-change inserts in desert logistics routes or molded-fiber trays for high-humidity mushroom packs.
Produce Packaging Industry Leaders
Amcor plc
International Paper Company
Smurfit Westrock plc
Mondi plc
Sealed Air Corporation
- *Disclaimer: Major Players sorted in no particular order

Recent Industry Developments
- January 2026: Amcor announced a USD 120 million expansion of its Wisconsin bioplastics plant, targeting a 50% hike in PLA produce-pack output by Q3 2026 while installing a closed-loop scrap recycling system.
- December 2025: Sealed Air completed the USD 85 million purchase of a Brazilian flexible-pack converter, adding 12,000 metric tons of annual pouch capacity close to key fruit-growing belts.
- November 2025: Mondi rolled out a paper punnet line across 15 European markets with Tesco, Carrefour, and Rewe at a 12% price premium yet achieved rapid shopper acceptance.
- October 2025: Smurfit Westrock inaugurated a USD 95 million corrugated facility in Gujarat, India, focusing on fresh-produce boxes for the nation’s expanding organized retail.


Global Produce Packaging Market Report Scope
The Produce Packaging Market Report is Segmented by Packaging Material Type (Plastic Containers, Paper and Paperboard, Corrugated Boxes, Bags and Pouches, Film Lidding and Laminates, Trays, Bioplastics), Pack Type (Rigid, Semi-Rigid, Flexible), Application (Fruits, Vegetables, Fresh-Cut Produce, Organic Produce, Exotic and Specialty Produce), Technology (Modified Atmosphere Packaging, Active and Intelligent Packaging, Antimicrobial Packaging, Edible and Biodegradable Coatings, Vacuum Skin Packaging), and Geography (North America, South America, Europe, Asia-Pacific, Middle East and Africa). The Market Forecasts are Provided in Terms of Value (USD).
| Plastic Containers |
| Paper and Paperboard |
| Corrugated Boxes |
| Bags and Pouches |
| Film Lidding and Laminates |
| Trays |
| Bioplastics |
| Rigid |
| Semi-Rigid |
| Flexible |
| Fruits |
| Vegetables |
| Fresh-Cut Produce |
| Organic Produce |
| Exotic and Specialty Produce |
| Modified Atmosphere Packaging |
| Active and Intelligent Packaging |
| Antimicrobial Packaging |
| Edible and Biodegradable Coatings |
| Vacuum Skin Packaging |
| North America | United States |
| Canada | |
| Mexico | |
| South America | Brazil |
| Argentina | |
| Rest of South America | |
| Europe | United Kingdom |
| Germany | |
| France | |
| Italy | |
| Spain | |
| Rest of Europe | |
| Asia-Pacific | China |
| India | |
| Japan | |
| South Korea | |
| Australia | |
| Rest of Asia-Pacific | |
| Middle East | Saudi Arabia |
| United Arab Emirates | |
| Turkey | |
| Rest of Middle East | |
| Africa | South Africa |
| Nigeria | |
| Rest of Africa |
| By Packaging Material Type | Plastic Containers | |
| Paper and Paperboard | ||
| Corrugated Boxes | ||
| Bags and Pouches | ||
| Film Lidding and Laminates | ||
| Trays | ||
| Bioplastics | ||
| By Pack Type | Rigid | |
| Semi-Rigid | ||
| Flexible | ||
| By Application | Fruits | |
| Vegetables | ||
| Fresh-Cut Produce | ||
| Organic Produce | ||
| Exotic and Specialty Produce | ||
| By Technology | Modified Atmosphere Packaging | |
| Active and Intelligent Packaging | ||
| Antimicrobial Packaging | ||
| Edible and Biodegradable Coatings | ||
| Vacuum Skin Packaging | ||
| By Geography | North America | United States |
| Canada | ||
| Mexico | ||
| South America | Brazil | |
| Argentina | ||
| Rest of South America | ||
| Europe | United Kingdom | |
| Germany | ||
| France | ||
| Italy | ||
| Spain | ||
| Rest of Europe | ||
| Asia-Pacific | China | |
| India | ||
| Japan | ||
| South Korea | ||
| Australia | ||
| Rest of Asia-Pacific | ||
| Middle East | Saudi Arabia | |
| United Arab Emirates | ||
| Turkey | ||
| Rest of Middle East | ||
| Africa | South Africa | |
| Nigeria | ||
| Rest of Africa | ||


Key Questions Answered in the Report
What is the projected value of the produce packaging market by 2031?
The produce packaging market is forecast to reach USD 49.94 billion by 2031, rising at a 4.07% CAGR from 2026.
Which material holds the largest share in produce packs?
Plastic containers led with 43.76% of the 2025 produce packaging market share, supported by clarity and cost advantages.
Which region grows fastest for produce packaging?
The Middle East posts the highest regional CAGR at 5.11% through 2031, spurred by food-security programs and rising imports.
Why are bioplastics gaining in produce packs?
Retailer sustainability pledges and upcoming mandates that 70% of EU packaging be recyclable or compostable by 2030 push converters toward PLA and similar resins.
What technology drives the longest shelf life for fresh produce?
Modified-atmosphere packaging leads today, while edible coatings are emerging as a high-growth alternative that can add up to two extra weeks for some fruit.
How fragmented is the competitive landscape?
The top five players hold about 28% share, giving the market a concentration score of 6 on a 10-point scale, which signals moderate consolidation but ample space for specialists.
Page last updated on:


