Industrial Packaging Market Size and Share
Market Overview
| Study Period | 2020 - 2031 |
|---|---|
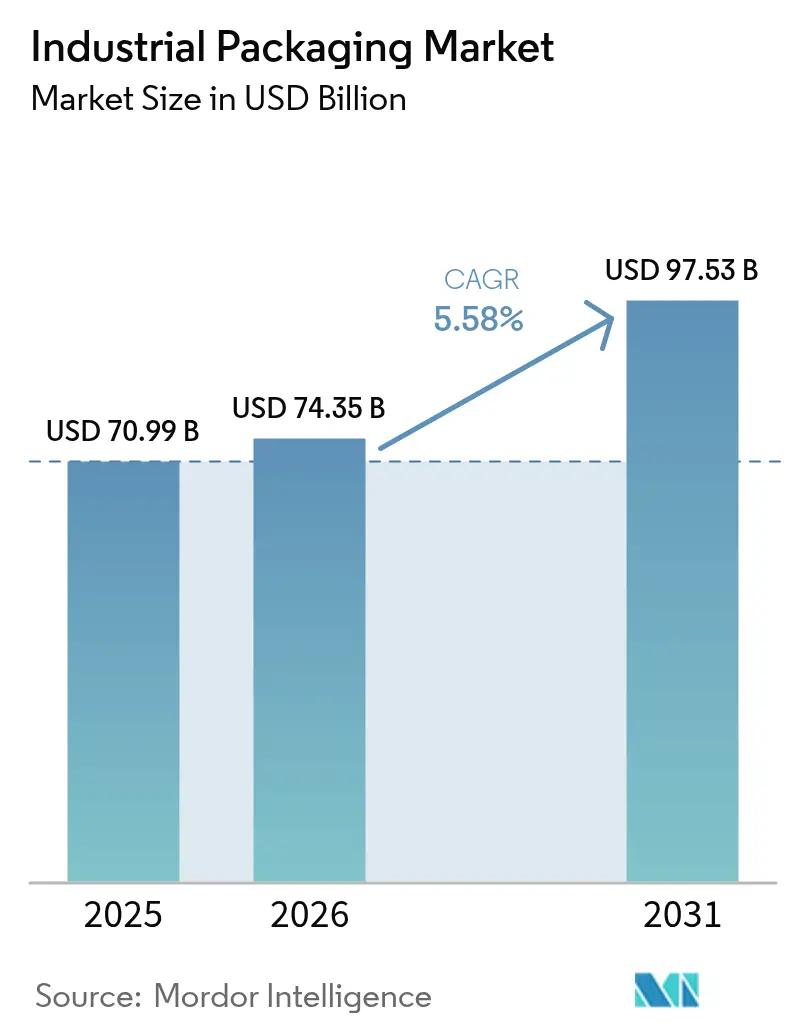
| Market Size (2026) | USD 74.35 Billion |
| Market Size (2031) | USD 97.53 Billion |
| Growth Rate (2026 - 2031) | 5.58% CAGR |
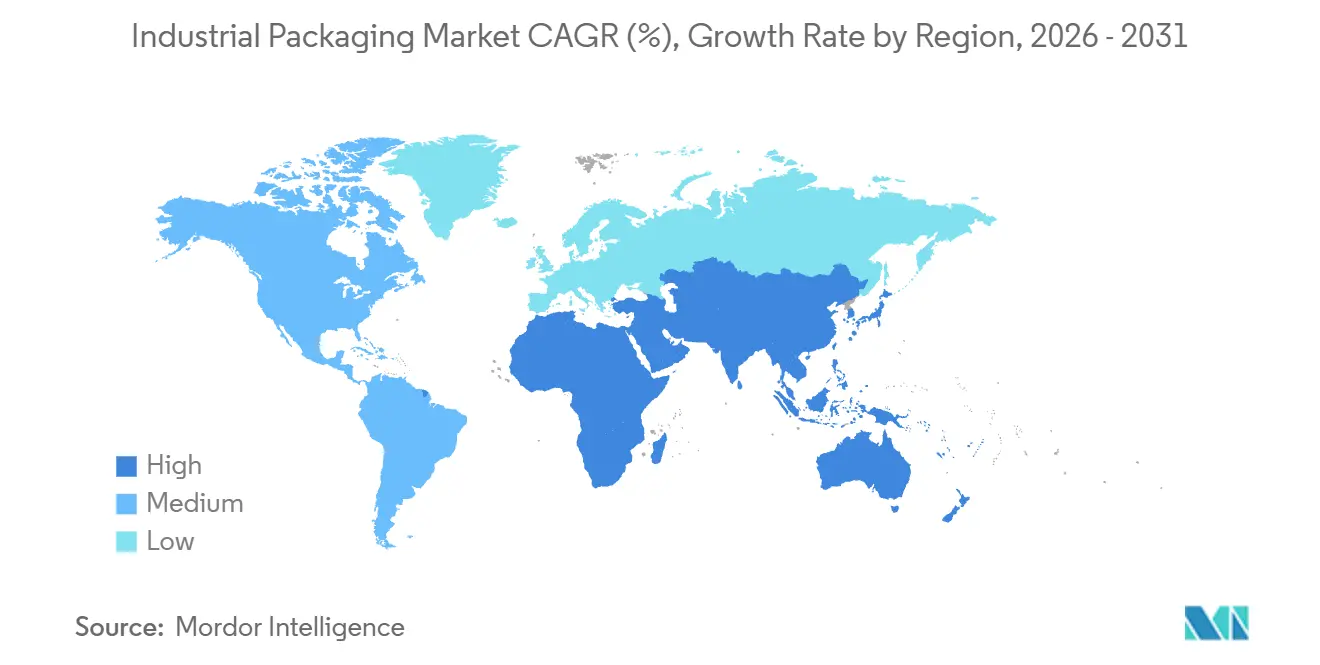
| Fastest Growing Market | Middle East and Africa |
| Largest Market | Asia-Pacific |
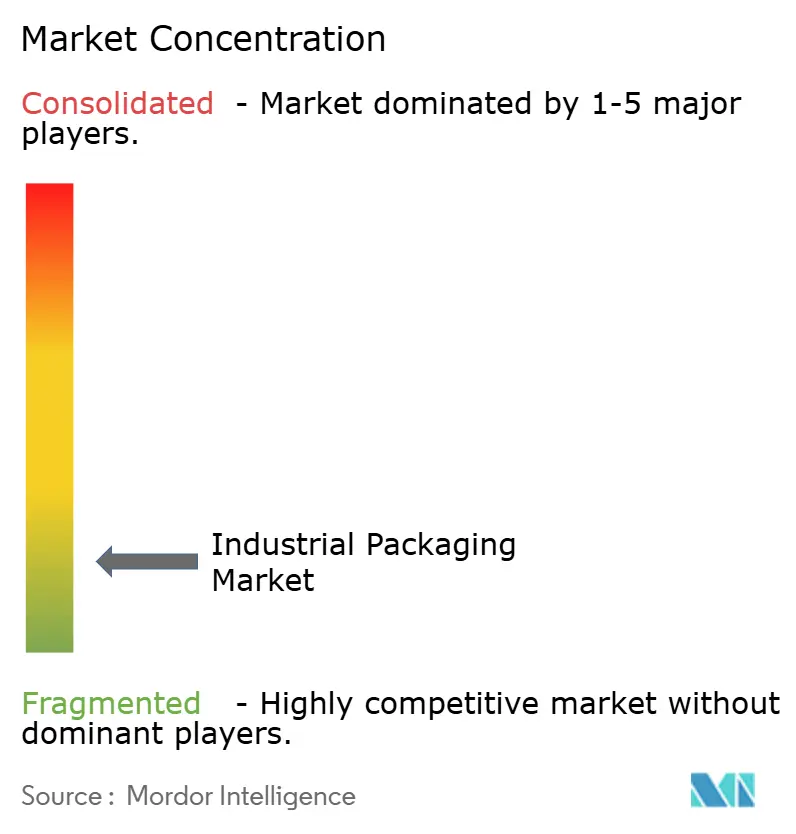
| Market Concentration | Low |
Major Players *Disclaimer: Major Players sorted in no particular order Image © Mordor Intelligence. Reuse requires attribution under CC BY 4.0. | |
Industrial Packaging Market Analysis by Mordor Intelligence
The industrial packaging market size is projected to be USD 70.99 billion in 2025, USD 74.35 billion in 2026, and reach USD 97.53 billion by 2031, growing at a CAGR of 5.58% from 2026 to 2031. Demand is reshaping around cost-efficient, regulation-compliant formats that also support circular-economy goals. Composite intermediate bulk containers (IBCs) are now preferred because they balance UN-certified safety with lighter tare weights that reduce freight emissions. Fiber-based solutions are accelerating as lawmakers phase out single-use plastics and brand owners pledge to boost recycled content. Meanwhile, shop-floor automation shields converters from resin and steel price swings, letting them contain labor costs even as raw-material volatility remains elevated. Hydrogen-economy pilots, pharmaceutical cold-chain uptake, and e-commerce fulfillment standards are also widening application breadth, creating fresh opportunities for global majors and agile regional specialists. Competitive moves reinforce a moderately fragmented structure. Integrated leaders such as Greif and Mauser Packaging Solutions now compound recycled resin and recondition drums in-house, insulating margins from spot-price turbulence. Niche challengers like Pyramid Technoplast leverage domestic proximity in South Asia to deliver faster lead times. Brambles migrates its pallet-pool model into deposit-based IBC programs that demonstrate packaging-as-a-service economics. At the same time, near-shoring of automotive and semiconductor assembly trims some long-haul volumes, while PFAS bans threaten multilayer barrier films, pushing converters toward fluorine-free chemistries.
Key Report Takeaways
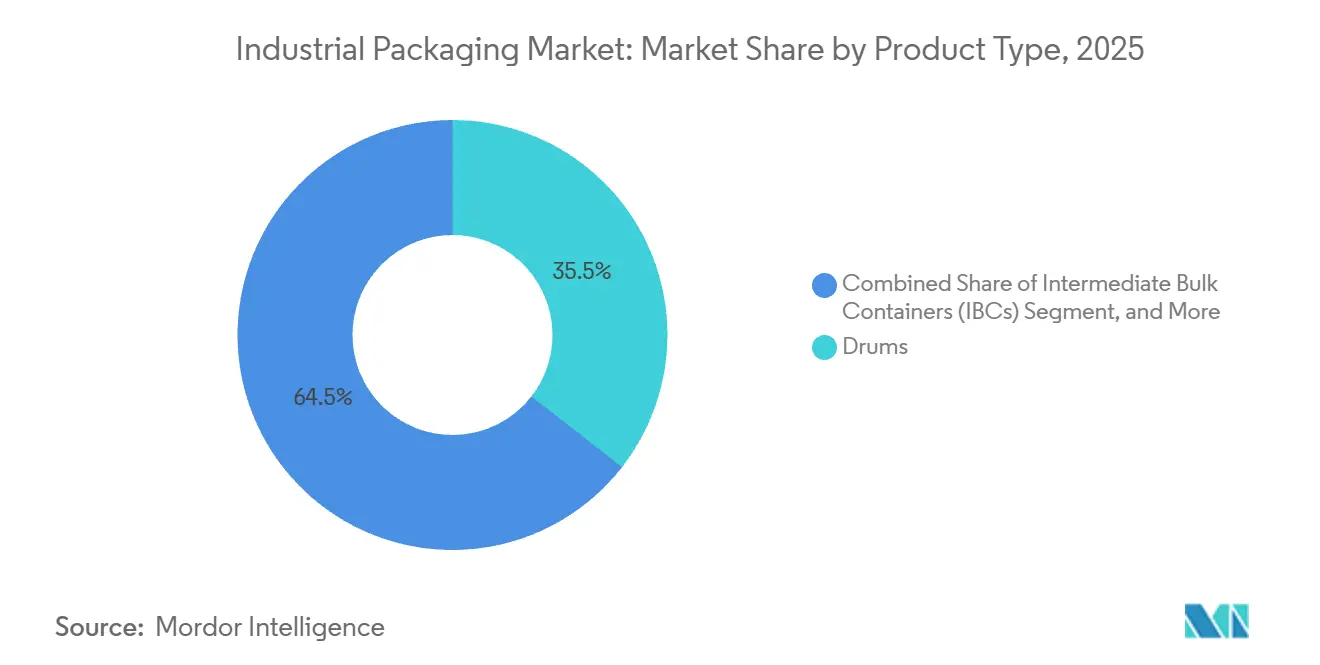
- By product type, drums led with 35.53% of the industrial packaging market share in 2025, while IBCs are forecast to register a 6.11% CAGR to 2031.
- By material type, plastics contributed 46.44% of the industrial packaging market size in 2025, but paper and fiber-based options are advancing at a 6.75% CAGR.
- By capacity, the 51-500 liter band held 38.42% share of the industrial packaging market size in 2025, whereas the 501-1,000 liter band will expand at a 6.42% CAGR.
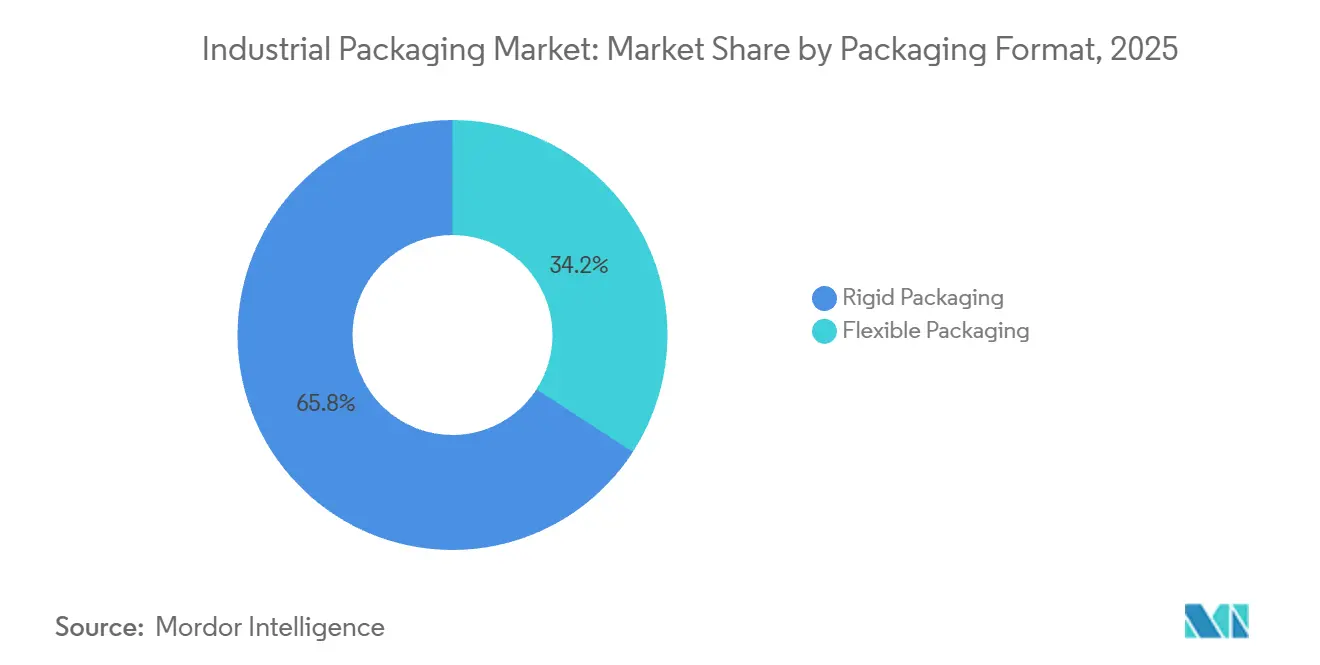
- By format, rigid packs retained 65.85% share in 2025, yet flexible solutions are projected to post a 6.64% CAGR through 2031.
- By end-user, chemicals and pharmaceuticals accounted for 29.43% share in 2025, and food and beverage applications will surge at a 7.29% CAGR.
- By geography, Asia-Pacific captured 40.45% share in 2025, while the Middle East and Africa region is expected to rise at a 7.14% CAGR.
Note: Market size and forecast figures in this report are generated using Mordor Intelligence’s proprietary estimation framework, updated with the latest available data and insights as of 2026.
Global Industrial Packaging Market Trends and Insights
Drivers Impact Analysis*
| Driver | (~) % Impact on CAGR Forecast | Geographic Relevance | Impact Timeline |
|---|---|---|---|
| Emergence of Sustainable and Recyclable Materials | +1.2% | Global, early adoption in EU and North America | Medium term (2-4 years) |
| Expansion of E-Commerce and Cross-Border Trade Flows | +1.0% | Global, concentrated in Asia-Pacific and North America | Short term (≤ 2 years) |
| Growth in Food-Grade and Pharma Bulk Logistics | +0.9% | North America, Europe, Asia-Pacific hubs | Medium term (2-4 years) |
| On-Site Packaging Automation Adoption | +0.7% | North America, Europe, developed Asia-Pacific | Long term (≥ 4 years) |
| Hydrogen-Supply Chain Demand for Composite IBCs | +0.4% | Europe, Japan, South Korea, Middle East | Long term (≥ 4 years) |
| Rise of Reusable Packaging Pool Business Models | +0.6% | Global, visible in North America, Europe, Australia | Medium term (2-4 years) |
| Source: Mordor Intelligence | |||
Emergence of Sustainable and Recyclable Materials
Regulators are mandating minimum recycled-content thresholds and full recyclability, compelling converters to shift away from virgin resin. Mondi’s 2025 paper-based IBC liner eliminates the polyethylene inner bag yet achieves moisture-vapor transmission below 5 g/m²-day, validating fiber substrates for food-grade use.[1]Mondi Group, “Sustainable Packaging Solutions,” MONDIGROUP.COM Mauser Packaging Solutions now runs depolymerization lines that convert contaminated HDPE drums into virgin-equivalent pellets, enabling circular use in hazardous-goods containers.[2]Mauser Packaging Solutions, “Circular Economy Initiatives,” MAUSERPACKAGING.COM Premium brands absorb 40-60% cost premiums on bio-polymers to secure carbon-neutral credentials, while adhesive suppliers switch to water-based and hot-melt systems that remain compatible with single-stream recycling. Design-for-recycling software simulates end-of-life scenarios during development, cutting physical prototyping and speeding compliance.
Expansion of E-Commerce and Cross-Border Trade Flows
Cross-border e-commerce surpassed USD 1.2 trillion in 2025, lifting demand for ISO 668-compliant corrugated boxes and collapsible IBCs that maximize container utilization. Third-party logistics providers in Southeast Asia and the Middle East standardize packaging dimensions to avoid freight surcharges of 15-25%. Amazon’s frustration-free guidelines ripple into chemical distribution, prompting steel-drum redesigns that strip secondary overwraps and cut package weight 8-12%. Direct-to-consumer nutraceutical brands choose 20-50 liter drums so they can ship split orders without bloating inventory. Regional trade pacts remove tariff friction, amplifying demand for UN-certified IBCs that satisfy multiple transport codes.
Growth in Food-Grade and Pharma Bulk Logistics
Single-use flexible IBCs have displaced stainless vessels for active-pharmaceutical-ingredient transfer, eliminating protracted cleaning validation and lowering cross-contamination risk consistent with FDA cGMP guidance. Cold-chain biologics now travel in insulated IBCs with phase-change materials that hold 2-8 °C for 96 hours, outperforming unconditioned steel drums. Aseptic IBC filling for nut butters, dairy alternatives, and cold-pressed juices removes refrigerated storage that once ate 20-30% of landed cost. Conical-bottom IBCs with pneumatic discharge reach 99.5% evacuation on viscous goods, saving high-value product. Contract manufacturers gain 25-30% higher asset utilization as gamma-sterile liners shrink changeover from eight hours to thirty minutes.
On-Site Packaging Automation Adoption
Collaborative robots palletize 30-40 drums per hour, delivering paybacks under 18 months and reducing injury risk, according to the International Federation of Robotics.[3]International Federation of Robotics, “World Robotics 2025,” IFR.ORG Hyperspectral machine-vision screens 200 HDPE drums a minute for micro-cracks, wiping out recall-triggering failures. IoT-enabled stretch-wrappers adjust film tension dynamically, trimming film use 15-20% yet maintaining load integrity. Inline thermal-inkjet coders print GHS labels and QR codes directly on polyethylene, eliminating adhesive waste. RFID-tagged IBCs feed fill-level data to ERP suites so planners can reorder before stockouts, pushing overall equipment effectiveness higher in high-mix lines.
Restraints Impact Analysis*
| Restraint | (~) % Impact on CAGR Forecast | Geographic Relevance | Impact Timeline |
|---|---|---|---|
| Volatile Resin and Steel Prices | -0.8% | Global, acute in Asia-Pacific and Europe | Short term (≤ 2 years) |
| Tightening Global Environmental Regulations | -0.5% | Europe, North America, spillover to Asia-Pacific | Medium term (2-4 years) |
| PFAS and Micro-Plastic Bans on Barrier Coatings | -0.3% | Europe, North America, Australia | Medium term (2-4 years) |
| Near-Shoring Lowering Long-Haul Packaging Volumes | -0.4% | North America, Europe, impact on Asia-Pacific exports | Long term (≥ 4 years) |
| Source: Mordor Intelligence | |||
Volatile Resin and Steel Prices
HDPE spot prices oscillated between USD 1,100 and USD 1,450 t in 2024-2025, while hot-rolled coil swung from USD 650 to USD 950 t, crushing converter margins. Greif’s in-house compounding now covers 40% of polypropylene needs, buffering against price spikes. Small players lacking hedges face 60-90-day pass-through lags that strain cash flow, accelerating exits from commodity drum markets. Customers increasingly favor suppliers offering index-linked contracts that cap quarterly adjustments, accepting slightly higher base prices in exchange for predictability. Volatility also nudges converters toward multi-year resin agreements with integrated petrochemical partners.
Tightening Global Environmental Regulations
The EU Packaging and Packaging Waste Regulation effective 2025 requires every pack sold in the bloc to be recyclable by 2030 and levies fees of EUR 0.08-0.15/kg on non-recyclable material. California’s Senate Bill 54 layers in recycled-content quotas rising to 65% by 2032, steering drum makers toward r-HDPE blends that still pass UN tests. China’s National Sword policy forces North American reclaimers to upgrade optical sorting to meet 98% purity for exportable scrap. Certification and lab testing now cost USD 15,000-50,000 per SKU, squeezing small converters. Digital eco-design tools simulate dismantling and material flows upfront, curbing costly late-stage redesigns.
*Our forecasts treat driver/restraint impacts as directional, not additive. The impact forecasts reflect baseline growth, mix effects, and variable interactions.
Segment Analysis
By Product Type: IBCs Outpace on Modularity and Hygiene
IBCs are forecast to grow at a 6.11% CAGR, outstripping the wider industrial packaging market, because single-use liners erase cleaning cycles and preserve sterility while meeting UN performance tests. Drums held 35.53% of the industrial packaging market share in 2025 but face slower growth due to labor-intensive handling and 1-2% spillage during manual tipping. Carbon-fiber composite IBCs slice weight 40-50%, lowering transport costs by USD 0.15-0.20/t-km for hydrogen carriers. Flexible IBCs with gamma-sterile liners cut biopharma batch changeover from eight hours to half an hour, lifting asset utilization by a quarter. Automotive lubricant suppliers upgrading from 200-liter drums to 1,000-liter stackable IBCs reclaim 35% warehouse space and reduce forklift time per unit from four minutes to ninety seconds.
Niche formats persist in specialized roles. Sacks dominate powdered chemicals and construction additives, where 25-50 kg packages align with labor codes. Pails address adhesives and bespoke coatings, and corrugated bag-in-box hybrids merge fiber recyclability with polyethylene barriers for liquid concentrates. Semi-rigid IBCs with collapsible sidewalls reduce empty volume 60-70% yet stack three-high filled. UN drop- and hydro-pressure criteria still favor rigid packages in hazardous goods, but thicker multilayer films are closing the compliance gap for flexible designs.


By Material Type: Fiber Gains Ground Under Recyclability Pressure
Fiber-based packs are set to rise at a 6.75% CAGR, supported by retailer take-back schemes and municipal curbside collection that simplify consumer participation. Plastics retained 46.44% of the industrial packaging market size in 2025 thanks to HDPE’s chemical resistance at USD 1.20-1.40/kg, but extended producer responsibility fees of USD 0.10-0.25/kg erode that edge. Mondi’s kraft IBC liners pass moisture-barrier tests without plastic films, removing sorting hurdles in fiber recovery. Sugarcane-based polyethylene slashes cradle-to-gate carbon 60-70%, justifying 30-40% premiums in premium personal-care refills. Metal containers keep niches in flammable or puncture-risk cargo, but recycled steel content above 80% and electric-arc furnaces cut embodied carbon by half. Hybrid aluminum-in-fiber IBCs allow mechanical separation at end-of-life, boosting recycling.
Adhesive innovation accelerates the shift. Water-based systems detach cleanly in pulpers, avoiding stickie contamination that once plagued recovered fiber. ISO 9001 certified supply chains now dominate pharmaceutical and food-grade orders, as customers require traceable sourcing and processing conditions. Mauser’s chemical-recycling outputs enable high-purity r-HDPE drums, widening circular capacity for hazardous-goods applications. Market incumbents that integrate recycling streams gain brand-owner loyalty, while laggards risk paying escalating eco-modulation fees.
By Packaging Capacity: Mid-Range Volumes Balance Flexibility and Cost
Containers between 51 and 500 liters held 38.42% share of the industrial packaging market in 2025 because their size aligns with specialty chemical batch runs and mid-scale food processors. Yet the 501-1,000 liter band will expand at a 6.42% CAGR as automotive and pharmaceutical sites standardize on 1,000-liter IBCs that match pallet footprints and stack four-high. Disposable bioreactors in this range trim USD 50,000-80,000 stainless capex and cut validation paperwork from sixty hours to two. Pneumatic bottom-outlet valves leave under 0.5% residue, a critical metric for APIs priced up to USD 1,000 l. ISO 21007 sets global RFID data formats so pooled IBCs circulate seamlessly across borders.
Small packs under 50 liters cater to paints and adhesives with fast inventory turns, yet private-label competition squeezes margins, pushing converters toward high-speed, low-scrap linerless labeling. Containers above 2,000 liters stay concentrated in edible-oil and lubricant blending, where filling infrastructure and dedicated tankers impose high switch costs. As hydrogen supply chains mature, demand clusters around 1,000-1,500 liter composite IBCs balancing pressure ratings with trailer payloads, opening a fresh growth pocket.
By Packaging Format: Flexible Solutions Slash Reverse-Logistics Overhead
Rigid drums and HDPE IBCs controlled 65.85% of market share in 2025 because they satisfy UN drop and pressure tests, yet flexible designs will post a 6.64% CAGR. Fold-flat IBCs collapse to one-tenth the volume of an empty drum, slicing round-trip freight up to 50% for e-commerce hubs. Multilayer films that pair polyethylene with aluminum-oxide barriers now attain oxygen transmission below 0.5 cc/m²-day while remaining PFAS-free. Automotive lubricant suppliers pilot flexible IBCs with tamper-evident spouts that dispense directly into lines, eliminating contamination risk. Semi-rigid hybrids keep structural ribs so three-high stacking is secure, yet fold to 30-40% original volume on return runs.
Rigid steel or composite units remain indispensable for pressure ratings above 5 bar or temperature swings from -40 °C to +60 °C, such as liquefied gas shipments. Carbon-fiber wraps cut tare weight without sacrificing strength, broadening hydrogen-logistics appeal. Smart liners embed temperature and shock sensors, flagging cold-chain breaches to receivers. Film thickness now reaches 350 µm in UN-rated flexible drums, nudging cost upward yet preserving the reverse-logistics payback.
By End-User Industry: Food and Beverage Leads on Cold-Chain Disruption
Food and beverage applications will drive a 7.29% CAGR through 2031 as aseptic IBCs let cold-pressed juices, plant-based milks, and liquid eggs ship at ambient temperatures. Chemicals and pharmaceuticals owned 29.43% of the industrial packaging market share in 2025, underpinned by UN dangerous-goods codes and cGMP closure integrity checks. Automotive OEMs now swap steel drums for returnable plastic totes, syncing lubricant deliveries with six daily replenishment cycles that cut floor stock. Oil, gas, and petrochemical operators keep buying steel drums and composite IBCs tolerating -20 °C to +60 °C and hydrogen sulfide exposure. Building-product makers shift sealants into 500-1,000 kg bulk bags, curtailing package waste 70-80% and feeding directly into pneumatic dispensers.
Global nuances add complexity. North American chemical producers prefer 275-gallon (1,040 l) footprints, while European and Asian shippers pick 1,000-l metrics, complicating pool interoperability. EV battery modules now travel in shock-absorbing Nefab totes, trimming in-transit damage below 1%. Pharmaceutical CDMOs insist on gamma-sterilized liners for cell-culture media, making sterility validation seamless. Plant-based dairy exporters use ultra-high temperature processing plus sterile IBC filling to extend shelf life from six refrigerated weeks to 12-18 months ambient, opening markets in regions with limited cold chains.
Geography Analysis
Asia-Pacific captured 40.45% of the industrial packaging market in 2025, propelled by China’s chemical output above 1.5 billion t and India’s agrochemical exports topping USD 8 billion. Chinese coastal megasites such as Lianyungang now favor rail-compatible IBCs that bypass road bottlenecks, while India’s agrochemical belt upgrades to UN-approved HDPE drums for hazardous insecticides. Japan’s aging workforce accelerates cobot adoption, with palletizing speeds reaching 50 drums an hour and cutting labor costs 60-70%. South Korea’s Hydrogen Economy Roadmap stimulates composite IBC demand as methylcyclohexane flows from import terminals to inland dispensers. Southeast Asian logistics firms enforce ISO pallet footprints to shorten port dwell times and slice demurrage bills.
North America shows steady volume but benefits from near-shoring of semiconductor fabs and electric-vehicle assembly. Ultrapure chemical IBCs integrate fluorine-free laminate films to avoid chip-fab contamination. Mexico’s maquiladora clusters rely on reusable plastic totes that cross borders 30-40 times before retirement, shrinking corrugated waste. Canadian oil-sands operations purchase carbon-steel drums rated for -40 °C service to handle drilling additives. U.S. states like California apply recycled-content rules that push converters toward r-HDPE drums, while East Coast ports invest in drum-washing capacity to support chemical export flows.
The Middle East and Africa offer the fastest trajectory, with a 7.14% CAGR outlook. Saudi Arabia’s USD 20 billion Vision 2030 petrochemical build-out drives demand for composite IBCs rated for corrosive intermediates. UAE free zones serve as container trans-shipment hubs bridging Asian manufacturers and African miners, spurring investments in tank-cleaning and drum-reconditioning yards. South Africa’s mining sector swaps wooden crates for RFID-tagged UN steel drums, improving traceability. Nigeria’s consumer-oil producers substitute imported drums with domestic corrugated and fiber-based bulk packs, retaining forex. Hydrogen pilots tied to Saudi Arabia’s NEOM plan create early adopters for ammonia and liquid organic hydrogen carriers, foreshadowing regional capacity for composite IBCs.
Mordor Intelligence provides coverage of the industrial packaging market across other key regional markets. Detailed country-level analysis extends to Indonesia incorporating local coverage and market participation, as required.

Competitive Landscape
The Market is Fragmented. Greif acquired a European composite-IBC specialist in 2025, broadening hydrogen-logistics capability while adding carbon-fiber winding expertise. Mauser Packaging Solutions installed GPS and fill-level sensors on 10,000 IBCs for a European chemical major, cutting stockouts 40% and trimming safety stock 25%. Schutz launched a 10-bar carbon-fiber IBC that weighs 45% less than steel, meeting Japan and South Korea’s hydrogen requirements. Smurfit WestRock consolidated 12 North American corrugated plants into eight high-automation mills, trimming unit fiber costs 12-15%. International Paper converted a Georgia mill to lightweight medium, lowering basis weight 12% and saving kraft fiber.
Regional specialists bring agility. Pyramid Technoplast opened 15,000 t/y HDPE-drum capacity in Gujarat, cutting agrochemical lead times to three weeks. Nefab launched returnable battery-module totes with integrated shock absorbers, driving EV-module damage below 1%. Snyder Industries unveiled a 275-gallon conical IBC that secures 99.7% evacuation, saving pharmaceutical intermediates priced above USD 800 l. Brambles migrated its CHEP platform into IBC pooling, achieving 88% asset recovery on a European automotive lubricant pilot. Packaging Corporation of America earned ISO 14001 for its drum-reconditioning site, diverting 95% of scrap and solvents from landfill.
Technology and service models reshape rivalry. Vision inspection, robotics, and blockchain asset tracking cut quality-control labor by 25-30% and secure audit trails. Vertical integration into r-resin compounding satisfies recycled-content mandates while protecting against feedstock spikes. Start-ups licensing liner films or SaaS-based container tracking enter via partnerships rather than capital-heavy manufacturing. Entrants still face UN test costs of USD 0.5-1 million, keeping barriers significant. Customers increasingly favor cradle-to-grave offers bundling supply, cleaning, data, and end-of-life recycling in one fee.
Industrial Packaging Industry Leaders
WERIT Kunststoffwerke W. Schneider GmbH & Co.
Mondi Plc
Greif Inc.
Mauser Packaging Solutions Holding Company
Global-Pak, Inc.
- *Disclaimer: Major Players sorted in no particular order

Recent Industry Developments
- February 2026: Greif completed a USD 45 million expansion of its Ohio recycled-resin facility, pushing post-consumer HDPE capacity to 30,000 t/y.
- December 2025: Mauser Packaging Solutions and a European chemical major rolled out 10,000 IoT-enabled IBCs, slashing stockouts 40% and safety stock 25%.
- November 2025: Mondi debuted a fully recyclable kraft IBC liner for powdered foods, meeting sub-5 g/m²-day moisture-barrier targets.
- October 2025: Smurfit WestRock finished consolidating 12 North American corrugated plants into eight high-automation mills, slicing costs 12-15%.


Global Industrial Packaging Market Report Scope
Industrial packaging protects, ships, and stores a wide range of goods. Typically, industrial packaging is done at the production site right after production, although it can be used at any point in the supply chain. This type of packaging is usually done for sensitive products that heavily rely on stability or are hazardous or bulky or for products with components that are sensitive to each other.
The Industrial Packaging Market Report is Segmented by Product Type (IBCs, Drums, Sacks, Pails, Corrugated Boxes, and Other Product Types), Material Type (Plastics, Metal, Paper and Fiber-Based, and Other Material Types), Packaging Capacity (≤50L, 51-500L, 501-1,000L, 1,001-2,000L, and >2,000L), Packaging Format (Rigid, and Flexible), End-User Industry (Chemicals and Pharmaceuticals, Food and Beverage, Automotive, Oil Gas and Petrochemicals, Building and Construction, and Other End-User Industries), and Geography (North America, South America, Europe, Asia-Pacific, and Middle East and Africa). The Market Forecasts are Provided in Terms of Value (USD).
| Intermediate Bulk Containers (IBCs) |
| Drums |
| Sacks |
| Pails |
| Corrugated Boxes |
| Other Product Types |
| Plastics |
| Metal |
| Paper and Fiber-Based |
| Other Material Types |
| ≤ 50 L |
| 51 – 500 L |
| 501 – 1,000 L |
| 1,001 – 2,000 L |
| > 2,000 L |
| Rigid Packaging |
| Flexible Packaging |
| Chemicals and Pharmaceuticals |
| Food and Beverage |
| Automotive |
| Oil, Gas and Petrochemicals |
| Building and Construction |
| Other End-User Industries |
| North America | United States | |
| Canada | ||
| Mexico | ||
| South America | Brazil | |
| Argentina | ||
| Rest of South America | ||
| Europe | Germany | |
| United Kingdom | ||
| France | ||
| Spain | ||
| Italy | ||
| Rest of Europe | ||
| Asia-Pacific | China | |
| Japan | ||
| India | ||
| Australia | ||
| South Korea | ||
| Rest of Asia-Pacific | ||
| Middle East and Africa | Middle East | Saudi Arabia |
| United Arab Emirates | ||
| Turkey | ||
| Rest of Middle East | ||
| Africa | South Africa | |
| Kenya | ||
| Rest of Africa | ||
| By Product Type | Intermediate Bulk Containers (IBCs) | ||
| Drums | |||
| Sacks | |||
| Pails | |||
| Corrugated Boxes | |||
| Other Product Types | |||
| By Material Type | Plastics | ||
| Metal | |||
| Paper and Fiber-Based | |||
| Other Material Types | |||
| By Packaging Capacity | ≤ 50 L | ||
| 51 – 500 L | |||
| 501 – 1,000 L | |||
| 1,001 – 2,000 L | |||
| > 2,000 L | |||
| By Packaging Format | Rigid Packaging | ||
| Flexible Packaging | |||
| By End-User Industry | Chemicals and Pharmaceuticals | ||
| Food and Beverage | |||
| Automotive | |||
| Oil, Gas and Petrochemicals | |||
| Building and Construction | |||
| Other End-User Industries | |||
| By Geography | North America | United States | |
| Canada | |||
| Mexico | |||
| South America | Brazil | ||
| Argentina | |||
| Rest of South America | |||
| Europe | Germany | ||
| United Kingdom | |||
| France | |||
| Spain | |||
| Italy | |||
| Rest of Europe | |||
| Asia-Pacific | China | ||
| Japan | |||
| India | |||
| Australia | |||
| South Korea | |||
| Rest of Asia-Pacific | |||
| Middle East and Africa | Middle East | Saudi Arabia | |
| United Arab Emirates | |||
| Turkey | |||
| Rest of Middle East | |||
| Africa | South Africa | ||
| Kenya | |||
| Rest of Africa | |||


Key Questions Answered in the Report
How big is the industrial packaging market in 2026?
The industrial packaging market size stands at USD 74.35 billion in 2026.
What is the projected CAGR through 2031?
The market is expected to grow at a 5.58% CAGR from 2026 to 2031.
Which product line shows the fastest growth?
Intermediate bulk containers are forecast to grow at a 6.11% CAGR, the quickest among major product categories.
Why are fiber-based materials on the rise?
Recyclability mandates and brand sustainability pledges drive a 6.75% CAGR for fiber-based packaging.
Which region offers the highest growth upside?
The Middle East and Africa region is expected to expand at a 7.14% CAGR, led by petrochemical and hydrogen investments.
How do reusable IBC pools cut costs?
Deposit-based pooling can lower per-trip packaging costs 15-20% while achieving asset-recovery rates above 85%.
Page last updated on:


