
Agriculture Chemical Packaging Market Size and Share
Market Overview
| Study Period | 2020 - 2031 |
|---|---|
| Market Size (2026) | USD 6.96 Billion |
| Market Size (2031) | USD 8.64 Billion |
| Growth Rate (2026 - 2031) | 4.39 % |
| Fastest Growing Market | Asia Pacific |
| Largest Market | Asia Pacific |
| Market Concentration | Medium |
Major Players *Disclaimer: Major Players sorted in no particular order Image © Mordor Intelligence. Reuse requires attribution under CC BY 4.0. | |
Agriculture Chemical Packaging Market Analysis by Mordor Intelligence
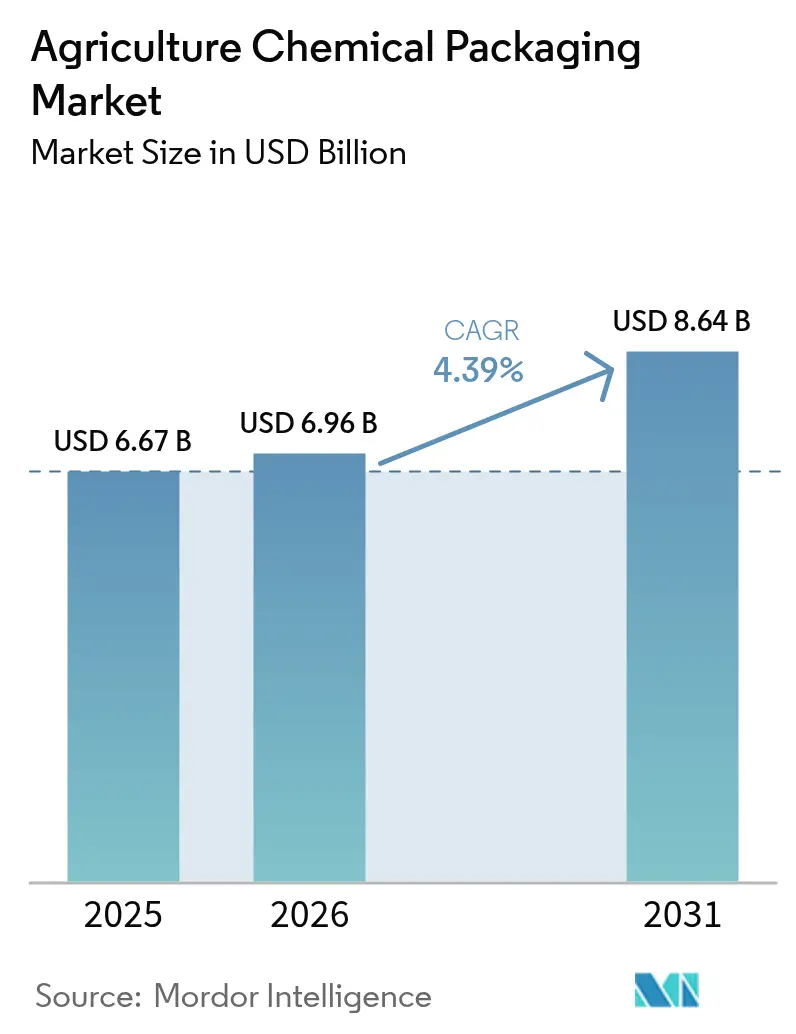
The agriculture chemical packaging market size was valued at USD 6.67 billion in 2025 and estimated to grow from USD 6.96 billion in 2026 to reach USD 8.64 billion by 2031, at a CAGR of 4.39% during the forecast period (2026-2031). Government mandates for closed-loop systems, rising biologicals penetration, and rapid advances in multilayer barrier technology are reshaping how products move from formulation plants to farms, anchoring demand for high-performance containers that comply with stricter volatility, track-and-trace, and recyclability standards. The surge of precision agriculture, rollout of drip-fertigation, and growth of smart packaging create commercial headroom for suppliers able to pair chemical compatibility with digitized logistics visibility. Competitive intensity is heightening as leading converters divest non-core assets, consolidate production footprints, and accelerate circular economy investments to protect margins and satisfy producer responsibility rules. Asia Pacific leads both volume and growth, underpinned by expanding agrochemical capacity in China, India, and emerging Southeast Asian hubs that rely on UN-certified drums, intermediate bulk containers, and small-dose pouches for export-oriented trade.
Key Report Takeaways
- By material type, plastic captured 55.48% of the agriculture chemical packaging market share in 2025.
- By product type, the agriculture chemical packaging market size for the bags and pouches segment is projected to grow at a 6.19% CAGR between 2026-2031.
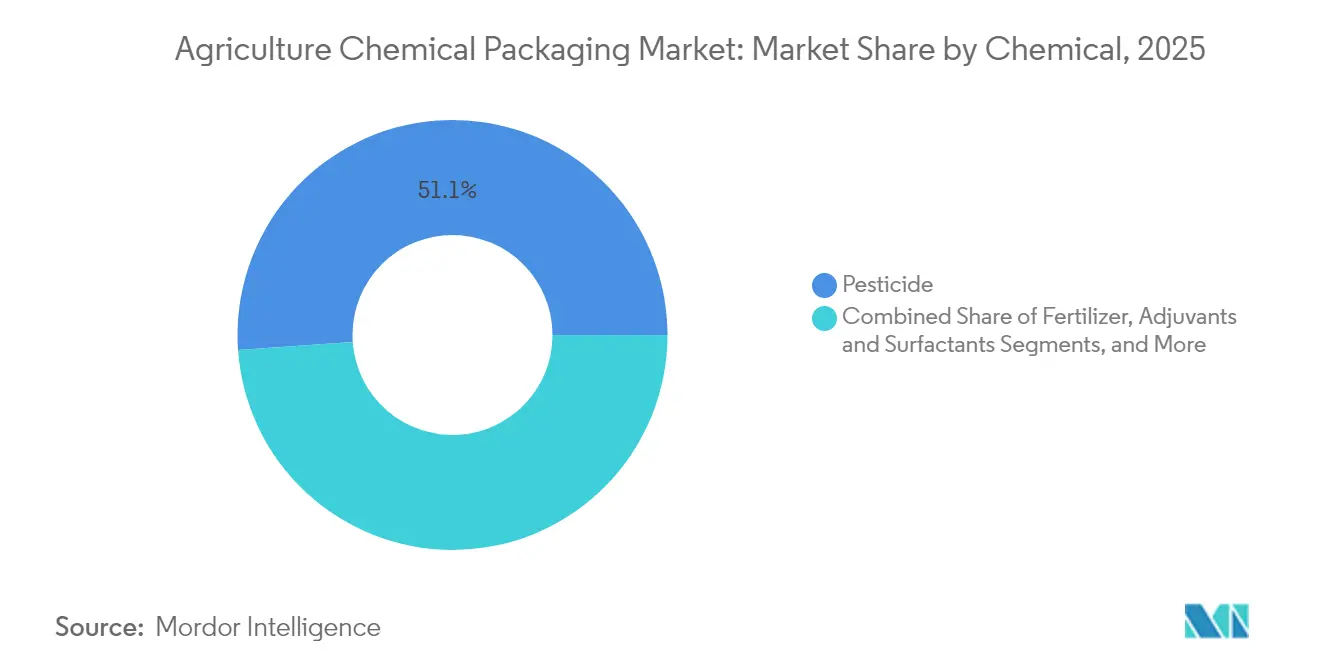
- By chemical, pesticides captured 51.12% of the agriculture chemical packaging market share in 2025.
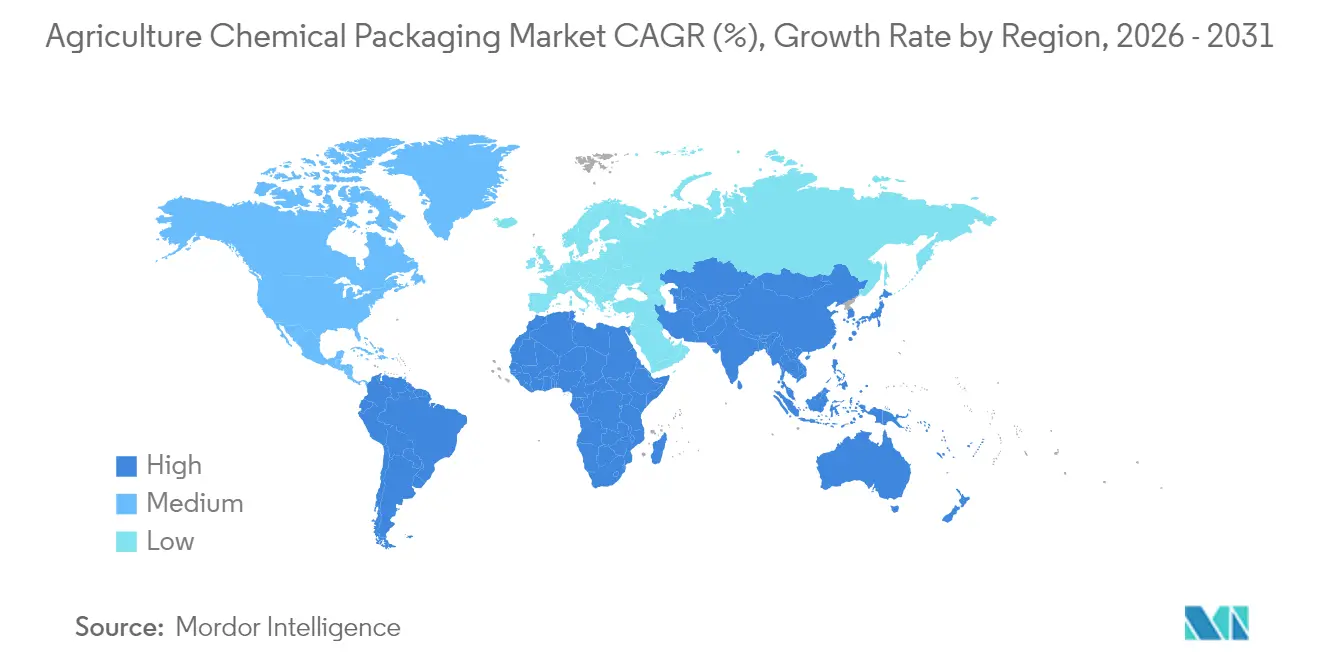
- By geography, the agriculture chemical packaging market size for the Asia Pacific region is projected to grow at a 5.28% CAGR between 2026-2031.
Note: Market size and forecast figures in this report are generated using Mordor Intelligence’s proprietary estimation framework, updated with the latest available data and insights as of 2026.
Market Trends and Insights
Drivers Impact Analysis of Agriculture Chemical Packaging Market*
| Driver | (~) % Impact on CAGR Forecast | Geographic Relevance | Impact Timeline |
|---|---|---|---|
| APAC agrochemical output surge raises container demand | +1.2% | Asia Pacific core, spill-over to Middle East and Africa | Medium term (2-4 years) |
| Closed-loop reconditioning of IBCs | +0.8% | Global, EU and North America lead | Long term (≥ 4 years) |
| HDPE-EVOH multilayer bottles for VOC compliance | +0.7% | North America and EU | Short term (≤ 2 years) |
| Expansion of drip-fertigation driving pouch adoption | +0.6% | Global, water-stressed regions | Medium term (2-4 years) |
| Smart track-and-trace mandates under EU PPWR | +0.4% | EU core, expanding to other developed markets | Short term (≤ 2 years) |
| Biobased barrier resin breakthroughs | +0.3% | Global | Long term (≥ 4 years) |
| Source: Mordor Intelligence | |||
Surge in APAC Agrochemical Output Boosting Container Demand
Asia Pacific’s rising agrochemical production volumes are generating unprecedented need for UN-certified bulk containers, drums, and rigid bottles that can withstand long-distance export shipping while meeting hazardous-materials protocols.[1] Capacity expansions across China, India, Vietnam, and Indonesia are producing economies of scale that reduce per-unit packaging costs, enabling regional formulators to compete globally. Government fertilizer subsidy programs and sustainable packaging incentives further amplify demand for compliant packaging, channeling investments toward high-volume drum lines and localized IBC reconditioning centers. The concentration of production in the region is catalyzing localized supply chains for closures, liners, and smart labels, shortening lead times and lowering logistics spend. Collectively, these forces underpin Asia Pacific’s status as the growth engine of the agriculture chemical packaging market.
Regulatory Shift Toward Closed-Loop IBC Re-conditioning
Extended producer responsibility schemes and landfill-reduction targets in the EU and North America are transforming intermediate bulk containers from single-use assets into multi-cycle logistics platforms.[2] Specialized collection, high-pressure cleaning, and recertification programs extend container life while reducing virgin resin demand and cutting overall lifecycle emissions. Cost savings of 30-40% relative to new IBC purchases incentivize adoption, and automated decontamination lines ensure consistency across pesticide, fertilizer, and adjuvant applications. Multinational formulators increasingly specify closed-loop contracts in supplier agreements, prompting converters to invest in regional reconditioning hubs. Over the forecast horizon, the model shifts revenue mix from one-off container sales to recurring service income while satisfying corporate net-zero commitments.
Rapid Adoption of HDPE-EVOH Multilayer Bottles for VOC Compliance
Heightened scrutiny of volatile pesticide formulations by the U.S. EPA and comparable EU bodies is accelerating conversion from single-layer HDPE to co-extruded HDPE-EVOH structures that cut permeation rates by more than 90%. The multilayer format preserves container rigidity and chemical resistance while achieving low-odor performance required for residential-proximity applications. Co-extrusion advancements lower conversion costs, allowing mid-sized converters to enter the high-barrier segment. Brand owners favor the solution because it circumvents costly reformulations and avoids switching to metal cans, thereby sustaining line-fill efficiency and downstream recyclability.
Growth of Drip-Fertigation Driving Small-Dose Pouch Formats
Precision irrigation infrastructure across water-stressed geographies is spurring adoption of water-soluble pouches and concentrate sachets that align with automated fertigation injectors. Format shift from 20 liter jerrycans to single-application pouches eliminates on-farm measuring error and reduces plastic mass per hectare treated. Flexible films with oxygen and moisture barriers safeguard nutrient potency until dissolution, and micro-perforation systems enable exact flow rates. Smallholder farmers in India and parts of Sub-Saharan Africa benefit from lower upfront costs and simplified logistics, broadening market reach for specialty nutrient suppliers.
Restraints Impact Analysis of Agriculture Chemical Packaging Market*
| Restraint | (~) % Impact on CAGR Forecast | Geographic Relevance | Impact Timeline |
|---|---|---|---|
| Volatile resin prices squeezing converter margins | -0.9% | Global | Short term (≤ 2 years) |
| High post-use decontamination costs | -0.6% | Global, particularly developed markets | Medium term (2-4 years) |
| Evolving UN hazmat rules raising testing costs | -0.4% | Global | Long term (≥ 4 years) |
| Farm-level refill stations trimming single-use demand | -0.3% | Developed markets with infrastructure | Long term (≥ 4 years) |
| Source: Mordor Intelligence | |||
Volatile Resin Prices Squeezing Converter Margins
Sharp swings in polyethylene and polypropylene feedstock costs, driven by crude price gyrations and unplanned cracker outages, compress converter spreads as agricultural buyers resist frequent price adjustments. Seasonal procurement cycles exacerbate timing mismatches, leaving mid-tier converters exposed to inventory losses. Some market leaders hedge through long-term supply agreements or integrate backward into resin production; smaller firms, lacking scale, confront heightened consolidation risk. Margin uncertainty curtails capital expenditure on new high-barrier lines, potentially delaying innovation rollouts and restricting supply of next-generation sustainable formats within the agriculture chemical packaging market.
High Post-Use Decontamination Costs
Triple-rinse mandates, certified wash bays, and hazardous waste disposal regulations inflate end-of-life treatment bills for drums, IBCs, and rigid bottles. For small and mid-volume pack sizes, decontamination can exceed 60% of container value, undermining circular models and tilting the cost balance toward single-use options. Investment in automated stations and plasma-based residue removal offers relief but demands multi-million-dollar outlays and specialized technical staff. Until decontamination technologies scale and regulatory clarity harmonizes across borders, this restraint will cap reuse volumes and temper overall circularity progress in the agriculture chemical packaging market.
*Our forecasts treat driver/restraint impacts as directional, not additive. The impact forecasts reflect baseline growth, mix effects, and variable interactions.
Agriculture Chemical Packaging Market Segment Analysis
By Material Type:
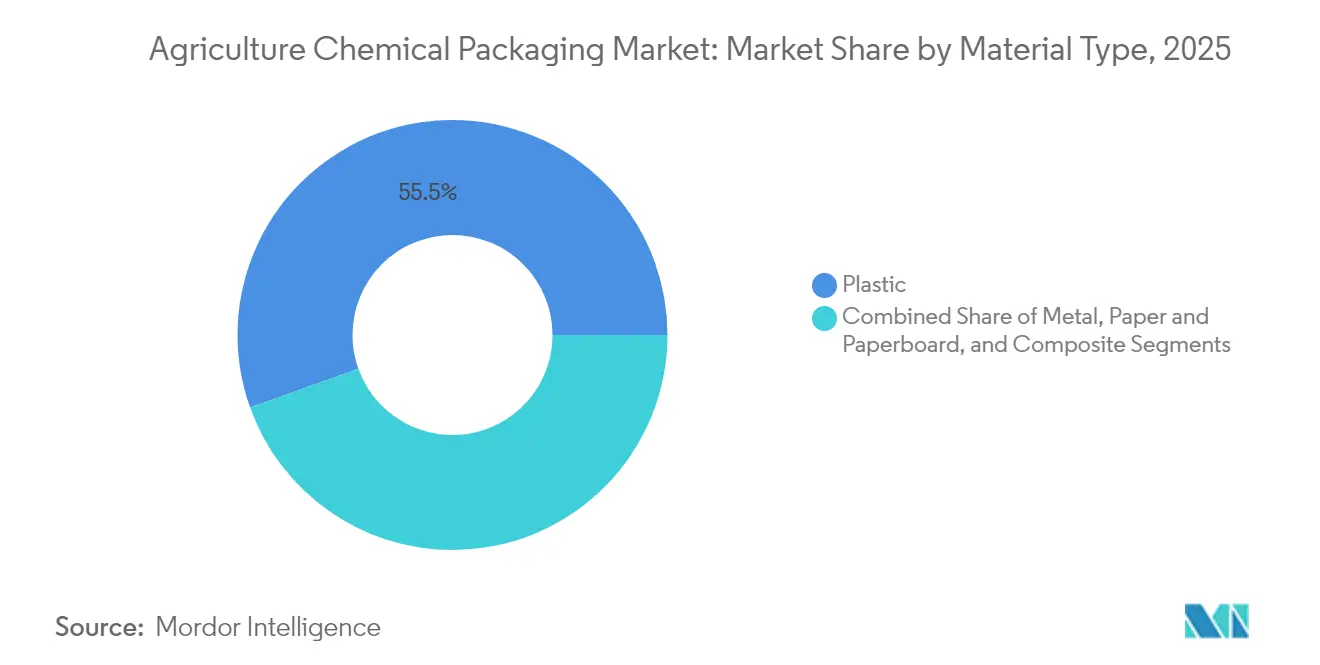
Composite Growth Outpaces Traditional PlasticsComposite solutions accounted for 18.86% of 2025 revenue yet are growing at 5.86% well above the 4.39% trajectory of the agriculture chemical packaging market. Their multilayer fiber-plastic drum bodies combine renewable paperboard exteriors with HDPE liners to cut resin use by up to 60% and facilitate carbon-footprint reductions requested by multinational crop-input suppliers. Meanwhile, plastic maintained a commanding 55.48% share because blow-molded HDPE bottles, PP woven sacks, and LDPE liners remain the default for cost-sensitive commodity fertilizers. Metals retain niche relevance for volatile solvent-based pesticides and pressurized fumigants where tamper resistance outweighs weight penalties. Paper and paperboard are re-entering the conversation via 95% paper-based cans that shield dry formulations without compromising recyclability. Over the forecast horizon, hybrid composites are poised to absorb incremental volume, particularly in regulated regions requiring lower permeation and improved life-cycle metrics. Their alignment with corporate ESG goals positions them to capture larger slices of the agriculture chemical packaging market size as brand owners set resin-reduction KPIs and mandate renewable content thresholds.
Rigorous chemical compatibility testing now validates composite drums for high-acid fertilizers and certain herbicides, easing historical adoption barriers. Rapid fiber-drum line retrofits cost 20-25% less than installing new all-plastic drum machines, encouraging converters to diversify portfolios amid resin price uncertainty. Elevated freight costs also favor lighter-weight composites, especially for inland distribution in emerging markets with underdeveloped rail infrastructure. Regulators in the EU and North America increasingly view composite containers as preferable under packaging taxes that penalize virgin-plastic intensity, creating pricing tailwinds for early adopters. Although raw-material supply chains for kraft paper and specialty adhesives require further scaling, composite formats appear set to erode plastic’s share, reinforcing their status as the hot-growth material segment within the agriculture chemical packaging market.

By Product Type:
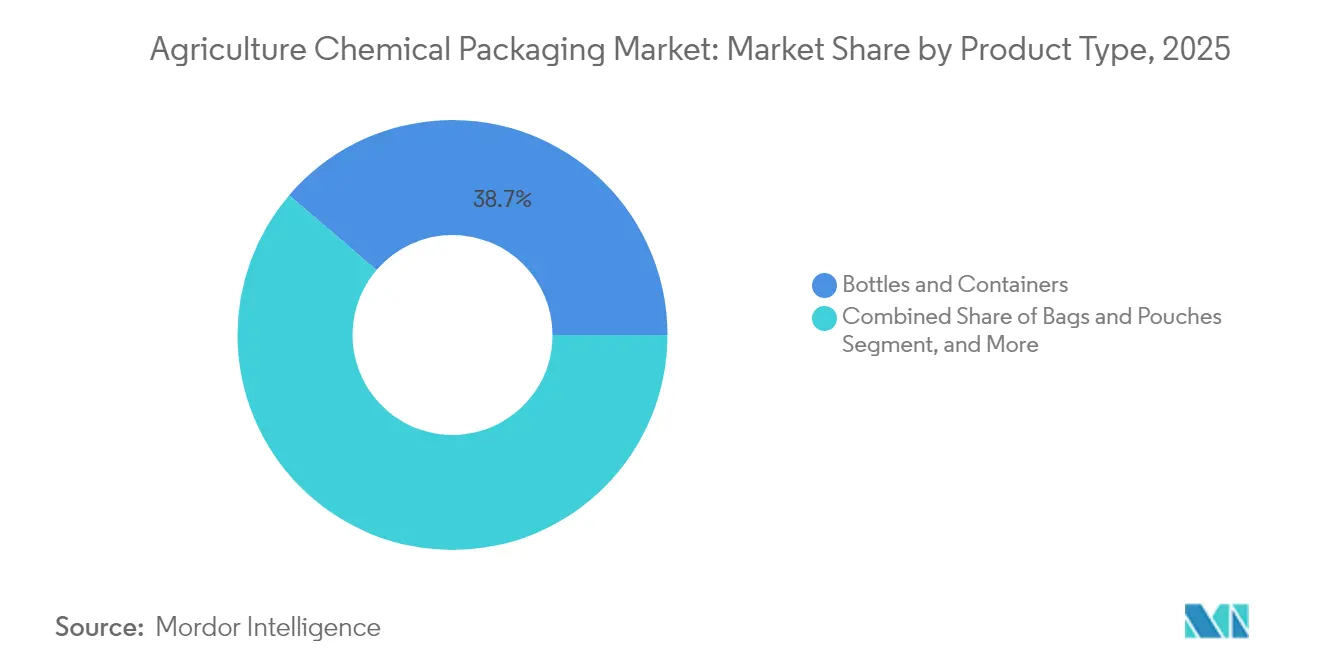
Flexible Formats Drive InnovationBottles and containers retained 38.74% of 2025 revenue, anchoring the agriculture chemical packaging market share through widespread use in liquid pesticide and micronutrient delivery. Yet bags and pouches will post a 6.19% CAGR as water-soluble polymers and high-barrier PE-PA laminates allow granular fertilizers and biological inoculants to be packaged in lightweight, shelf-stable configurations. Cost savings in logistics reach 25% on a per-ton basis because flat-packed pouches occupy less warehouse space and slash back-haul costs. Consumers appreciate single-use sachets that eliminate measuring error and reduce operator exposure, a critical factor in regions tightening worker-safety statutes.
The agriculture chemical packaging market size for drums and IBCs remains substantial because contract manufacturers favor bulk formats for intra-plant transfers and export shipments. Smart caps with RFID chips are being retrofitted on IBC lids, feeding traceability data into enterprise resource planning systems. Caps and closures, though small in tonnage, are achieving above-average margins by incorporating tethered designs that prevent litter and child-resistant features that satisfy regulatory upgrades. Advanced closure polymers, such as PE-PP blends with EVOH inserts, improve sealing performance against solvent-rich pesticide emulsions, minimizing leakage risk across harsh supply chains. As e-commerce penetration of crop inputs rises, demand for leak-proof secondary containment grows, presenting cross-selling opportunities for closure specialists within the agriculture chemical packaging market.
By Chemical:
Biologicals Surge AheadPesticides represented 51.12% of 2025 sales, mirroring their entrenched role in yield stabilization. Nevertheless, biologicals are tracking a 6.72% CAGR as regulators fast-track approvals for microbial, botanical, and peptide-based crop solutions that require gentler environmental profiles. Packaging for biologicals demands tight oxygen and moisture barriers, cold-chain compatibility, and ultra-low leachables to safeguard live cultures, prompting uptake of aluminized pouches, co-extruded bottles, and vacuum-sealed trays. Fertilizers, driven mainly by urea, NPK blends, and specialty micronutrients, stay volume-heavy but contend with commodity pricing swings that pressure per-unit packaging budgets. Adjuvants and surfactants hold niche but lucrative ground as they enable tank-mix optimization; their modest volumes encourage premium unit economics in custom-engineered bottles.
Biological adoption triggers cascading packaging implications. For instance, probiotic inoculants shipped to Brazil require refrigerated chain-of-custody. This need favors multilayer polypropylene tubes with barrier tie layers and high-clarity caps that allow visual inspection without UV exposure. Brand owners are also leveraging near-field communication tags within these formats to monitor temperature excursions. Such technical demands create white-space for converters capable of marrying pharmaceutical-grade standards with agricultural-scale economics, cementing biologicals as the fastest-growing revenue stream inside the agriculture chemical packaging market.
Geography Analysis
APAC Agriculture Chemical Packaging Market
Asia Pacific captured 39.02% of 2025 sales and is set to clock a 5.28% CAGR through 2031, preserving its lead in both volume and velocity. Government incentives for green packaging in China and the expansion of Indian fertilizer subsidies steer demand toward multilayer drums, high-barrier pouches, and refillable container programs. Southeast Asia’s emergence as an alternative production hub amplifies intra-regional container shipments, and the region’s lower labor costs support the rapid scaling of reconditioning depots. Preference for localized supply chains further spurs investment in cap and closure production, reducing dependency on imports and shortening turnaround times.
North America Agriculture Chemical Packaging Market
North America generated 24.18% of the 2025 value, ranking second behind the Asia Pacific. Tough EPA volatility rules and state-level plastic taxes are accelerating the shift toward HDPE-EVOH multilayer bottles and closed-loop IBC fleets, nurturing premium pricing streams. Producers invest in digitized pallets and blockchain-enabled labels to satisfy distribution audits, and yield-intensive row-crop belts adopt smart drip-fertigation that pulls flexible innovation into the mainstream. The agriculture chemical packaging market size in North America also benefits from the reshoring of certain pesticide formulations, reinforcing demand for domestic packaging capacity.
Europe Agriculture Chemical Packaging Market
Europe contributed 19.62% of revenue in 2025 but sets many of the global regulatory benchmarks. The EU’s Packaging and Packaging Waste Regulation spurs converters to pilot 30% recycled-content HDPE drums and to embed unique identifiers for each container. Circularity targets foster partnerships between chemical multinationals and specialized recyclers, and this collaboration is spawning feedstock pools for high-grade post-consumer resin suitable for hazardous-goods applications. Despite a modest 3.08% CAGR, Europe’s innovation output influences technology diffusion into other continents, shaping the competitive dynamics of the agriculture chemical packaging market.
LATAM and MEA Agriculture Chemical Packaging Market
Latin America, anchored by Brazil, and the Middle East and Africa together account for roughly 17% of global revenue. In Brazil, the exponential uptake of biological crop inputs, advancing at more than 15% annually, creates specialized packaging needs that lean on cold-chain integrity. Meanwhile, Gulf Cooperation Council countries are piloting desalination-powered drip-irrigation projects that require water-soluble nutrient packs suitable for saline environments. Though smaller today, these markets represent substantial upside over the next decade as climate-resilience investments multiply.
Mordor Intelligence provides coverage of the agriculture chemical packaging market across other key regional markets, including North America, each with their regulatory frameworks and demand patterns.
Regulatory Landscape
Agriculture chemical packaging is shaped by overlapping hazardous-chemical labeling and container management regimes that influence pack-format, label-space, and material choices. In the United States, pesticide packaging and labeling requirements under FIFRA and 40 CFR Part 156 require registrants to specify container status (refillable vs nonrefillable) and include residue removal instructions, which links packaging specifications to EPA label review practices (including electronic label submission initiatives such as OPPEL).
In Europe, the revised Classification, Labelling and Packaging framework (Regulation (EU) 2024/2865) entered into force on 10 December 2024 and introduces updated labeling approaches such as digital labeling and fold-out label flexibility. Major obligations are scheduled to apply from 1 July 2026, with transitional arrangements for existing stock into 2028/2029. In practice, these requirements reinforce the need for unique identifiers and track-and-trace capabilities highlighted in the market context under the EU PPWR, supporting demand for compliant label solutions and packaging designs that maintain hazard communication across multiple pack sizes.
Value Chain Analysis
The value chain starts with resin and additive suppliers (including HDPE and PP, and barrier tie layers such as EVOH), then colorants and labelstock providers, before moving into converters that produce bottles, jerrycans, drums, IBCs, bags and pouches, and caps and closures. Packaging then flows to agrochemical formulators and contract filling plants, where UN performance packaging compliance, leak integrity, and label application are checked ahead of distribution through wholesalers, cooperatives, and retailers to farms. Reverse flows increasingly feed back into the chain as collection, triple-rinse compliance, high-pressure washing, recertification, and reconditioning services for drums and IBCs support closed-loop programs and add recurring service revenue to new-pack sales.
Key handoffs are centered on logistics and compliance. 2026 freight disruption narratives, including rerouting and higher insurance on certain routes, alongside packaging material availability shocks, have reinforced the value of regionalized sourcing for closures, liners, and labelstocks. At the same time, compatibility testing and regulatory registration timelines slow rapid material substitution. In Brazil, end-of-life collection capability under systems such as the Campo Limpo model illustrates how reverse-logistics infrastructure affects adoption of returnable and reconditioned formats, connecting farm-level disposal compliance with converter investments in washing capacity and traceable container fleets.
Competitive Landscape
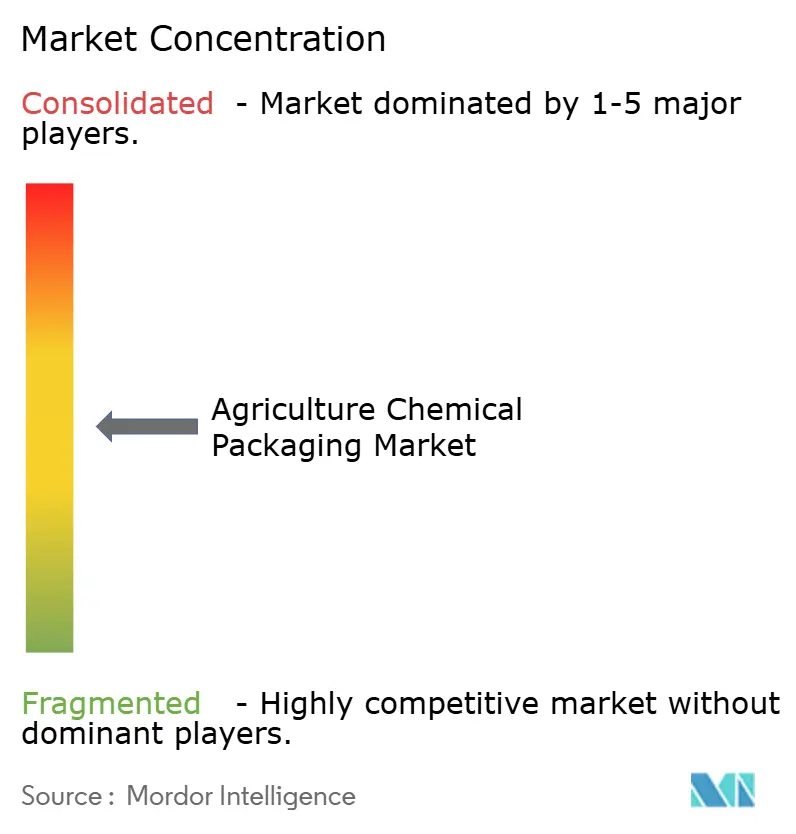
The agriculture chemical packaging market remains moderately fragmented, with the top five suppliers holding around 35% of 2024 sales. Greif, Mauser Packaging Solutions, Amcor, and ALPLA exhibit global footprints, diversified material portfolios, and integrated recycling or reconditioning units that support closed-loop contracts. Amcor’s USD 8.4 billion merger with Berry Global, expected to close in 2025, will consolidate extrusion, injection-molding, and flexible converting assets, unlocking cost synergies and an expanded innovation pipeline targeting agriculture chemical barriers. Greif’s USD 1.8 billion divestiture of its containerboard mills to Packaging Corporation of America frees capital for specialty IBC and drum upgrades, evidencing a strategic pivot toward higher-margin chemical packaging.
Strategic moves now tilt toward establishing regional reconditioning hubs, expanding post-consumer resin capacity, and embedding digital traceability features into caps and liners. ALPLA’s planned EUR 50 million (USD 55 million) annual recycling spend aims to double global processing capacity to 700,000 tonnes by 2030, ensuring supply of food-grade and agro-grade recycled HDPE. Mauser, meanwhile, is piloting blockchain-enabled fleet management for its Infinity series reconditioned IBCs, offering customers real-time access to lifecycle metrics and carbon accounting dashboards. New entrants focus on narrow niches such as biobased barrier resins or collapsible bag-in-box systems for fertilizer concentrates, often leveraging venture funding to scale faster than traditional players.
Competitive success now hinges on balancing capital allocation between circular-economy mandates and high-barrier innovation for emerging biologicals. Suppliers that vertically integrate digital printing, RFID inlay, and data analytics stand to capture share as regulatory audits push brand owners to demand package-level visibility. Conversely, commodity producers reliant on single-use rigid formats face price erosion and growing substitution risk as the agriculture chemical packaging market transitions toward smarter, lighter, and more circular solutions.
Agriculture Chemical Packaging Industry Leaders
-
Greif, Inc.
-
Mauser Packaging Solutions LLC
-
United Caps Holding SA
-
Nexus Packaging Ltd
-
P. Wilkinson Containers Ltd
- *Disclaimer: Major Players sorted in no particular order
Agriculture Chemical Packaging Market Companies Covered in this Report
- Greif, Inc.
- Mauser Packaging Solutions LLC
- Amcor plc
- Mondi plc
- United Caps Holding SA
- Ipackchem Group SAS
- ALPLA-Werke Alwin Lehner GmbH & Co KG
- BERICAP Holding GmbH
- Nexus Packaging Ltd
- P. Wilkinson Containers Ltd
- KSP International FZE
- Novolex Holdings LLC
- NNZ B.V.
- LC Packaging International B.V.
- Sonoco Products Company
- Smurfit Kappa Group plc
- Constantia Flexibles GmbH
- Flex-Pack Engineering LLC
Market Opportunities and Future Outlook
Compliance-led labeling and information management create a commercialization lane for converters and component suppliers that can combine physical labels with digital access, serial identifiers, and durable inks or adhesives compatible with agrochemical exposure. The EU revised CLP framework (entered into force in December 2024, with key obligations applying from 1 July 2026) elevates the role of space-efficient formats such as fold-out labels and digital labeling. The report context also points to smart track-and-trace mandates under the EU PPWR, which shifts demand toward packaging platforms that pair barrier performance with pack-level data capture, especially for IBCs, drums, and higher-value pesticides and biologicals moving through audited distribution.
Material and format redesign also continues to open opportunity pockets tied to circularity and safety systems. Amcor and De Ceuster Meststoffen (DCM) introduced a mono-material PE fertilizer packaging film with 35% post-consumer recycled content (March 2026), showing that higher-PCR content can be piloted in agricultural input packaging where performance is maintained. In parallel, Corteva piloted easyconnect packaging on Pixxaro (January 2025), reflecting demand for caps and closures that reduce operator exposure and support more controlled dispensing. Alongside the market context on closed-loop IBC reconditioning and high decontamination costs, these moves point to room for scalable wash and recertification capacity and design-for-cleaning features that reduce lifecycle cost per trip for returnable containers.
Recent Industry Developments in Agriculture Chemical Packaging Market
- April 2026: Greif reported its fiscal second quarter 2026 results, emphasizing its focus on industrial packaging products and services after completing the prior divestiture of its containerboard business. The update reinforced management attention and capital capacity around drums, IBCs, and related lifecycle services that are directly relevant to agrochemical packaging demand.
- October 2025: Greif introduced a 20-liter in-mold barrier (IMB) jerrycan in Brazil, described as the lightest barrier jerrycan in the local market, developed in partnership with Syngenta. The launch highlighted lightweighting combined with barrier performance for agrochemical compatibility, strengthening competitive differentiation in rigid packaging for pesticides and other sensitive formulations.
- December 2024: The European Union revised its Classification, Labelling and Packaging (CLP) Regulation (Regulation (EU) 2024/2865) entered into force, modernizing rules such as digital labeling and fold-out label flexibility. This regulatory change increased the compliance value of label-enabled packaging solutions and accelerates investment in label space management and digitized information delivery for agricultural chemicals in Europe.
Agriculture Chemical Packaging Market Report Scope and Research Methodology
Market Definition and Coverage
This market covers packaging products used to store, handle, and transport agricultural chemicals from formulators to distributors and farms, counted in value terms. It includes primary packs and related components that are sold for fertilizers, pesticides, biologicals, and adjuvants and surfactants.
Scope exclusions: We do not count bulk chemical commodities without a packaging sale, farm-side storage tanks used after delivery, or packaging used only for non-agricultural industrial chemicals.
Segments Covered in This Report
- By Material Type
- Plastic
- Metal
- Paper and Paperboard
- Composite
- By Product Type
- Bags and Pouches
- Bottles and Containers
- Drums and Intermediate Bulk Containers
- Caps and Closures
- By Chemical
- Fertilizer
- Pesticide
- Biologicals
- Adjuvants and Surfactants
- By Geography
- North America
- United States
- Canada
- Mexico
- South America
- Brazil
- Argentina
- Chile
- Europe
- United Kingdom
- Germany
- France
- Italy
- Spain
- Russia
- Asia-Pacific
- China
- Japan
- India
- South Korea
- Australia and New Zealand
- Middle East and Africa
- Middle East
- United Arab Emirates
- Saudi Arabia
- Rest of Middle East
- Africa
- South Africa
- Nigeria
- Rest of Africa
- Middle East
- North America
Data Sources, Market Sizing, and Validation
Desk Research
Desk research starts with public data that shows how much crop protection and fertilizer activity exists, and what that implies for packaging demand. We referenced sources such as FAOSTAT for crop and input context, the US EPA pesticide program pages for regulatory signals, Eurostat for industry and trade statistics, and UN Comtrade for trade flows that help sense-check regional packaging movement.
To convert the demand picture into a practical market model, we also used company annual reports and investor decks to understand packaging mix, capacity adds, and resin or metal exposure, followed by reputed press and association updates on collection, reuse, and recycling rules. Where needed, we used paid subscriptions for company financials and intelligence, patent databases, and shipment-level import and export visibility to validate directionally whether volume and pricing assumptions were drifting. The desk sources listed above are illustrative only, and many other public documents were also reviewed for data collection, validation, and clarification.
Primary Interviews and Surveys
Primary work was used to pressure-test what desk sources cannot show clearly, especially pack-format splits, typical pack sizes, and pricing changes by chemical type and region. We spoke with a mix of packaging converters, material suppliers, agrochemical formulators, and distribution-side stakeholders across the main consuming regions, and then we used follow-up checks to confirm whether assumptions matched real buying patterns and compliance needs.
Distribution of primary research fieldwork respondents
| Company type | Respondent position | Region |
|---|---|---|
| Top tier: 39% | CXOs: 16% | APAC: 42% |
| Mid tier: 40% | Functional/Unit leaders: 25% | EMEA: 37% |
| Smaller Players: 21% | Managers: 59% | Americas: 21% |
Market-Sizing & Forecasting
Sizing starts with a top-down build where crop input demand indicators are translated into packaging value pools by region and chemical group, and then mapped to typical pack formats that move through the channel. In practice, we use a structured split across fertilizers, pesticides, biologicals, and adjuvants and surfactants, followed by packaging types such as bottles and containers, drums and intermediate bulk containers, and bags and pouches, so totals stay consistent with how products are shipped.
To keep the model grounded, we corroborate totals with selective bottom-up approximations from supplier roll-ups, sampled price-per-pack checks, and channel feedback on volume movement, and then gaps are handled using conservative assumptions that are re-tested in interviews. Inputs that matter in this market include agrochemical application intensity by region, crop acreage patterns, shift toward larger pack sizes for farms and bulk handling, changes in barrier requirements and closures for safety, and resin and metal price direction that influences average selling prices.
For forecasting, scenario analysis is applied around debated drivers, such as regulatory packaging requirements, adoption pace of biologicals, and substitution between rigid and flexible formats, and then exponential smoothing is used at the regional total level so short-term spikes do not distort the outlook. Assumptions are adjusted only after they are consistent across demand signals, supplier feedback, and observed pricing movement.
Data Validation & Update Cycle
Validation is done through multiple checks so the final totals do not rely on one data stream. We compare outputs against independent signals like agrochemical consumption direction, trade movement, and packaging material demand proxies, and then any unusual jumps in share or pricing are reviewed again with source notes and re-contact checks where needed.
Before sign-off, the model is reviewed step-by-step by another analyst, followed by a final sanity check on growth rates, currency consistency, and regional splits. Reports are refreshed annually, and interim updates are triggered when material events occur, such as major regulatory shifts, sharp feedstock price moves, or notable capacity additions. Right before delivery, we do a last pass so clients receive the most current view available at that time.
Mordor Intelligence's Agriculture Chemical Packaging Market Size Measured Against Other Published Estimates
Published market sizes for agriculture chemical packaging can vary even when the topic label looks similar, because the scope and the counting rules are not the same across sources. Differences often come from whether caps and closures are included, how intermediate bulk containers are treated, which chemical groups are counted, and what year is used as the base for currency conversion.
In our review, the biggest gaps typically show up when adjacent packaging used outside farm chemical distribution is added in, or when estimates assume aggressive price growth without checking typical pack-level price changes.
Benchmark comparison
| Source | Market Size | Gaps in Research Methodology |
|---|---|---|
| Mordor Intelligence | USD 6.67 B (2025) | |
| Trade Journal A | USD 4.10 B (2022) | Uses an earlier base year and a narrower value pool that can undercount larger rigid packs and closures, and it may not fully reflect biologicals and adjuvants in the same way. |
| Industry Blog B | USD 6.45 B (2025) | Often relies on a long-range growth narrative with limited transparency on pack-format splits and price progression, which can shift the 2025 total depending on assumed ASP inflation. |
The table shows that year choice and what gets counted inside the packaging bill of materials explain much of the variance. When caps and closures and IBC-related packaging are counted only when shipped with agricultural chemical packs, and the pricing assumptions are refreshed using resin and metal cost movement cross-checks, the total stays traceable, a treatment applied by Mordor Intelligence.
Key Questions Answered in the Report
How large is the agriculture chemical packaging segment in 2026?
It is valued at USD 6.96 billion and is projected to reach USD 8.64 billion by 2031.
What is the expected compound annual growth rate through 2031?
The category is forecast to expand at a 4.39% CAGR over the 2026-2031 period.
Which geographic region leads sales and growth?
Asia Pacific holds 39.02% of 2025 revenue and is advancing at a 5.28% CAGR.
Which packaging material shows the fastest expansion?
Composite drums and related hybrids post a 5.86% CAGR, outpacing plastics, metals and paper.
What product format is gaining the most traction with precision agriculture?
Bags and pouches, especially water-soluble or concentrated sachets, are growing at a 6.19% CAGR on the back of drip-fertigation uptake.
Who are the three most prominent suppliers today?
Greif, Mauser Packaging Solutions and Amcor together control just over 28% of global revenues, illustrating a moderately fragmented field.