Pre-Terminated Systems Market Size and Share
Market Overview
| Study Period | 2019 - 2030 |
|---|---|
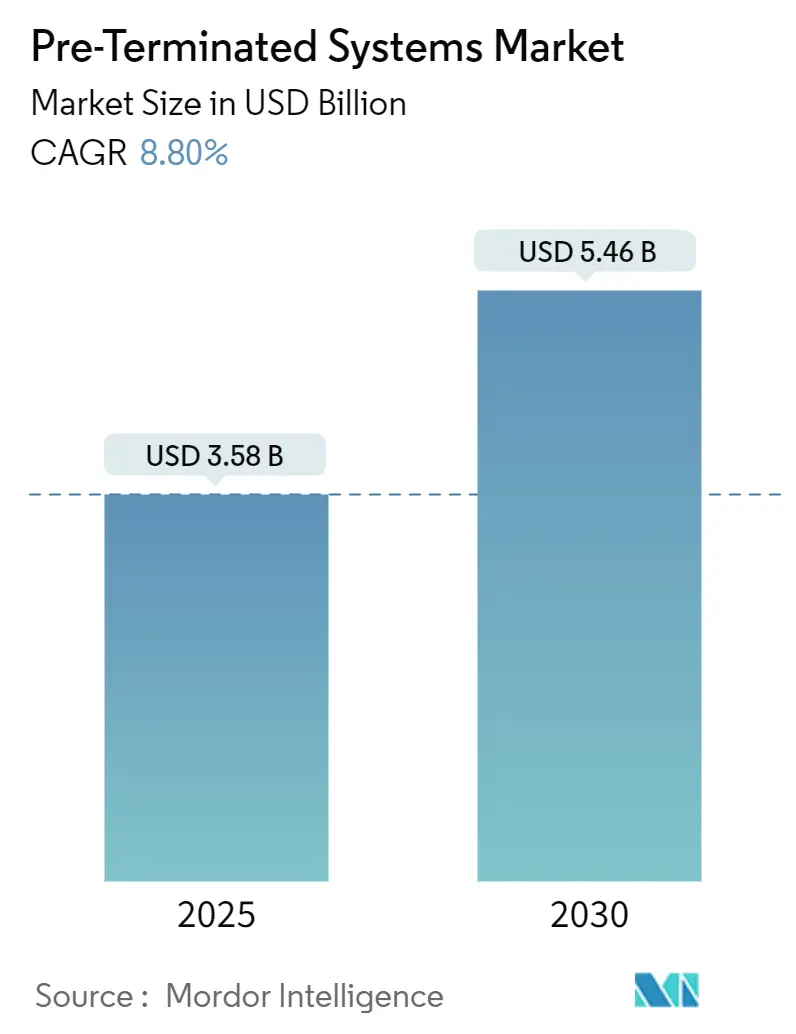
| Market Size (2025) | USD 3.58 Billion |
| Market Size (2030) | USD 5.46 Billion |
| Growth Rate (2025 - 2030) | 8.80% CAGR |
| Fastest Growing Market | South America |
| Largest Market | North America |
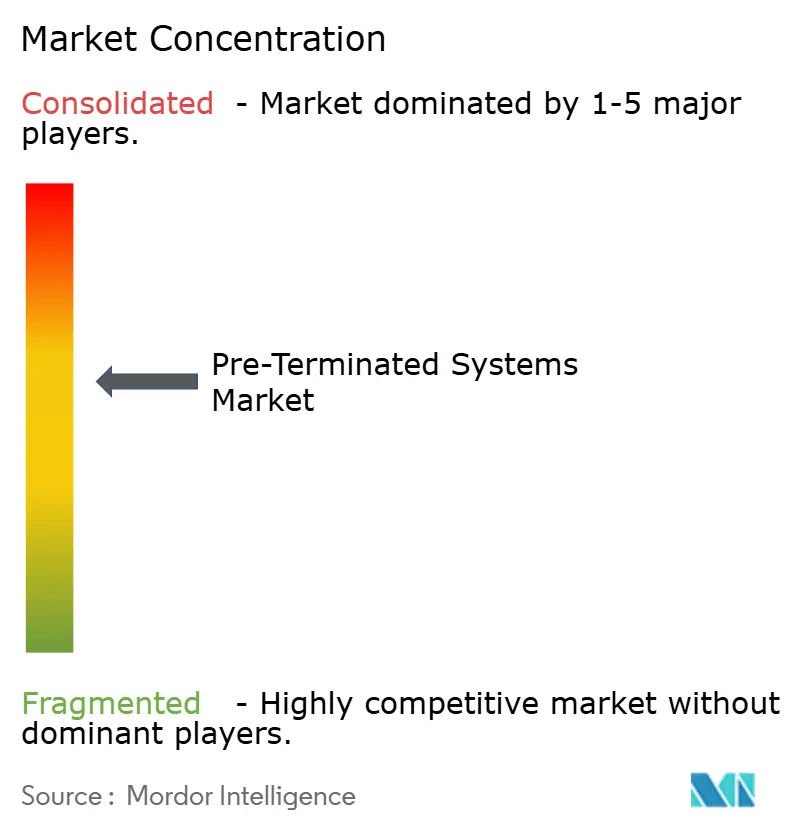
| Market Concentration | Medium |
Major Players *Disclaimer: Major Players sorted in no particular order Image © Mordor Intelligence. Reuse requires attribution under CC BY 4.0. | |
Pre-Terminated Systems Market Analysis by Mordor Intelligence
The Pre-Terminated Systems market size stood at USD 3.58 billion in 2025 and is projected to reach USD 5.46 billion by 2030, reflecting an 8.80% CAGR over the forecast period. Rapid hyperscale data-center construction, 5G fronthaul and backhaul roll-outs, and embodied-carbon regulations are motivating owners to specify factory-built cabling that eliminates field terminations and shortens installation schedules. Parallel-optics architectures running at 400 G and 800 G are strengthening demand for micrometer-grade connector alignment that only pre-terminated assemblies can guarantee. Escalating copper prices-peaking at USD 5.20 per pound in May 2024-are nudging buyers toward labor-saving systems that offset material premiums through lower on-site hours. Policy tailwinds such as the United States BEAD program and India’s Digital Bharat push are widening addressable opportunities across rural broadband and greenfield mobile sites. Competitive dynamics remain fluid as Amphenol’s USD 10.5 billion acquisition of CommScope redrew the supplier landscape and accelerated vertical integration.
Key Report Takeaways
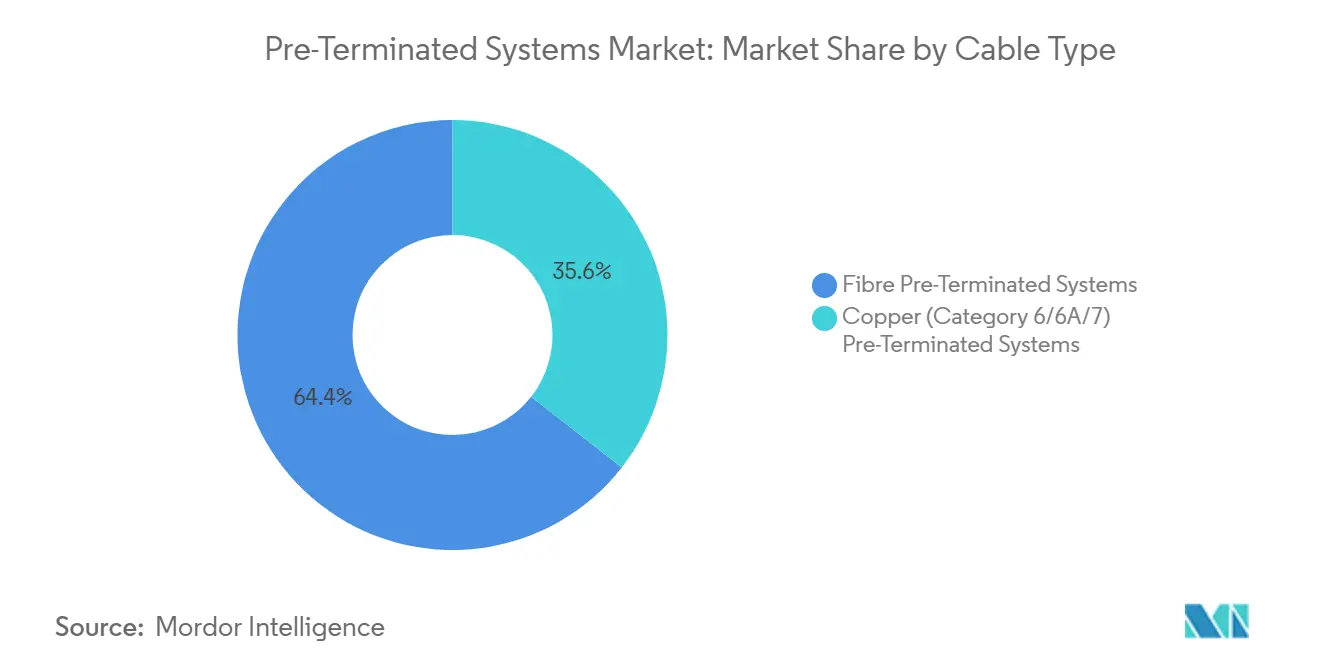
- By cable type, fiber solutions captured 64% of Pre-Terminated Systems market share in 2024, while Category 6A copper systems are advancing at an 11.21% CAGR through 2030.
- By connector type, MPO/MTP devices held 40% revenue share in 2024; RJ-45 connectors register the fastest growth at a 9.83% CAGR.
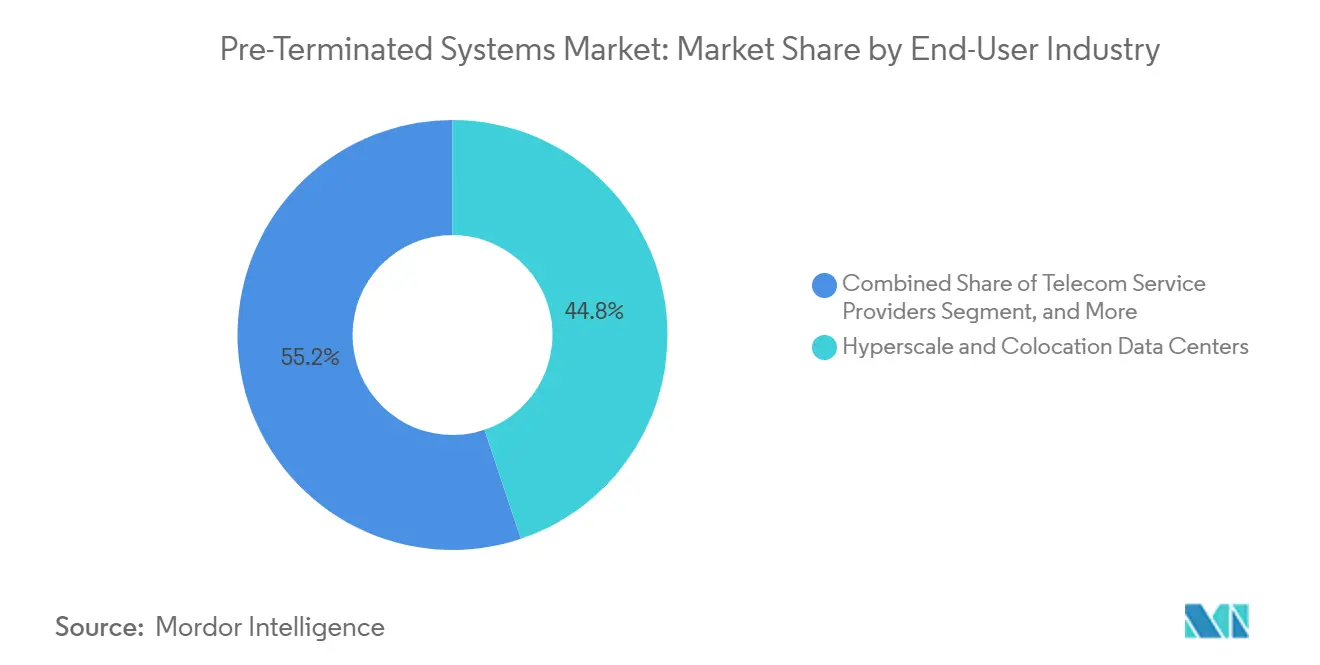
- By end-user industry, data centers led with 45% share in 2024, whereas enterprise campuses are expanding at a 9.11% CAGR to 2030.
- By application, structured premises cabling represented 38% of the Pre-Terminated Systems market size in 2024 and is tracking a 9.32% CAGR.
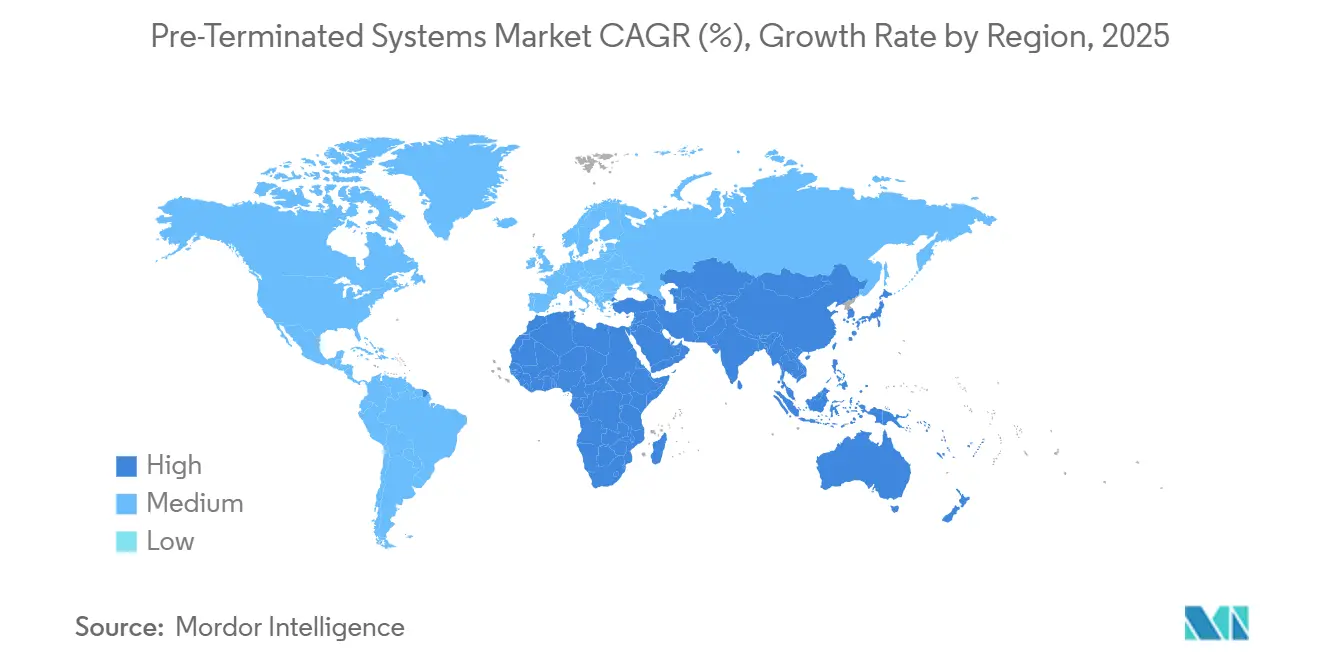
- By geography, North America contributed 35% revenue in 2024; South America shows the highest regional CAGR at 8.97% through 2030.
Global Pre-Terminated Systems Market Trends and Insights
Drivers Impact Analysis*
| Driver | (~) % Impact on CAGR Forecast | Geographic Relevance | Impact Timeline |
|---|---|---|---|
| Hyperscale data-center build-outs after 2025 | +2.1% | Global, concentrated in North America and Asia-Pacific | Medium term (2-4 years) |
| Global 5G fronthaul and backhaul fiberisation wave | +1.8% | Asia-Pacific core, spill-over to Europe and North America | Long term (≥ 4 years) |
| Labour-saving installation cuts (pre-terminated vs field) | +1.5% | Global, particularly high-labor-cost regions | Short term (≤ 2 years) |
| AI/ML cluster demand for 400G/800G parallel optics | +1.9% | North America and EU, expanding to Asia-Pacific | Medium term (2-4 years) |
| U.S. BEAD rural-broadband funding favouring prefab fiber drops | +0.8% | United States, rural and underserved areas | Medium term (2-4 years) |
| Embodied-carbon mandates pushing factory-built cabling | +0.9% | EU leading, North America following | Long term (≥ 4 years) |
| Source: Mordor Intelligence | |||
Hyperscale Data-Center Build-Outs After 2025
NTT Data’s USD 1.5 billion pledge to double India’s capacity to 700 MW by 2027 epitomizes the runaway scale that is reshaping the Pre-Terminated Systems market.[1]NTT Data Corporation, “NTT Data to Double India Data-Center Footprint,” nttdata.com Operational capacity across Asia-Pacific already tops 12,206 MW with another 14,338 MW under development, prompting designers to favor VSFF connectors that triple port density against legacy MPO layouts. Factory-terminated trunks slash deployment cycles from months to weeks, which is critical in markets where a two-month power-reservation window can determine a hyperscaler’s go-live slot. The migration to 400 G / 800 G links demands tolerances of a few micrometers, a precision level field terminations rarely meet at volume. Consequently, pre-terminated assemblies are progressing from best practice to baseline specification for every new hyperscale hall.
AI/ML Cluster Demand for 400 G / 800 G Parallel Optics
Corning’s Compact Versatile Small Form Factor connector line enables 400 G and 800 G lanes inside one-third the footprint of traditional MPOs. AI clusters with thousands of GPUs resort to east-west traffic patterns where single-mode parallel optics outperform spine-leaf copper backplanes. Pre-terminated trunks provide uniform insertion loss across dozens of links, a prerequisite for deterministic latency during model training runs that can span several weeks. Sumitomo Electric’s MMC connectors push port density up to 144 ports per 1U panel, a threefold gain that eases rack-space bottlenecks.[2]Sumitomo Electric Industries, “MMC Connector Overview,” sumitomo-electric.com The architectural necessity for deterministic signal integrity makes factory-terminated cables non-negotiable in GPU pod build-outs, embedding the pre-terminated Systems market deep into every AI capex cycle.
Global 5G Fronthaul and Backhaul Fiberisation Wave
India’s annual fiber demand is on track to triple to 60 million fkm by 2030 as operators race to meet densification targets. Clearfield’s plug-and-play kits helped Blue Ridge Communications halve installation time within multi-dwelling units, validating the return on pre-terminated drops. 5G fronthaul topologies rely on tight bend radii and polarised fiber mapping, both of which are factory-verified before shipment to the site. Compliance with ANSI/TIA-568.5-1 has become easier because cable identifiers and end-face geometries leave the plant fully certified. As 5G upgrades extend to mid-band and millimeter-wave spectrum, network engineers are pre-ordering prefab cassettes to accelerate cell-site commissioning during narrow deployment windows secured with municipal authorities.
Labour-Saving Installation Cuts
HellermannTyton demonstrated that RapidNet harnesses cut fiber installation time by 95% and copper runs by 85% compared with field terminations. Corning’s FlexNAP service compressed GoNetSpeed’s FTTP rollout from six months to three weeks, freeing trenching crews for the next build phase. Skilled technicians command premium wages in the United States, Germany, and Japan, where labor often exceeds 50% of total network-build cost. By removing epoxy curing, on-site polishing, and re-termination wastage, prefab cables improve project cash-flow and reduce change-order disputes between prime contractors and subcontractors. As union-mandated minimums rise annually, the labor-offset calculus keeps tilting toward pre-terminated solutions, reinforcing their share in the Pre-Terminated Systems market.
Restraints Impact Analysis*
| Restraint | (~) % Impact on CAGR Forecast | Geographic Relevance | Impact Timeline |
|---|---|---|---|
| Higher upfront material cost than field-terminated kits | -1.2% | Global, particularly price-sensitive markets | Short term (≤ 2 years) |
| Legacy mixed-media infrastructure compatibility issues | -0.8% | North America and Europe with aging infrastructure | Medium term (2-4 years) |
| Length-mismatch scrap and return risk | -0.6% | Global, concentrated in complex installations | Short term (≤ 2 years) |
| MPO/MTP ferrule supply-chain tightness for ≥ 16-fibre arrays | -0.9% | Global, acute in Asia-Pacific manufacturing hubs | Medium term (2-4 years) |
| Source: Mordor Intelligence | |||
Higher Upfront Material Cost Than Field-Terminated Kits
Copper’s rally to USD 5.20 per pound in May 2024 forced many vendors to raise catalog prices by up to 45%. Procurement teams in South America face an additional 35% tariff on imported fiber components, widening the visible gap between prefab and bulk cable costs. Although total installation outlays often favor factory builds, budget owners default to line-item comparisons that overlook labor offsets. Volatile foreign-exchange swings can widen that spread when purchase orders are priced in USD yet settled in local currencies. Consequently, deployments in Brazil, Argentina, and parts of Southeast Asia sometimes revert to field terminations during CapEx freezes, shaving a few points off the Pre-Terminated Systems market CAGR in the near term.
MPO/MTP Ferrule Supply-Chain Tightness for ≥ 16-Fiber Arrays
US Conec lead times for 16-fibre ferrules stretched to 16 weeks at the end of 2024 as demand from hyperscalers outpaced incremental capacity.[3]US Conec Ltd., “MTP High-Fibre Ferrule Lead-Time Notice,” usconec.com The ultra-flatness and hole-spacing tolerances required for high-count arrays limit the supplier pool to a handful of Japanese and U.S. grinders. When lead times jump, contractors either stockpile inventory-tying up working capital-or delay rack build-outs, both of which add cost. Specialized connectors also incur air-freight premiums when sea transport would breach project milestones. Unless machining automation ramps markedly, ferrule constraints will temper the upside of the Pre-Terminated Systems market size through 2027.
*Our forecasts treat driver/restraint impacts as directional, not additive. The impact forecasts reflect baseline growth, mix effects, and variable interactions.
Segment Analysis
By Cable Type: Fiber Keeps Momentum While Category 6A Surges
Fiber solutions held 64% of the Pre-Terminated Systems market share in 2024, a proportion anchored by hyperscale data-center corridors and 5G fronthaul loops. The segment’s traction secures its role as both volume leader and innovation incubator, with VSFF, bend-insensitive single-mode, and low-loss OM5 garnering design-in preferences. Conversely, Category 6A copper is growing at an 11.21% CAGR, propelled by building re-cabling cycles and Power-over-Ethernet applications in campus smart-lighting grids. The Pre-Terminated Systems market size for Category 6A trunks is projected to reach USD 1.14 billion by 2030, underscoring copper’s staying power in short-reach zones that demand simultaneous power delivery. Electromagnetic-shielded Category 7 remains a niche option in radio and defense installations. Category 8 cabling, codified in the 2024 ANSI/TIA-568.2-D release, opens new lanes for 25 GBASE-T and 40 GBASE-T switch-to-server links, but its cost premium confines adoption to select high-performance clusters.
Strategic activity supports the shift. Belden’s July 2024 purchase of Precision Optical Technologies added transceiver expertise that enhances its vertically integrated fiber assemblies. Meanwhile, CommScope’s asset divestiture sharpened Amphenol’s cross-platform roadmap, fusing copper plant capacity with optical design IP. Vendors are also bundling hybrid composite cables that run power through copper pairs and data through fiber, addressing stadium Wi-Fi and surveillance rollouts. These hybrid innovations expand the Pre-Terminated Systems market by blurring the line between pure fiber and pure copper estates.


By Connector Type: MPO/MTP Remains on Top as VSFF Breaks Through
MPO/MTP connectors delivered 40% revenue in 2024 and remain entrenched in data-center main corridors. Yet RJ-45 posts the fastest 9.83% CAGR as enterprise edge switches upgrade to multi-gig speeds without ditching copper patch panels. LC and SC duplexes keep serving telecom central offices and MATV head-ends that value individual fiber routing. The Pre-Terminated Systems market size tied to VSFF devices-MMC, SN, and CS-will accelerate as TIA-942-C explicitly endorses them for new racks. Early adopters such as European AI clusters already run 864-fiber trunks with VSFF fan-outs that triple port count per rack unit, driving cooling efficiency.
Sumitomo Electric’s MMC samples crest 400 G throughput in laboratory validation, stirring a migration roadmap away from MPO when port density trumps trunk simplicity. US Conec’s MTP PRO adds field-reversible polarity and gender features, a boon for multi-tenant colocation suites where every airflow reversal matters. As performance envelopes tighten, insertion-loss budgets squeeze field-terminated options out of contention, reinforcing the brand equity of precision-molded connectors that roll off automated lines.
By End-User Industry: Data Centers Dominate, Campuses Catch Up
Hyperscale and colocation facilities locked in 45% of the Pre-Terminated Systems market revenue in 2024 as AI and cloud workloads intensified cabling density. These operators are investing in 1,200 W per-rack cooling envelopes that depend on tightly packed optical harnesses. Pre-Terminated Systems market size for data-center orders is forecast to expand at 8.4% CAGR to 2030 as 800 G optics and co-packaged optics push connector counts upward. Campus estates spanning higher education, corporate HQs, and healthcare are pacing the highest 9.11% CAGR, catalyzed by Wi-Fi 7 backbones and smart-building sensors.
QuadReal’s adoption of passive optical LAN cut opex up to 70%, illustrating how energy savings compound the labor advantage of prefab trunks. Telcos remain a stable anchor segment, funneling rural broadband subsidies into prefab drop cables that comply with strand mapping templates. Industrial automation applications turn to ruggedized, pre-engineered solutions that withstand vibration and chemical exposure; Panduit’s assemblies trimmed commissioning time by 75% at a Canadian beverage plant. Pre-terminated broadcast harnesses continue to secure slots in remote production trailers where speed of setup is paramount during touring events.

By Application: Structured Cabling Retains the Center of Gravity
Structured premises cabling claimed 38% of 2024 revenue and is on track for a 9.32% CAGR. Building owners value the standards-based labeling discipline that a factory process enforces. Data-center interconnect trunks that stitch leaf-spine fabrics often ship in 24- to 2,016-fiber counts with pulling eyes and reel-to-rack measurement precision, protecting the Pre-Terminated Systems market share among design-build contractors. Edge and modular data-centers rely on single-order kitting to bring eight-week lead times down to four, accelerating time-to-revenue in colocation pods.
Corning’s EDGE Rapid Connect platform can carry 34,560 fibers in one factory-labeled assembly and cuts installation time by 70%. FTTH/FTTx drops pre-configured with SC/APC connectors, let technicians complete connectorization without splicing vans. 5G X-haul topologies orbit around color-coded trunk lines that ensure rapid SSA to DU connectivity, avoiding incorrect patching that could force truck rolls in remote sites. Together, these workflows reinforce the structured approach anchored in the Pre-Terminated Systems market.
Geography Analysis
North America commanded 35% revenue in 2024, behind a highly concentrated hyperscale footprint and the United States BEAD program that earmarked USD 42.5 billion for broadband builds. Amphenol recorded USD 15.2 billion in sales in 2024, a 21% year-on-year jump traceable to AI cabling demand. Multistate fiber overlays and Canadian edge-data-center corridors maintain a robust pull-through for prefab fiber harnesses. Supply chains pivoted to domestic production after Belden inaugurated a 300,000-sq-ft Fiber Technology Center in Tucson, enabling same-day shipping of pre-terminated kits.
South America is the fastest mover at 8.97% CAGR through 2030 as fiber maturity lags, but uptake accelerates. Claro’s USD 7.7 billion fiber and 5G program in Brazil is one of the region’s bellwethers. Yet 35% tariffs on optical gear inflate bill-of-materials costs, pressuring operators to recoup labor offsets more aggressively. V.tal’s purchase of Oi’s network for BRL 6 billion highlights an M&A spree that aims to create neutral fiber wholesalers. Argentine municipalities that host Amazon’s Project Kuiper gateways will need integrated satellite-terrestrial cabling, forming a new niche for ruggedized, pre-terminated assemblies.
Europe maintains mid-single-digit growth buoyed by energy and carbon regulations. The European Commission’s March 2024 sustainability rating pushes data-center builders toward lower embodied-carbon materials, favoring factory-produced cable sets. Germany’s 800 G trial corridors and France’s cloud-sovereignty investments secure ongoing demand. Asia-Pacific sustains scale through China’s and India’s data-center pipelines, yet capacity crunches in ferrule grinding challenge delivery schedules. The Middle East and Africa are nascent but promising; Saudi Arabia’s NEOM smart city and the UAE’s edge clusters require zero-downtime deployment models where pre-terminated kits offer built-in redundancy.

Competitive Landscape
The Pre-Terminated Systems market exhibits moderate fragmentation with a handful of vertically integrated majors and a broad long-tail of regional specialists. Amphenol’s USD 10.5 billion purchase of CommScope’s cabling unit established the largest single supplier by combining high-production connector lines with fiber and copper plant assets. US Conec continues to steer MPO form-factor evolution via MTP PRO field-re-genderable technology that improves installer flexibility. Corning leverages patented Fast-Track factories to promise 70% faster rollouts, sealing multi-year agreements with colocation giants.
Belden intensified its optical posture through the Precision Optical Technologies acquisition, adding transceiver design to its wiring portfolio. Its Arizona Fiber Technology Center gives downstream integrators overnight access to pre-labeled trunks, a logistical differentiator in an era of tight construction windows. Smaller niche players thrive in engineered-to-order corners such as form-factor-agnostic break-out kits for broadcast trucks. Patent portfolios, supply-chain depth, and automation all drive competitive advantage, while customers hedge risk by dual-sourcing assemblies across at least two continents.
Price pressure materializes mainly in commoditized duplex fiber links, whereas AI-optimized 16-fiber or 32-fiber assemblies fetch premium margins. Sustainability credentials and cradle-to-gate carbon disclosures are becoming tender prerequisites in Europe, nudging laggards to retrofit plants with renewable energy. Overall, rivalry centers on who can deliver certified bundles on tight deadlines rather than on raw cable cost, keeping switching costs high and buyer power modest across most verticals.
Pre-Terminated Systems Industry Leaders
TE Connectivity Ltd.
CommScope Holding Company, Inc.
Corning Incorporated
Amphenol Corporation
Panduit Corp.
- *Disclaimer: Major Players sorted in no particular order

Recent Industry Developments
- February 2025: Amphenol Corporation completed its USD 10.5 billion acquisition of CommScope's Connectivity and Cable Solutions business, creating the industry's largest pre-terminated systems provider with combined manufacturing capabilities spanning fiber optics, copper connectivity, and wireless infrastructure solutions.
- December 2024: Belden Inc. received USD 2.4 million in grants and tax credits from New York Governor Kathy Hochul to expand fiber production at its Syracuse facility, supporting broadband manufacturing initiatives aligned with the Bipartisan Infrastructure Law's USD 65 billion internet access allocation.
- November 2024: The Telecommunications Industry Association published ANSI/TIA-568.2-E and ANSI/TIA-568.5-1 standards, providing updated requirements for balanced twisted-pair and optical fiber cabling systems that directly impact pre-terminated system specifications and performance validation procedures.
- July 2024: Belden Inc. completed its acquisition of Precision Optical Technologies, enhancing optical transceiver capabilities and expanding pre-terminated fiber assembly offerings for enterprise solutions and broadband markets.


Global Pre-Terminated Systems Market Report Scope
| Fibre Pre-Terminated Systems |
| Copper (Category 6/6A/7) Pre-Terminated Systems |
| MPO/MTP |
| LC/SC Duplex |
| RJ-45 (GG45, ARJ45) |
| Other Connector Types |
| Hyperscale and Colocation Data Centers |
| Telecom Service Providers |
| Enterprise Campuses |
| Industrial Automation and OT Networks |
| Broadcast and Media Production |
| Structured Premises Cabling |
| Data-Center Interconnect / Spine-Leaf |
| Edge and Modular Data Centers |
| FTTH / FTTx Drop Cabling |
| 5G Fronthaul and Backhaul |
| North America | United States | |
| Canada | ||
| Mexico | ||
| Europe | Germany | |
| United Kingdom | ||
| France | ||
| Russia | ||
| Rest of Europe | ||
| Asia-Pacific | China | |
| Japan | ||
| India | ||
| South Korea | ||
| Australia | ||
| Rest of Asia-Pacific | ||
| Middle East and Africa | Middle East | Saudi Arabia |
| United Arab Emirates | ||
| Rest of Middle East | ||
| Africa | South Africa | |
| Egypt | ||
| Rest of Africa | ||
| South America | Brazil | |
| Argentina | ||
| Rest of South America | ||
| By Cable Type | Fibre Pre-Terminated Systems | ||
| Copper (Category 6/6A/7) Pre-Terminated Systems | |||
| By Connector Type | MPO/MTP | ||
| LC/SC Duplex | |||
| RJ-45 (GG45, ARJ45) | |||
| Other Connector Types | |||
| By End-User Industry | Hyperscale and Colocation Data Centers | ||
| Telecom Service Providers | |||
| Enterprise Campuses | |||
| Industrial Automation and OT Networks | |||
| Broadcast and Media Production | |||
| By Application | Structured Premises Cabling | ||
| Data-Center Interconnect / Spine-Leaf | |||
| Edge and Modular Data Centers | |||
| FTTH / FTTx Drop Cabling | |||
| 5G Fronthaul and Backhaul | |||
| By Geography | North America | United States | |
| Canada | |||
| Mexico | |||
| Europe | Germany | ||
| United Kingdom | |||
| France | |||
| Russia | |||
| Rest of Europe | |||
| Asia-Pacific | China | ||
| Japan | |||
| India | |||
| South Korea | |||
| Australia | |||
| Rest of Asia-Pacific | |||
| Middle East and Africa | Middle East | Saudi Arabia | |
| United Arab Emirates | |||
| Rest of Middle East | |||
| Africa | South Africa | ||
| Egypt | |||
| Rest of Africa | |||
| South America | Brazil | ||
| Argentina | |||
| Rest of South America | |||


Key Questions Answered in the Report
How big is the Pre-Terminated Systems market in 2025?
The Pre-Terminated Systems market size reached USD 3.58 billion in 2025 and is forecast to grow to USD 5.46 billion by 2030.
Which cable type leads demand?
Fiber pre-terminated systems captured 64% revenue in 2024 thanks to hyperscale data-center and 5G rollouts.
What is the fastest-growing connector format?
RJ-45 connectors show the highest growth at a 9.83% CAGR as enterprises upgrade to multi-gig copper networks.
Why are pre-terminated solutions preferred for AI clusters?
400 G / 800 G parallel optics require micrometer-level connector alignment that factory terminations provide, ensuring predictable latency.
Which region is growing the fastest?
South America leads with an 8.97% CAGR through 2030, driven by aggressive fiber-to-the-home and 5G investments.
What challenges could slow market expansion?
Higher upfront material costs and supply constraints for high-count MPO ferrules may temper short-term growth prospects.
Page last updated on:


