
Software As A Service Market Size and Share
Software As A Service Market Analysis by Mordor Intelligence
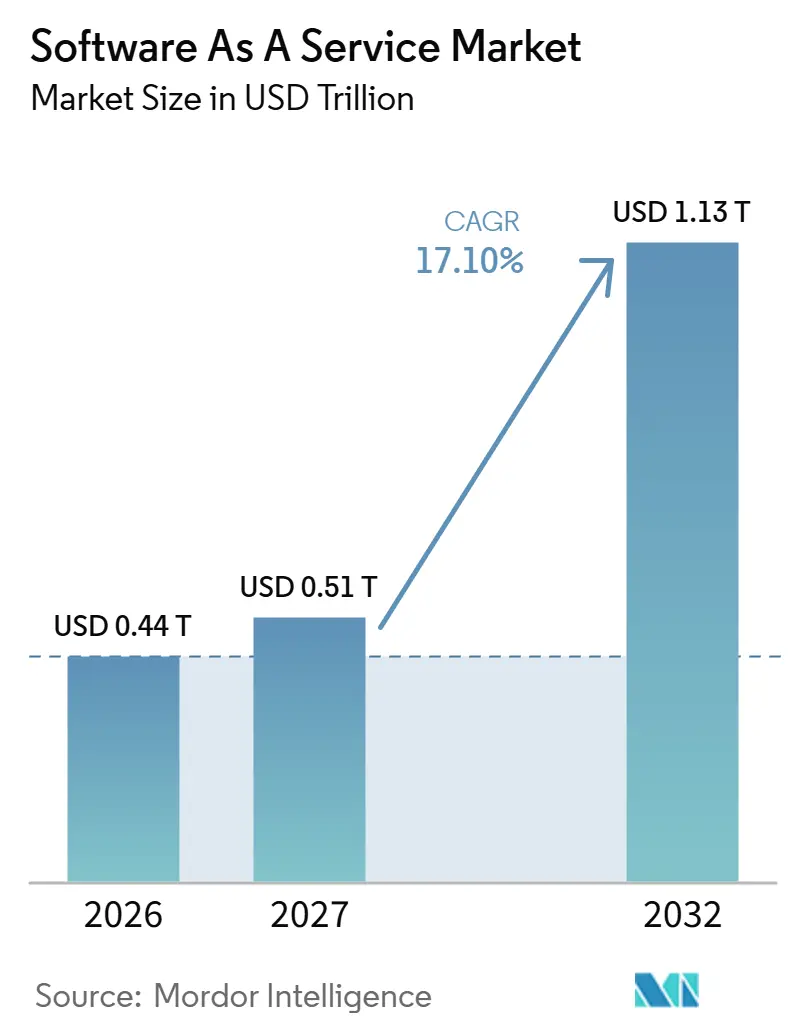
The software as a service market size was valued at USD 435.4 billion in 2026 and estimated to grow from USD 511.8 billion in 2027 to reach USD 1.13 trillion by 2032, at a CAGR of 17.1% during the forecast period (2027-2032).
Cloud-native platform design and paid AI functionality broaden the services that suppliers can monetize within existing business applications. Location-sensitive contract duties for covered financial customers in the European Union, including Germany, add coordination work when providers change delivery arrangements. Migration friction can constrain new-customer acquisition because buyers face potential data loss and lengthy switching procedures. Because migration friction can limit new-customer acquisition and location-notice duties add work when delivery arrangements change, selling paid functionality inside established accounts offers suppliers a growth route that avoids a new supplier switch.
Key Report Takeaways
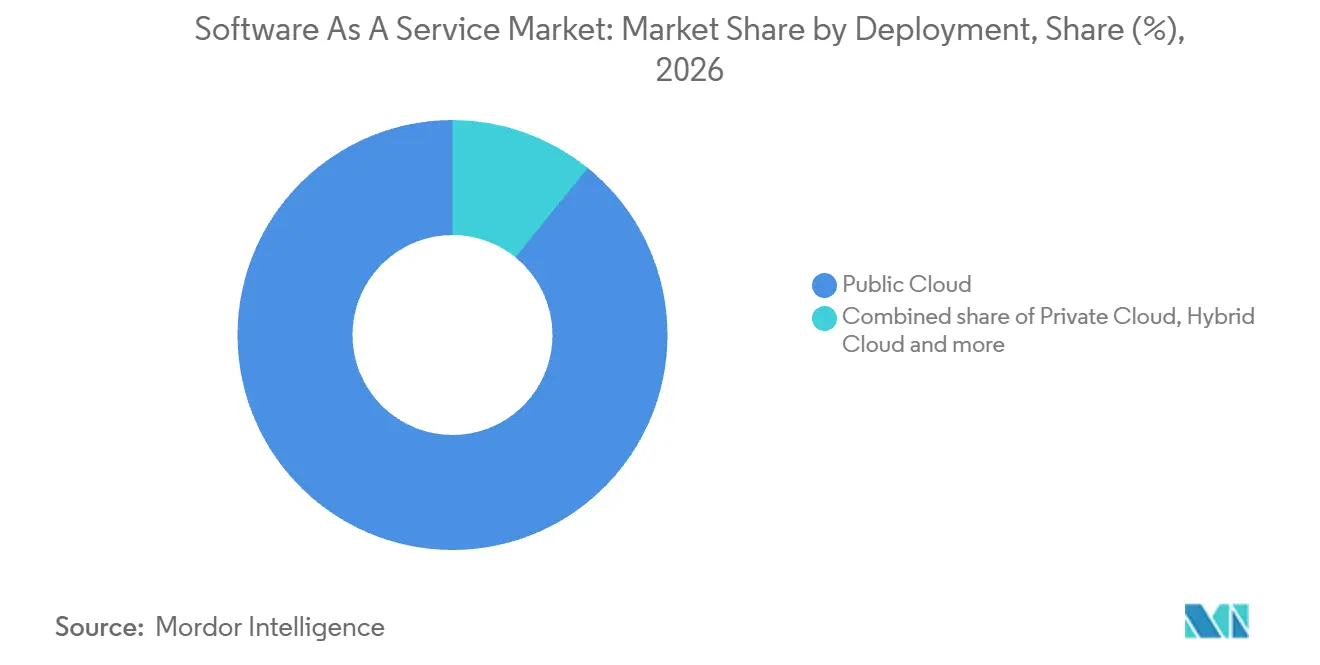
- By deployment, public cloud held an 89.17% software as a service market share in 2026, while hybrid cloud is forecast to be the fastest-growing segment with a 21.3% CAGR during 2027-2032.
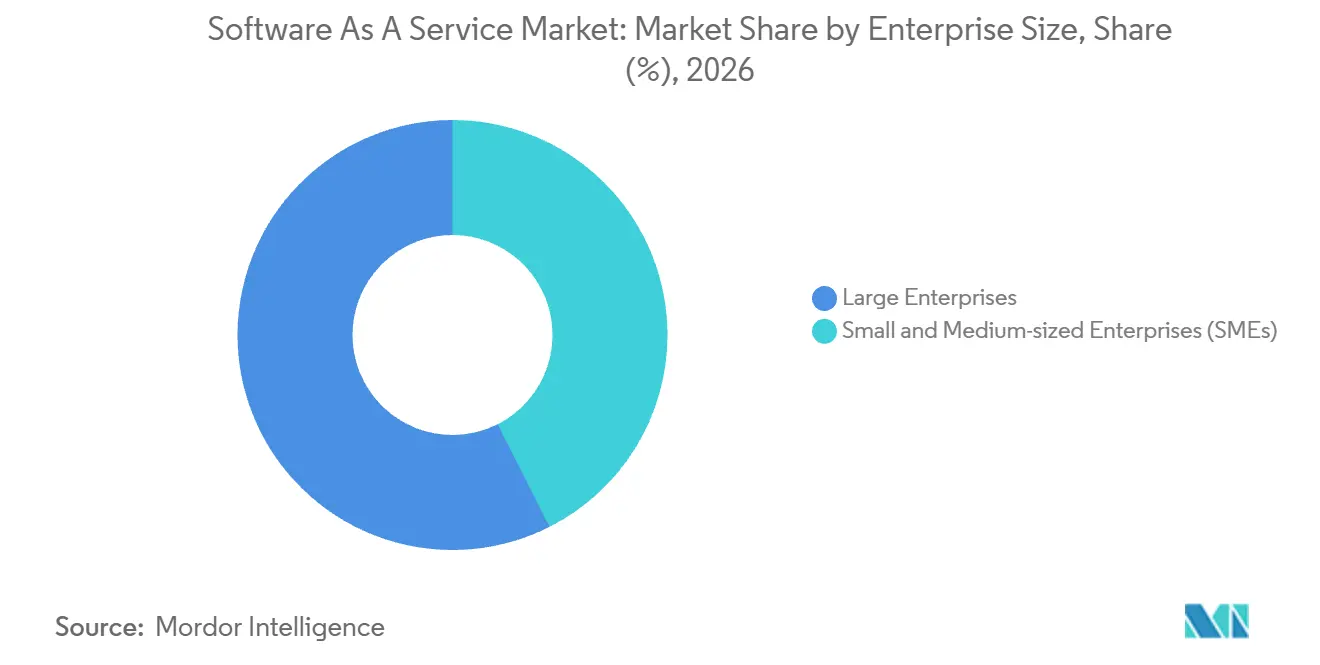
- Large enterprises led the enterprise-size category with a 57.46% share of the software as a service market size in 2026, and SMEs are projected to expand fastest at an 18.8% CAGR during 2027-2032.
- Among application types, the security and compliance segment is forecast to grow fastest at a 23.6% CAGR during 2027-2032, while CRM held the largest share of revenue at 24.16% in 2026.
- Subscription-based pricing led the pricing-model category with 67.14% of revenue in 2026, as usage-based/pay-as-you-go pricing is forecast to grow fastest at a 27.1% CAGR during 2027-2032.
- Across end-user verticals, IT and telecom led with 22.25% of revenue in 2026, and the healthcare and life sciences vertical is forecast to grow fastest at a 22.4% CAGR during 2027-2032.
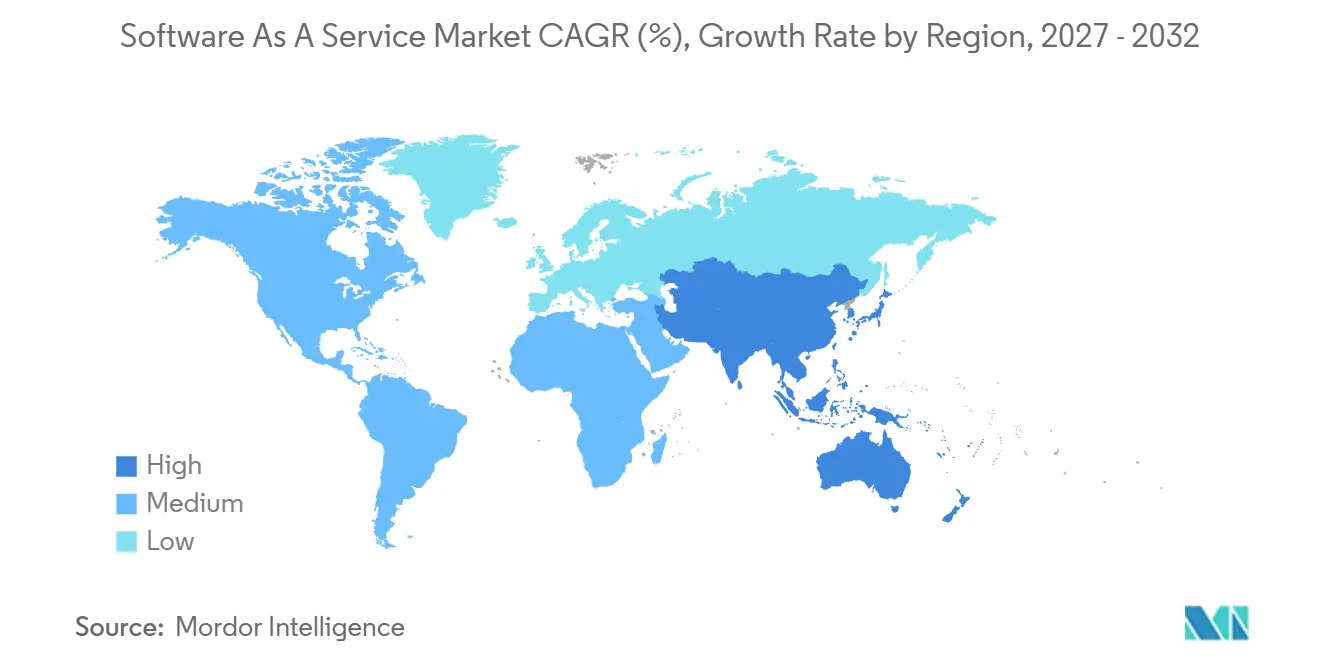
- Geographically, Asia-Pacific is forecast to grow fastest at an 18.4% CAGR during 2027-2032, whereas North America led with 42.48% of revenue in 2026.
Note: Market numbers in this report are based on Mordor Intelligence's proprietary estimation framework, which combines nine months of actuals with Q4 projections for base year 2026.
Market Trends and Insights
Drivers Impact Analysis of Software As A Service Market*
| Driver | (~) % Impact on CAGR Forecast | Geographic Relevance | Impact Timeline |
|---|---|---|---|
| Proliferation of cloud-native architectures | +5.5% | North America, Europe and Asia-Pacific | Medium term (2-4 years) |
| Rapid SME digitalization post-COVID | +4% | The European Union | Short term (≤ 2 years) |
| Lower upfront costs vs. on-prem licensing | +3.5% | The United Kingdom | Short term (≤ 2 years) |
| Generative-AI-enabled revenue extensions | +5% | The United Kingdom | Short term (≤ 2 years) |
| Edge-delivered ultra-low-latency SaaS | +1.5% | North America, Europe and Asia-Pacific | Medium term (2-4 years) |
| Carbon-accounting compliance demand | +1% | The United Kingdom | Medium term (2-4 years) |
| Source: Mordor Intelligence | |||
Proliferation of cloud-native architectures
Shared security enforcement can make a distributed SaaS platform easier to extend without rebuilding controls for every service. Salesforce said in November 2025 that its Hyperforce perimeter processed more than 20 trillion transactions annually across 17 countries and 25 regions. The company implemented a service mesh with sidecar proxies, placing security enforcement in the platform instead of individual services. Its design authenticated, authorized and encrypted every connection by default, with mutual TLS for each service-to-service call. In CNCF's surveys, end-user organizations reporting cloud-native techniques for much or nearly all development and deployment totaled 54% in 2023, 60% in 2024 and 59% in 2025. That installed architectural base creates an opening for additional SaaS applications supported by shared platform controls rather than separately secured services.
Rapid SME digitalization post-COVID
Smaller employers' digitalization is extending into paid cloud ERP, creating an application-specific opening for business-software suppliers. From 2023 to 2025, the share of EU enterprises with 10 to 49 people employed using ERP software as a paid cloud service rose from 9.82% to 13.36%. For EU enterprises with 50 to 249 people employed, the corresponding share rose from 19.37% to 26.14% over 2023-2025. The increase in both size classes shows adoption extending across different employer scales. The higher use rate among medium-sized employers supports a different commercial proposition from the lower-penetration small-employer cohort. The lower-use small-employer cohort leaves more room for first adoption, while medium-sized firms provide a more established cloud ERP customer base.
Lower upfront costs vs. on-prem licensing
For a small business that can afford a monthly application charge but not a large on-premises license payment, subscription entry pricing can turn a deferred purchase into a software order. The demand mechanism is the smaller initial commitment needed to begin using a defined application, leaving later subscription payments attached to continued access. An owner introducing a single business application can therefore evaluate its usefulness before committing spending across additional users or functions. For the supplier, that narrower entry scope creates a paid starting relationship that can expand through separately chosen subscriptions. The commercial gain is access to buyers excluded by the initial license payment, with expansion dependent on the application's demonstrated usefulness.
Generative-AI-enabled revenue extensions
Generative AI creates an additional paid software relationship when buyers add AI functionality to applications used for knowledge work. Microsoft reported more than 30 million paid Microsoft 365 Copilot seats in Q4 FY2026, with net seat additions more than doubling quarter over quarter.[1] Salesforce reported Agentforce annual recurring revenue above USD 1.5 billion, up over 240% year over year in Q2 FY2027. That measure includes Salesforce AI offerings, Slackbot and Headless 360. Paid AI extensions can therefore expand an application's commercial scope without requiring a customer to replace the core software, making additional functionality a source of demand alongside new application adoption.
Restraints Impact Analysis of Software As A Service Market*
| Restraint | (~) % Impact on CAGR Forecast | Geographic Relevance | Impact Timeline |
|---|---|---|---|
| Data-sovereignty and compliance barriers | -1.5% | The European Union | Medium term (2-4 years) |
| Vendor lock-in and switching costs | -1% | The European Union | Medium term (2-4 years) |
| FinOps scrutiny curbing SaaS sprawl | -0.5% | Countries across Europe | Short term (≤ 2 years) |
| Green-cloud mandates raising costs | -0.5% | Nationwide across Germany | Short term (≤ 2 years) |
| Source: Mordor Intelligence | |||
Data-sovereignty and compliance barriers
SaaS providers serving covered EU financial entities face contractual obligations concerning service and data-processing locations. From January 17, 2025, ICT-service contracts for covered EU financial entities must identify service and data-processing locations, including storage.[2] Those contracts must require the provider to give advance notice if it envisages changing the locations. The location provision covers the regions or countries where contracted or subcontracted functions and ICT services are provided. Coordinating delivery changes across these customer commitments can add compliance work whenever a provider reorganizes its service footprint. Subcontracting does not remove that customer-notification duty, leaving the application supplier with compliance work when the proposed location change originates upstream.
Vendor lock-in and switching costs
EU SaaS switching costs involve the ability to move data and applications as well as the price of departure. The European Commission identifies high charges, lengthy procedures and interoperability barriers when customers switch EU data-processing services, including SaaS. Interoperability problems can result in the loss of data and applications. Covered SaaS providers must offer open interfaces and, at a minimum, export data in a commonly used machine-readable format. The risk of losing information can nevertheless make a nominally cheaper replacement costly to adopt. Lengthy switching procedures compound the information risk, leaving EU customers exposed to migration delays even when a replacement subscription costs less.
*Our forecasts treat driver/restraint impacts as directional, not additive. The impact forecasts reflect baseline growth, mix effects, and variable interactions.
Software As A Service Market Segment Analysis
By Deployment:
Public Cloud Contracts and Hybrid EnvironmentsPublic cloud accounted for an 89.17% share of the software as a service market size in 2026, making it the largest segment. In Q1 2026, Tyler Technologies said almost all its new-client SaaS contracts were deployed in public cloud. That contracting pattern places deployment choices at the new-account stage, where a supplier can align its commercial offer with a repeatable delivery approach. Concentrating new contracts around this model can allow specialized public-cloud deployment expertise to support successive customers, creating an operating basis for further application adoption.
Hybrid cloud is the fastest-growing segment, with a projected 21.3% CAGR during 2027-2032. Parallels' 2026 survey found that 33% of IT-professional respondents reported organizational workloads on premises and in one cloud, its definition of hybrid cloud. Respondents covered the United States, the United Kingdom, Germany and other countries. That mixed workload environment gives SaaS suppliers an application opportunity inside organizations that retain local resources, with deployment choices relevant to how their offers fit existing operations. Coexistence gives suppliers access to cloud-software buyers who retain on-premises workloads, without making a complete workload migration a condition of adoption.

By Enterprise Size:
Large Accounts and SME Application AccessLarge enterprises represented a 57.46% software as a service market share in 2026, making them the largest segment. In August 2026, Workday said more than 65% of Fortune 500 companies used its enterprise platform for HR, finance and IT. Serving functions across these areas gives a platform provider several application entry points within one corporate customer, which can make the account more valuable than its place in a customer-count total.
Small and medium-sized enterprises (SMEs) form the fastest-growing segment, with a projected 18.8% CAGR during 2027-2032. In 2025, 52% of EU SMEs with 10 to 249 people employed bought cloud computing services, covering software, computing power and storage. These services give companies access to third-party computing resources in place of building or expanding their own IT infrastructure. In this cohort, the commercial opportunity can include adding applications to an existing paid-cloud relationship as well as serving smaller employers moving away from self-provisioned infrastructure.
By Application Type:
CRM Reach and Identity Security ExpansionCustomer relationship management (CRM) was the largest segment, with 24.16% of revenue in 2026. HubSpot reported 306,446 customers for its customer platform, including Smart CRM and multiple engagement hubs, as of June 30, 2026. This gives HubSpot more than one functional route into a customer relationship, while placing CRM within a broader customer-engagement offering. The buyer's choice between dedicated CRM and a broader customer platform turns partly on the value of consolidating several engagement functions in one relationship.
Security and compliance applications form the fastest-growing segment, with a projected 23.6% CAGR during 2027-2032. For fiscal Q2 2027, ended July 31, 2026, identity-security provider SailPoint reported USD 847 million in SaaS annual recurring revenue, up 36% year over year.[3] That measure annualizes the value of SaaS contracts at the measurement date. Its SaaS customer count grew 16% year over year, and annual recurring revenue per SaaS customer rose 17% to more than USD 400,000 in the same quarter. Identity-security expansion in this example combined broader customer coverage with higher annualized contract value per account, extending the supplier's commercial base in 2 dimensions.
By Pricing Model:
Recurring Contracts and Flexible ConsumptionSubscription-based pricing was the largest segment, accounting for 67.14% of revenue in 2026. Salesforce reported USD 39.4 billion in subscription-and-support revenue in fiscal 2026, approximately 95% of total revenue and up 10% year over year. The measure includes cloud-service subscription fees, term software licenses and support, with term licenses representing approximately 6% of the category. Growth primarily came from new customers, upgrades and additional subscriptions from existing customers, while pricing was not a significant driver. This illustrates a recurring-revenue model in which account acquisition and expanded application commitments can contribute to growth alongside the original subscription relationship.
Usage-based / pay-as-you-go pricing is the fastest-growing segment, with a projected 27.1% CAGR during 2027-2032. In 2025, Datadog's observability and security SaaS platform offered committed-usage subscriptions delivered as used and monthly subscriptions based on usage. Most of its revenue came from annual subscriptions, and usage-linked arrangements were one of the available commercial structures. The example separates the term of a customer relationship from the activity used to determine the charge. The forecast's faster growth starts from a smaller market base than subscription-based pricing, with Datadog illustrating how usage-linked charges can expand within an ongoing subscription relationship.
By End-User Vertical:
Cloud Applications and Hosted Clinical SystemsIT and telecom was the largest end-user segment, with 22.25% of revenue in 2026. In 2025, 44.59% of EU information and communication enterprises with at least 10 people employed used CRM software as a paid cloud service. Among the same population, 33.06% used ERP software applications as a paid cloud service in 2025. Selling to these enterprises means addressing internal customer-management and planning functions, giving application vendors distinct entry points within an industry that also supplies technology.
The fastest-growing segment is healthcare and life sciences, with a projected 22.4% CAGR during 2027-2032. Hollywood Presbyterian Medical Center switched to Altera Digital Health's cloud-native SaaS electronic health record, Paragon Denali, in August 2026. On April 28, 2025, Contra Costa County's Board of Supervisors authorized execution of a contract with Epic Hosting, LLC, for hosted electronic health records software, maintenance and support for Contra Costa Health. The authorized service period runs from April 1, 2025, through March 31, 2029. These examples place continuing support alongside hosted clinical functionality, creating a service role that extends beyond the software switch.
Geography Analysis
North America Software As A Service Market
North America held a 42.48% share of the software as a service market size in 2026. Public Services and Procurement Canada awarded Cornerstone on Demand a Saba Cloud SaaS contract for the Department of National Defence's Defence Learning Network. Delivery was specified for the National Capital Region over 24 months, from July 27, 2025, to July 26, 2027. The purchase shows how a defense department can buy SaaS for a specialized learning function, creating a supplier opportunity at the program level.
Asia-Pacific Software As A Service Market
Asia-Pacific is the fastest-growing region, with a projected 18.4% CAGR during 2027-2032. In Australia, cloud-accounting software supplier Xero reported 20% operating-revenue growth in FY26, which ended March 31, 2026, driven by a growing customer base, greater invoice-payment activity and price changes. Constant-currency growth was 19%, while a weaker NZD against AUD had a small favorable effect on the reported result. Xero's operating mix included recurring monthly software fees and related-services revenue, so customer growth and payment activity offer separate ways to expand an accounting relationship.
In Brazil, SaaS was the most used revenue model among startups mapped by Sebrae, a private nonprofit supporting small businesses, at 39.1% in data collected through December 2025. In Europe, EU enterprises with at least 10 people employed in surveyed activities used paid cloud ERP at 30.1% and CRM at 27.9% in 2025, establishing a buyer base for application suppliers. In the Middle East, Cerillion announced an Omantel business and operations support transformation in April 2026, with delivery planned through Cerillion Cloud hosted in Oman Data Park. In Africa, South Africa's National Development Agency awarded Just Dynamics Software Solutions 36 months of maintenance, support and integration optimization for its Microsoft Dynamics 365 Business Central SaaS environment in December 2025. Oman's planned hosted deployment and South Africa's support award around an existing SaaS environment favor different local delivery capabilities.
Mordor Intelligence provides coverage of the software as a service market across other key regional markets. Detailed country-level analysis extends to Denmark incorporating local coverage and market participation, as required.
Regulatory Framework and Outlook
The comparison covers selected jurisdictions from the perspective of an enterprise SaaS processor handling customer personal data and cross-border delivery. Contractual security, transfer mechanisms and responsibility for customer information determine the commercial work attached to an application relationship. The relevant differences include customer-contract duties, conditional export channels and additional approval steps for covered data flows.
Regulatory Table of Software As A Service Market
| Decision factor | United States | Brazil | Germany | China | Saudi Arabia | South Africa |
|---|---|---|---|---|---|---|
| Primary authority | Federal Trade Commission (FTC) | ANPD | State-level data protection authorities | Cyberspace Administration of China (CAC) | Saudi Data & AI Authority (SDAIA) | Information Regulator |
| Key instruments or direction | FTC Safeguards Rule, 16 CFR Part 314 | LGPD; Resolution 19/2024; 2026 EU adequacy recognition | GDPR processor contracts; pending EU digital omnibus | 2024 cross-border provisions; 2026 export-certification measures | Personal Data Protection Law; implementing and transfer regulations | POPIA Sections 21 and 72 |
| Commercial effect | FTC-jurisdiction financial clients must contract for provider safeguards and perform risk-based oversight | Controllers verify international-transfer basis and mechanism; processors supply necessary information | Controllers specify processor duties in binding contracts | Covered data exports follow applicable assessment, standard-contract or certification channels, subject to exemptions | Controllers must meet security, minimization and privacy conditions for foreign personal-data transfers | Responsible parties use written contracts for operator security; operators notify them immediately on reasonable grounds to believe unauthorized personal-data access or acquisition occurred |
| Current policy attractiveness | Medium | Medium | Medium | Low | Medium | Medium |
| Future direction of policy attractiveness | No change | Easing | Easing | No change | No change | Hardening |
| Source: Mordor Intelligence | ||||||
Risk-based provider oversight in the United States, volume-dependent export channels in China and conditional central-processing transfers in Saudi Arabia support continuity in their respective frameworks. The European Commission's pending digital omnibus proposal, which would simplify EU digital rules that apply in Germany, and ANPD's 2026 recognition of the European Union as adequate for covered transfers from Brazil support easing, with existing processor-contract and other LGPD responsibilities continuing. South Africa's written operator-security contracts and immediate-notification duties underpin its current rating. South Africa's Information Regulator described proposals under consideration in August 2026 that would replace the enforcement-notice grace period with immediate fines, and it plans to submit proposed POPIA amendments to the Minister for consideration in the fourth quarter of its 2026/27 performance year.
Value Chain Stages
The comparison follows cloud capacity, application provision and customer implementation to show where suppliers earn revenue across a SaaS service relationship. Salesforce identifies hyperscaler capacity and leased colocation space among its upstream dependencies. Hosting supply and application expertise sit in separate commercial relationships, which leaves subscription revenue as one component of the chain's earnings. Implementation and continued optimization create another services role around customer deployment, illustrated by Accenture's Salesforce work.
Value Chain Analysis Table of Software As A Service Market
| Primary activity | Key participants | Value capture | Bottleneck | Resilience response |
|---|---|---|---|---|
| Cloud capacity provision | Cloud-service providers such as Microsoft | Cloud-service revenue | Reliance on allocated hosting capacity | Qualify alternative capacity sources |
| Application provision | Cloud-application providers such as Microsoft, Salesforce | Subscriptions and application-support revenue | Sustaining application engineering capability | Document application operations and broaden trained team coverage |
| Implementation and optimization | Implementation partners such as Accenture | Consulting and implementation-service revenue | Project-specific implementation workload | Standardize repeatable project tasks and retain post-launch optimization capability |
| Source: Mordor Intelligence | ||||
The application relationship and the implementation relationship can place earnings with different firms. Implementation and optimization services give integrators such as Accenture a fee-earning role distinct from Salesforce's subscription-and-support revenue. Partner-led expansion separates the opportunity to serve more accounts from the opportunity to retain each account's implementation spending.
Competitive Landscape
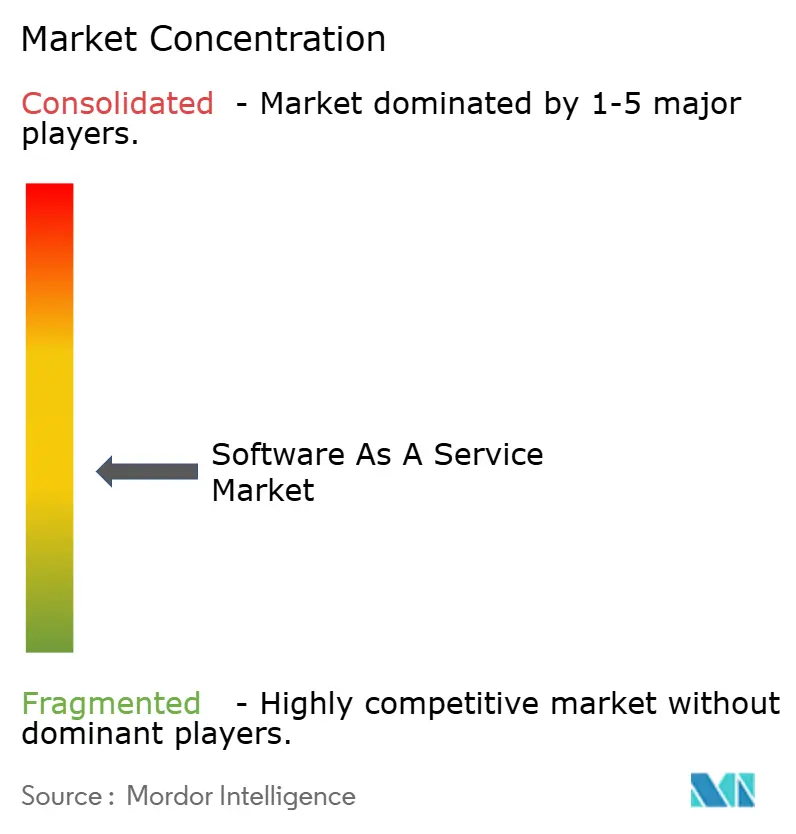
The competitive field combines several large application portfolios with resale channels, leaving room for specialists alongside Microsoft, Salesforce, Oracle, SAP and IBM. Microsoft's Dynamics 365 revenue grew 18% in fiscal 2026, or 15% in constant currency, across a portfolio including ERP, CRM, Power Apps and Power Automate. In 2025, Salesforce led worldwide CRM vendors with a 20% share of IDC's CRM market, covering sales, marketing, customer service, contact center, advertising and digital commerce applications. In June 2025, IBM identified Rocket Software as a reseller using its watsonx SaaS solutions for generative AI productivity. Microsoft's growth across a multi-application portfolio and Salesforce's CRM leadership show suite scale, while IBM's June 2025 reseller example illustrates a separate route for offering watsonx SaaS.
Operational control gives application suppliers a second way to compete for customers whose requirements extend beyond software functionality. Oracle reported Q1 FY2027 Cloud Apps (SaaS) revenue of USD 4.2 billion, up 10% year over year. In February 2025, Oracle made Fusion Cloud Applications Suite available on EU Sovereign Cloud in all 27 EU member states, covering finance, HR, supply chain, manufacturing and customer-experience data. The platform was located in the EU, with ownership, operation and management through EU-incorporated legal entities and management by EU-based personnel. The EU operating structure gives sovereignty-sensitive buyers an additional basis for choosing Oracle's applications.
Cloud ERP expansion gives established application suppliers another basis for competing for enterprise relationships and the business functions attached to them. SAP reported Cloud ERP Suite revenue growth of 25% in Q2 2026, or 27% at constant currencies. A specialist approaching a customer of such a suite must choose between replacing the broader platform and serving a bounded application need. SAP's reported expansion strengthens the case for a narrowly defined application offering that complements an ERP suite rather than requiring its wholesale replacement.
Software As A Service Industry Leaders
-
Microsoft
-
Salesforce
-
Oracle
-
SAP
-
IBM
- *Disclaimer: Major Players sorted in no particular order
Software As A Service Market Companies Covered in this Report
- Microsoft
- Salesforce
- Oracle
- SAP
- IBM
- ServiceNow
- Atlassian
- Intuit
- Adobe
- Google (Alphabet)
- Workday
- Zoom Communications
- Dropbox
- HubSpot
- Shopify
- Zendesk
- Snowflake
- Alteryx
- ServiceTitan
- BambooHR
Key Opportunities for Market Participants
The comparison identifies near-term SaaS sales routes for qualified UK public-sector suppliers and a later entry route for prospective participants. G-Cloud 15 launched in August 2026 and includes Lot 2b for applications hosted in the cloud. Eligible buyer categories include central government, local authorities, health and education. The commercial openings differ by application scope and by whether the supplier already has framework access.
Market Opportunities Table of Software As A Service Market
| Opportunity | Why now | Buyer / lead segment | Recommended play | Main barrier | Likely beneficiaries |
|---|---|---|---|---|---|
| Public-sector CRM subscriptions | Dedicated SaaS buying route under G-Cloud 15 | Eligible central and local government bodies | Develop scoped CRM proposals within existing framework offerings | Differentiation beyond basic framework eligibility | CRM suppliers already qualified for relevant framework services |
| Institutional staff-administration SaaS | Health and education buyers can use the SaaS lot | Eligible health and education organizations | Package HCM subscriptions around a defined institutional staff-management function | Demonstrating technical fit and a credible service scope | HCM suppliers with relevant framework access |
| Entry preparation for new SaaS suppliers | Scheduled reopening 18 and 36 months after August 6, 2026 | Prospective suppliers serving eligible public-sector buyers | Prepare documented SaaS capabilities and price propositions for the scheduled windows | Supplier applications are closed | Prospective SaaS framework participants |
| Source: Mordor Intelligence | |||||
Framework access draws the commercial boundary between suppliers pursuing buyer requirements and those preparing for later entry. The 2026 supplier assessment covered quality, technical capability and price. For new entrants, preparation for the first scheduled reopening, 18 months after the August 2026 start, takes priority over an immediate application while supplier entry is closed.
Recent Industry Developments in Software As A Service Market
- Oct 2026: Microsoft 365 G7 became available to eligible Government Community Cloud customers in the United States on October 1, with additional purchasing options scheduled for November 1.
- Aug 2026: The UK Government Commercial Agency launched G-Cloud 15, a 4-year public-sector cloud procurement framework valued at approximately GBP 14 billion (USD 18.8 billion), with Lot 2b for cloud-hosted SaaS applications.
- Apr 2026: Cerillion announced a business and operations support software transformation for Oman telecom operator Omantel, with planned SaaS delivery through Cerillion Cloud hosted in Oman Data Park.
Software As A Service Market Report Scope and Research Methodology
Market Definition and Coverage
The Software as a service market measures annual spending on commercial application software delivered as a service through public, private or hybrid cloud environments worldwide. It counts fees for access to and use of the software, including subscription and usage-based charges.
Scope exclusions: Platform-as-a-service, infrastructure-as-a-service, on-premise perpetual licenses, and separate implementation consulting fees are excluded.
Segments Covered in This Report
- By Deployment
- Public Cloud
- Private Cloud
- Hybrid Cloud
- By Enterprise Size
- Small and Medium-sized Enterprises (SMEs)
- Large Enterprises
- By Application Type
- Customer Relationship Management (CRM)
- Enterprise Resource Planning (ERP)
- Human Capital Management (HCM/HRM)
- Collaboration and Productivity
- Business Intelligence and Analytics
- Security and Compliance
- Other Applications
- By Pricing Model
- Subscription-Based
- Usage-Based / Pay-As-You-Go
- Freemium and Tiered
- By End-User Vertical
- IT and Telecom
- Banking, Financial Services and Insurance (BFSI)
- Retail and E-Commerce
- Healthcare and Life Sciences
- Manufacturing
- Other Verticals
- By Geography
- North America
- United States
- Canada
- Mexico
- South America
- Brazil
- Argentina
- Colombia
- Rest of South America
- Europe
- United Kingdom
- Germany
- France
- Italy
- Spain
- Rest of Europe
- Asia-Pacific
- China
- Japan
- India
- South Korea
- Australia and New Zealand
- Rest of Asia-Pacific
- Middle East
- Israel
- Saudi Arabia
- United Arab Emirates
- Turkey
- Rest of Middle East
- Africa
- South Africa
- Egypt
- Nigeria
- Rest of Africa
- North America
Data Sources, Market Sizing, and Validation
Desk Research
Official sources such as Eurostat's 2025 paid-cloud release, its enterprise ICT metadata, its E-business integration tables and the 2025 compilers' manual provide application-level use indicators, the survey population and comparability rules, application and firm-size patterns, and the distinction between cloud application use and infrastructure services. Together, these official sources supply the adoption and application-mix signals that feed the share variables in the sizing model.
Company filings and investor material, such as Microsoft's 2025 Annual Report, help separate subscription revenue from broader cloud categories, while reputable press and company disclosures can cross-check product, pricing and reporting changes. These named sources are not exhaustive, and further sources inform collection, validation and clarification.
Primary Interviews and Surveys
Structured interviews and surveys would seek perspectives from SaaS provider executives, product and finance leaders, enterprise procurement and IT buyers, and channel or implementation specialists across APAC, EMEA and the Americas. They would test secondary estimates of paying-account adoption, application mix, customer size, pricing, deployment and regional distribution, and probe differences between billed application access and separately charged infrastructure or implementation. Where public reporting leaves a gap, respondent explanations would guide focused follow-up and be triangulated with filings, official enterprise adoption statistics and independent provider roll-ups before assumptions enter the forecast.
Distribution of primary research fieldwork respondents
| Company type | Respondent position | Region |
|---|---|---|
| Top tier: 35% | CXOs: 15% | APAC: 40% |
| Mid tier: 50% | Functional/Unit leaders: 40% | EMEA: 35% |
| Smaller Players: 15% | Managers: 45% | Americas: 25% |
Market-Sizing & Forecasting
Using 2026 as the base and reporting global annual SaaS spending in USD, the model first estimates the total top down from revenue attributable to cloud-delivered commercial applications, separating billed subscription and usage charges from uncounted infrastructure and separately purchased implementation. Scenario analysis forecasts 2027-2032 by varying enterprise software spending, paid cloud application adoption by function and company size, monetization through seats, usage and realized fees, and the public, private and hybrid delivery mix. Application, customer-size, pricing, vertical and regional shares draw on official paid-cloud adoption surveys, provider disclosures and customer-use patterns, then are checked for consistency with the global total and with related share sets. Selective supplier roll-ups and sampled annual fees multiplied by paying seats or accounts and observed usage provide bottom-up checks. Where disclosures mix application SaaS with platform revenue, attributable SaaS is isolated where possible and remaining uncertainty is tested through bounded scenarios, while primary respondents check variable-level forecasts and challenge material gaps.
Data Validation & Update Cycle
Analysts triangulate provider revenue disclosures, official enterprise-adoption measures, pricing and usage indicators, and regional demand signals, then investigate anomalies and material variance from prior periods before sign-off through source review, model review and senior analyst review. A source is re-contacted when definitions, timing or attribution remain unclear. The evidence is refreshed annually, revisited between cycles after material market or regulatory events, and given a fresh pre-delivery review.
Mordor Intelligence's Software As A Service Market Size Versus Other Published Estimates
Published estimates can differ in the transactions and products they count and the inputs used to model demand. The Software as a service market measures annual spending on commercial application software delivered as a service through public, private or hybrid cloud environments worldwide.
Key Gap Drivers include the study's defined coverage and market-specific modeling choices. Where disclosures mix application SaaS with platform revenue, attributable SaaS is isolated where possible and remaining uncertainty is tested through bounded scenarios, while primary respondents check variable-level forecasts and challenge material gaps.
Benchmark comparison
| Source | Market Size | Gaps in Research Methodology |
|---|---|---|
| Mordor Intelligence | USD 511.8 B (2027) | |
| Global Consultancy A | USD 408 B (2025) | At its 2025 base, this estimate is 20.3% below this report's 2027 value of USD 511.8 B, 2 years later. The 2025 base year predates the report's 2027 current year by two years, so the estimate reflects an earlier revenue pool. |
| Global Consultancy B | USD 370.28 B (2025) | At its 2025 base, this estimate is 27.7% below this report's 2027 value of USD 511.8 B, 2 years later. The estimate centers on business-critical enterprise applications and uses a 2025 base year, both of which can contribute to a lower value than the broader commercial application pool measured for 2027. |
Mordor Intelligence's analysts triangulate provider revenue disclosures, official enterprise-adoption measures, pricing and usage indicators, and regional demand signals, then investigate anomalies and material variance from prior periods before sign-off through source review, model review and senior analyst review.
Key Questions Answered in the Report
What is the software as a service market size and expected growth?
It is estimated at USD 511.8 billion in 2027 and forecast to reach USD 1.13 trillion by 2032, at a 17.1% CAGR during 2027-2032.
Which forces support SaaS demand?
Paid AI extensions and SME cloud ERP use broaden application demand. Microsoft reported more than 30 million paid Microsoft 365 Copilot seats in Q4 FY2026.
Which SaaS deployment model leads revenue, and which is forecast to grow fastest?
Public cloud accounted for 89.17% of revenue in 2026. Hybrid cloud is forecast to grow fastest at a 21.3% CAGR during 2027-2032.
Which companies are major SaaS providers?
Microsoft, Salesforce, Oracle, SAP and IBM are major providers.
How can compliance affect SaaS delivery to financial institutions?
From January 17, 2025, covered EU financial entities' ICT-service contracts must identify service and data-processing locations and require providers to give advance notice of proposed location changes. These requirements can add coordination when delivery locations change.
Which regions lead SaaS revenue and forecast growth?
North America led with 42.48% of revenue in 2026. Asia-Pacific is forecast to grow fastest at an 18.4% CAGR during 2027-2032.