Policy And Audit Management Tools Market Size and Share
Market Overview
| Study Period | 2019 - 2030 |
|---|---|
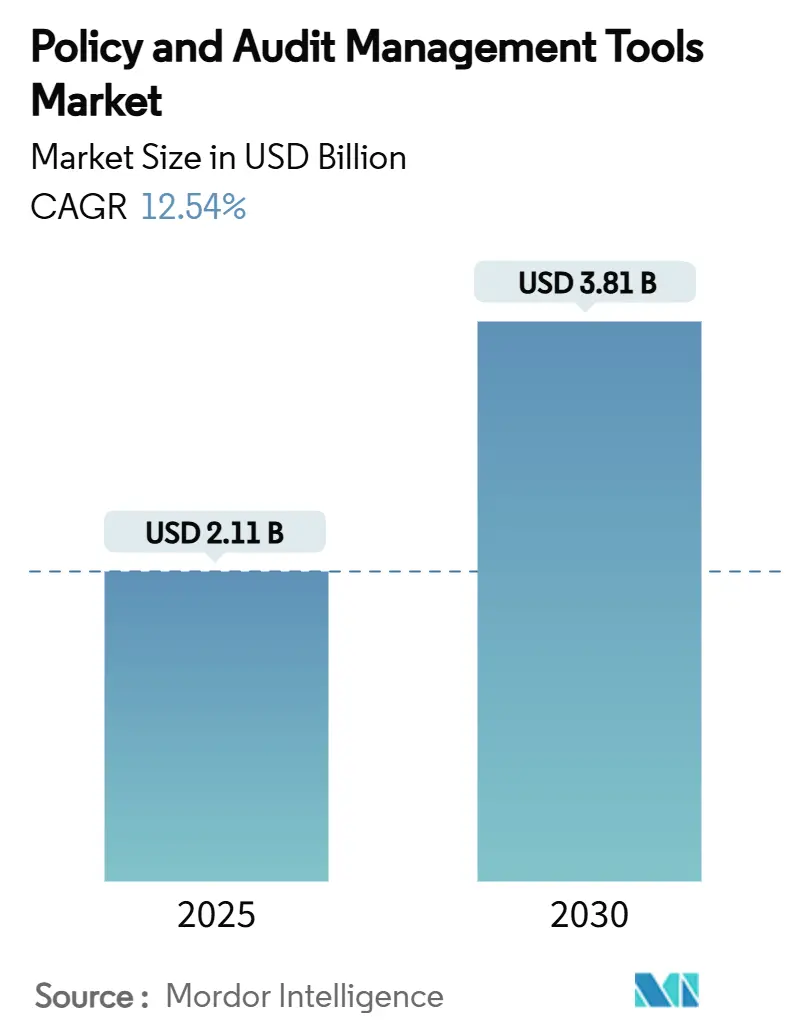
| Market Size (2025) | USD 2.11 Billion |
| Market Size (2030) | USD 3.81 Billion |
| Growth Rate (2025 - 2030) | 12.54% CAGR |
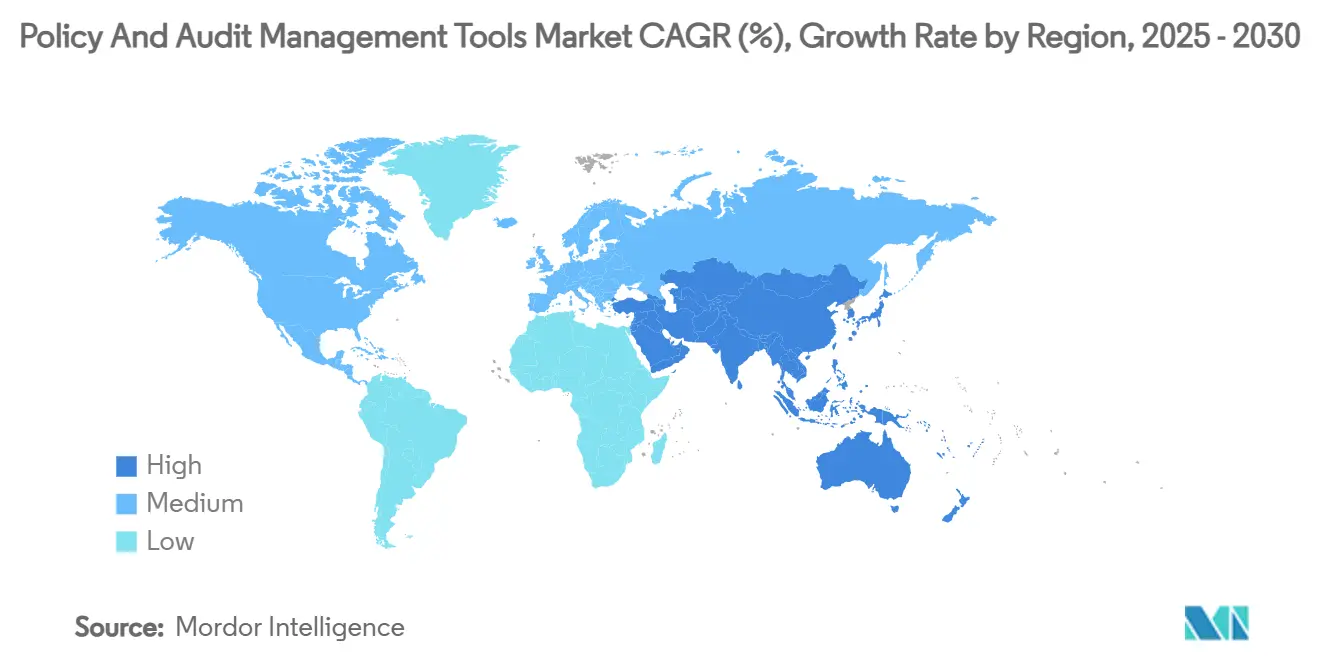
| Fastest Growing Market | Asia Pacific |
| Largest Market | North America |
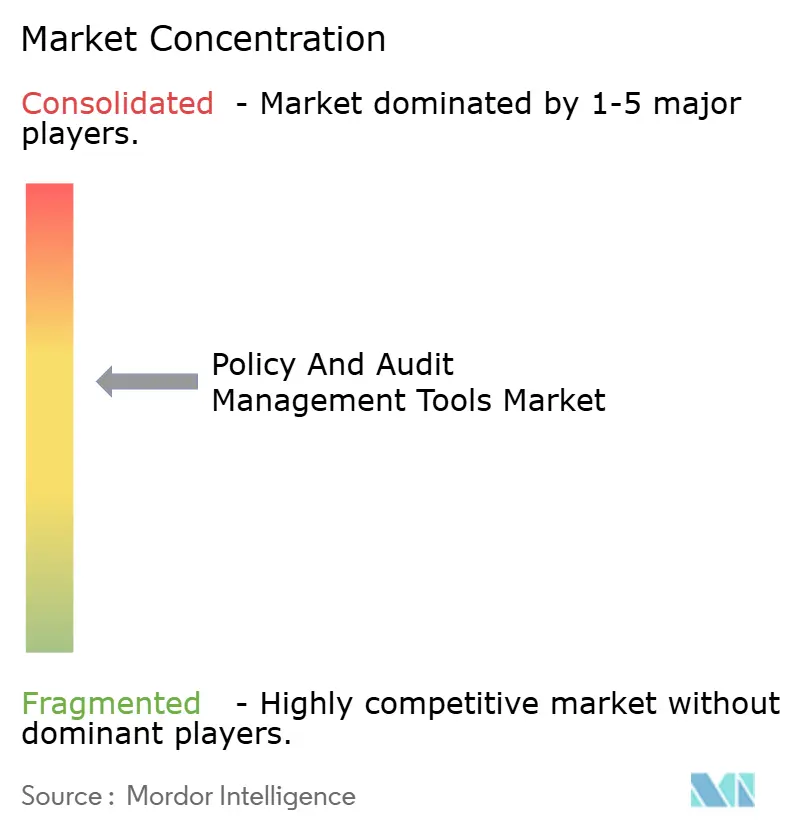
| Market Concentration | Medium |
Major Players *Disclaimer: Major Players sorted in no particular order Image © Mordor Intelligence. Reuse requires attribution under CC BY 4.0. | |
Policy And Audit Management Tools Market Analysis by Mordor Intelligence
The Policy and Audit Management Tools market size stands at USD 2.11 billion in 2025 and is forecast to advance to USD 3.81 billion by 2030 at a 12.54% CAGR. Robust expansion reflects enterprises’ shift from reactive remediation toward enterprise-wide, technology-enabled governance that keeps pace with fast-changing regulations. Intensifying scrutiny around ESG disclosures, cyber-risk resilience and cross-border data transparency continues to amplify demand for integrated suites that combine policy authoring, real-time monitoring and automated audit readiness. Accelerating cloud adoption, expanding AI use cases and an enlarging ecosystem of insurtech and regtech partners further widen the addressable Policy and Audit Management Tools market, especially among first-time buyers in highly regulated verticals. At the same time, the growth trajectory benefits from insurers’ stricter underwriting standards that now require proof of controls before issuing cover, removing a long-standing adoption barrier for compliance software. Competitive differentiation therefore pivots on rapid configuration, API openness and embedded analytics that turn compliance evidence into actionable business resilience metrics.
Key Report Takeaways
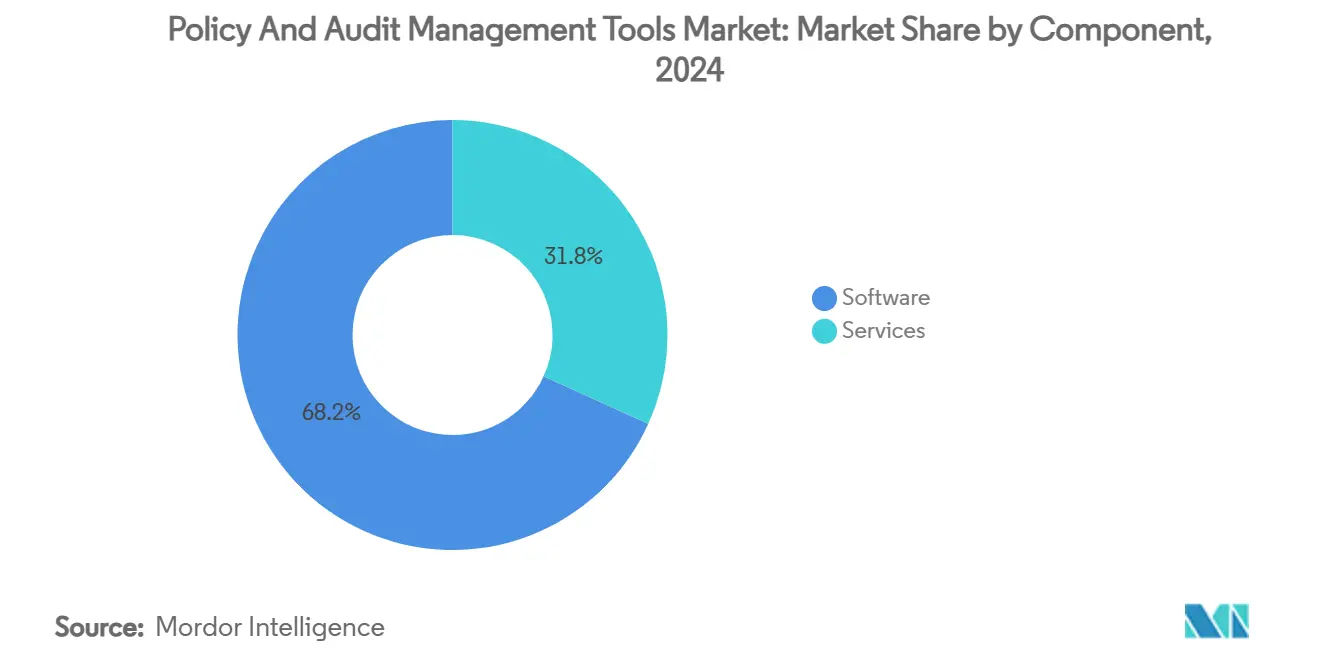
- By component, software commanded 68.23% of Policy and Audit Management Tools market share in 2024, while services is projected to record the highest CAGR at 12.59% to 2030.
- By deployment mode, cloud-based platforms led with 57.34% share of the Policy and Audit Management Tools market size in 2024 and are set to rise at a 12.67% CAGR through 2030.
- By organization size, large enterprises held 62.81% share of the Policy and Audit Management Tools market size in 2024; SMEs are forecast to post the fastest 12.93% CAGR to 2030.
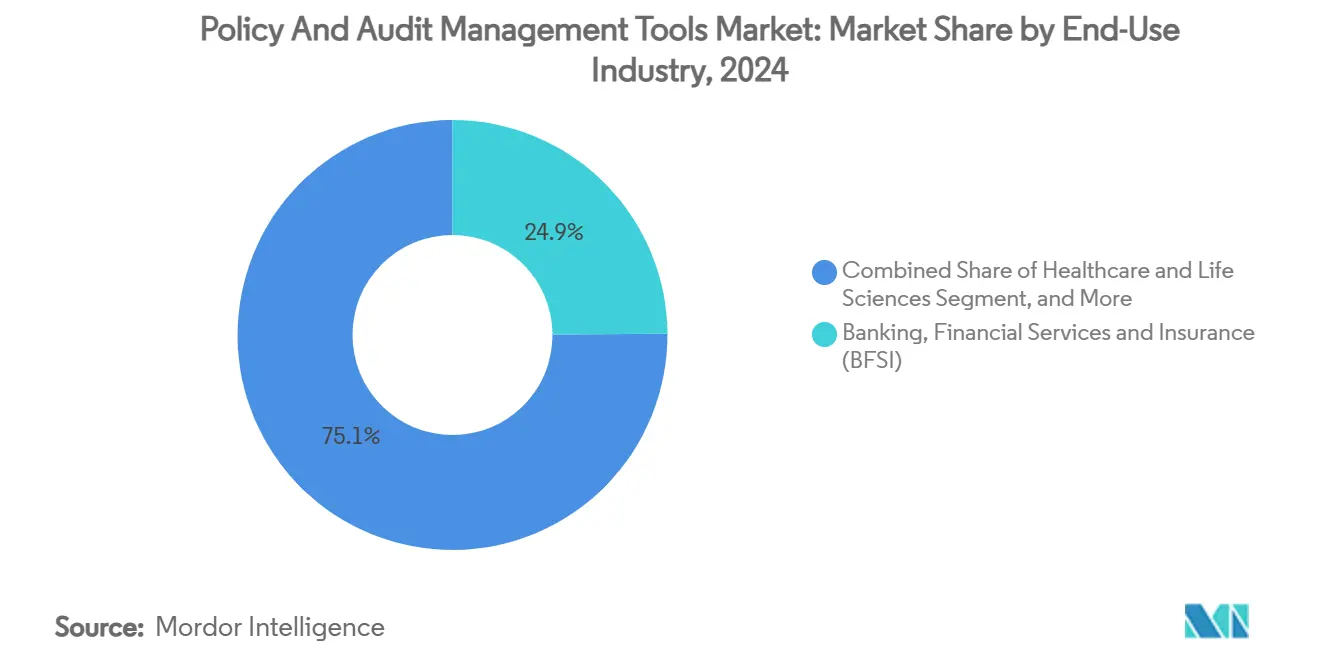
- By end-use industry, BFSI captured 24.91% of Policy and Audit Management Tools market share in 2024, whereas retail and e-commerce is poised for a 12.84% CAGR to 2030.
- By application, compliance management accounted for 27.48% of Policy and Audit Management Tools market size in 2024, with incident and issue management accelerating at a 12.79% CAGR to 2030.
- By geography, North America retained 38.78% of Policy and Audit Management Tools market share in 2024, while Asia-Pacific is expanding at a 12.99% CAGR through 2030.
Global Policy And Audit Management Tools Market Trends and Insights
Driver*
| Driver | (~) % Impact on CAGR Forecast | Geographic Relevance | Impact Timeline |
|---|---|---|---|
| Accelerating global regulatory complexity | +2.8% | EU and Asia-Pacific lead | Medium term (2-4 years) |
| Rising board-level accountability for ESG compliance | +2.1% | North America and Europe | Long term (≥4 years) |
| Surge in cyber-risk audits after high-profile breaches | +1.9% | BFSI and Healthcare worldwide | Short term (≤2 years) |
| Expansion of cloud-native GRC ecosystems | +1.7% | North America and Europe | Medium term (2-4 years) |
| AI-driven continuous monitoring lowering audit costs | +1.4% | North America and Europe | Long term (≥4 years) |
| Insurance underwriters mandating proof of policy controls | +1.2% | Developed markets worldwide | Short term (≤2 years) |
| Source: Mordor Intelligence | |||
Accelerating Global Regulatory Complexity
The European Securities and Markets Authority now coordinates sustainability reporting enforcement across the European Economic Area, compelling corporates to align disclosures with evolving European Sustainability Reporting Standards while mapping them to IFRS Sustainability frameworks. [1]ENISA, “NIS Investments 2024,” europa.eu Multinationals face overlapping anti-corruption, data-residency and tax-reporting mandates that vary by jurisdiction, driving a pronounced need for single source-of-truth repositories that continuously reconcile global obligations. The Corporate Sustainability Reporting Directive’s extraterritorial reach extends requirements to non-EU sellers into Europe, converting regional rules into de-facto global ones. Policy and Audit Management Tools market buyers therefore prioritize modules that automate horizon scanning, cross-map regulations and trigger workflow updates without developer intervention. Vendors with multilingual libraries and real-time regulatory intelligence APIs gain a decisive edge as compliance teams seek to retire manual trackers that cannot scale.
Rising Board-Level Accountability for ESG Compliance
Mandatory ESG disclosures now impose personal liability on directors, materially shifting risk appetites at the top tier of governance. [2]Athennian, “2025 Compliance Roadmap,” athennian.com Boards increasingly demand immutable audit trails and dashboard-grade visibility into carbon metrics, diversity goals and supplier due-diligence to shield themselves from fines and reputational fallout. Platforms that integrate structured data ingestion, narrative generation and e-signature workflows allow executives to certify filings with confidence, compressing reporting cycles in the Policy and Audit Management Tools market from quarters to weeks. Workiva’s deployment of generative AI for ESG narrative drafting illustrates how automation now intersects with legal exposure, pushing budget allocation for next-gen compliance from operational line items into board-sponsored strategic initiatives.
Surge in Cyber-Risk Audits After High-Profile Breaches
Post-incident regulators have tightened audit cadences, prompting companies to earmark 9% of IT budgets for information security and to add headcount well ahead of the EU NIS 2 compliance deadline. Sector-specific spending spikes—161% growth in healthcare identity access tools and 10-12% cybersecurity allocation by financial institutions—feed demand for platforms that harmonize security controls with enterprise risk registers. Within the Policy and Audit Management Tools market, firms now embed SIEM feeds and incident-response runbooks directly into compliance workflows, allowing risk managers to prove continuous monitoring rather than periodic checks. This integration broadens addressable use cases beyond traditional audit logs into cyber resilience dashboards that satisfy both IT and compliance officers.
Expansion of Cloud-Native GRC Ecosystems
ServiceNow posted USD 3,005 million in subscription revenue in Q1 2025, underscoring a strong appetite for SaaS-delivered GRC modules. Average implementation times have dropped to 8.1 months, almost halving the historical norm, as multi-instance architectures remove the heavy customization burden highlighted by the RegTech Association. [3]RegTech Association, “RegTech/SupTech Report,” regtechglobal.org In the Policy and Audit Management Tools market, cloud adoption democratizes access for midsize firms by eliminating capex while affording large enterprises elastic scalability during quarter-end audit surges. Vendors emphasize zero-trust frameworks, granular tenancy models and regional data centers to convince regulators and compliance buyers that SaaS no longer compromises sovereignty or confidentiality.
Restraints Impact Analysis*
| Restraint | (~) % Impact on CAGR Forecast | Geographic Relevance | Impact Timeline |
|---|---|---|---|
| High switching costs from legacy spreadsheet workflows | -1.8% | Traditional industries worldwide | Medium term (2-4 years) |
| Fragmented data ownership across business units | -1.3% | Large enterprises worldwide | Long term (≥4 years) |
| Shortage of certified GRC professionals | -0.9% | Asia-Pacific and emerging markets | Long term (≥4 years) |
| Privacy concerns over multi-tenant SaaS storage | -0.7% | Europe and regulated sectors | Short term (≤2 years) |
| Source: Mordor Intelligence | |||
High Switching Costs from Legacy Spreadsheet Workflows
Long-standing reliance on bespoke spreadsheets embeds tacit knowledge and niche reporting macros that do not translate neatly into structured platforms. Implementation services can cost 2-3 times the annual license fee for complex rollouts, a fact frequently cited by risk committees when justifying deferred upgrades. The Policy and Audit Management Tools market nevertheless counters this inertia through outcome-based pricing and pre-built migration accelerators that bulk-load historical controls into relational schemas. Case studies show post-deployment gains such as a 90% cut in compliance effort and a 67% uptick in risk-reporting visibility among MetricStream customers, gradually eroding resistance as cost-of-delay arguments mount.
Fragmented Data Ownership Across Business Units
Siloed risk registers in finance, operations and IT mask systemic exposures and yield contradictory compliance attestations. Barclays’ deployment of Citicus ONE revealed the scale of issue-tracking inconsistencies when data inputs were finally centralized. Legacy hierarchy, territorial metrics and diverging taxonomies complicate enterprise rollouts in the Policy and Audit Management Tools market, forcing buyers to couple technology with change-management programs. Yet as cross-functional initiatives like operational resilience and integrated ESG narratives gain board traction, centralized platforms increasingly become non-negotiable, converting this restraint into a transitional hurdle rather than a structural barrier.
*Our forecasts treat driver/restraint impacts as directional, not additive. The impact forecasts reflect baseline growth, mix effects, and variable interactions.
Segment Analysis
By Component: Software Dominance Drives Innovation
Software solutions held 68.23% of Policy and Audit Management Tools market share in 2024, reinforcing the sector’s preference for configurable platforms over ad hoc consulting engagements. Vendors differentiate on low-code orchestration, policy templating and AI copilots that draft remediation plans, fueling a 12.54% CAGR across the overall Policy and Audit Management Tools market. Services, while smaller, benefit from implementation complexity and post-go-live optimization needs, expanding at a 12.59% pace as buyers seek trusted advisors for taxonomy harmonization and control rationalization.
The Policy and Audit Management Tools market size for services is projected to surpass USD 1.2 billion by 2030 as skill shortages elevate the role of managed support providers. AI-enhanced toolkits such as MetricStream’s AiSPIRE reduce manual control testing costs by more than 30%, freeing in-house auditors to focus on judgment-intensive tasks. Simultaneously, independent service firms monetize accelerators that plug predictive analytics into existing deployments, ensuring post-implementation stickiness and a virtuous cycle of innovation.


By Deployment Mode: Cloud Transformation Accelerates
Cloud-based implementations captured 57.34% of Policy and Audit Management Tools market share in 2024 on the strength of subscription economics and rapid onboarding. Average deployment timelines fell below nine months, aligning with compliance renewal cycles and compelling laggard industries to reconsider on-premise default positions. The Policy and Audit Management Tools market size for cloud deployments is forecast to climb as established vendors extend regional hosting facilities to address sovereignty sensitivities in finance and healthcare.
On-premise installations persist in jurisdictions mandating physical data residency or air-gapped security architectures, yet their relative weight declines annually. Multi-tenant SaaS configurations appeal to SMEs that lack dedicated IT staff, while single-tenant, customer-managed keys calm regulated entities wary of shared infrastructure. As zero-trust patterns mature, the cloud segment of the Policy and Audit Management Tools market becomes not just the fastest but the default growth engine, consolidating disparate compliance silos into unified platforms with API-centric ecosystems.
By Organization Size: SME Growth Outpaces Enterprise Adoption
Large enterprises represent 62.81% of 2024 revenue, reflecting sprawling compliance scopes across global operations. These buyers favor extensible Policy and Audit Management Tools market platforms that integrate fine-grained access controls and multi-jurisdictional rulebooks. Yet SMEs, buoyed by SaaS pricing and regulatory expansion, are advancing at a 12.93% CAGR, diluting enterprise share over time. The Policy and Audit Management Tools market size for SMEs is predicted to top USD 1 billion by 2030 as tools ship with turnkey libraries matching common ISO, SOC 2 and PCI benchmarks.
Centennial Bank’s leap from manual BSA/AML checklists to automated workflows while quadrupling assets to USD 7.1 billion illustrates how streamlined onboarding lowers entry thresholds. Mature platforms now embed wizard-guided control mapping, chat-based policy drafting and contextual risk scoring that remove the need for specialized staff, allowing smaller entities to comply with evolving statutes on par with multinational peers.
By End-Use Industry: Financial Services Lead Regulatory Adoption
BFSI dominated 2024 with 24.91% of Policy and Audit Management Tools market share due to Basel III liquidity ratios, SOX internal-control testing and stringent anti-money-laundering rules. High breach penalties elevate board attention, directing budget into integrated suites that cross-link credit, market and operational risk. Retail and e-commerce, however, is registering the sharpest CAGR at 12.84% as data-privacy laws and omnichannel fraud threats converge.
Healthcare, manufacturing and energy follow closely, each grappling with sector-specific mandates such as HIPAA, FDA 21 CFR Part 11 and ISO 55001 asset reliability respectively. A global automaker’s deployment of FreshGRC to standardize risk reporting across plants underscores the appetite for configurable frameworks that merge safety, quality and sustainability data. Government adoption accelerates in tandem with open-data policies, while education institutions increasingly rely on automated attestations to satisfy grant-funding compliance.

By Application: Compliance Management Leads Market Adoption
Compliance management accounted for 27.48% of 2024 revenue, reflecting urgent needs to automate rule tracking, evidence gathering and regulator communication. The Policy and Audit Management Tools market size tied to compliance modules is forecast to reach USD 1.25 billion by 2030 as mandates proliferate across ESG, cybersecurity and third-party ethics programs. Incident and issue management, recording a 12.79% CAGR, benefits from greater board sensitivity to near-miss analysis and whistle-blower reporting.
Policy authoring, audit scheduling and risk heat-mapping coalesce into holistic suites that replace point solutions. Buyers prefer platforms that correlate control failures with root-cause analytics, enabling proactive remediation rather than reactive firefighting. This consolidation trend supports a richer ecosystem of plug-ins such as secure evidence vaults, real-time notification bots and natural language policy explainers, solidifying the Policy and Audit Management Tools market as an operational backbone rather than a compliance afterthought.
Geography Analysis
North America retained 38.78% of Policy and Audit Management Tools market share in 2024 as Fortune-500 enterprises devote more than USD 20 million each year to cybersecurity and compliance tooling. Early SOX mandates seeded demand that has since broadened into integrated operational-resilience and ESG accountability modules. Cloud maturity, coupled with depth of certified GRC talent, accelerates AI pilots that further entrench North American leadership. Canada advances harmonization with U.S. frameworks, while Mexico’s burgeoning fintech scene pushes local firms to adopt automated control testing to satisfy cross-border investors.
Asia-Pacific is the fastest growing region at 12.99% CAGR to 2030, fuelled by clamp-downs on bribery and tightened AML statutes in Australia, China, Hong Kong, Japan and Singapore. Establishment of Australia’s National Anti-Corruption Commission, combined with China’s enhanced penalty regime for financial crimes, requires enterprises to deploy real-time surveillance and automated SAR filing. Local-language interfaces and regional hosting become decisive differentiators in the Policy and Audit Management Tools market as cultural nuances in policy interpretation influence workflow design. The region’s digital-first SMEs amplify cloud penetration, while multinational supply chains elevate ESG transparency demands.
Europe posts steady growth anchored by GDPR compliance and the Corporate Sustainability Reporting Directive effective 2025, compelling over 49,000 companies to adopt unified sustainability reporting. ESMA’s mandate for the European Single Electronic Format elevates demand for XBRL-ready document generation inside GRC platforms. The Digital Operational Resilience Act expands the buyer base beyond finance into telecom and critical-infrastructure sectors. South America and the Middle East and Africa remain nascent but promising: cloud economics remove capex barriers, and regulatory agencies increasingly reference international best practice, accelerating convergence with mature compliance architectures.

Competitive Landscape
The Policy and Audit Management Tools market remains moderately fragmented: top five providers hold roughly 35-40% combined revenue, leaving ample headroom for niche disruptors. Market leaders-ServiceNow, MetricStream, Archer Technologies and IBM’s OpenPages-offer expansive integration libraries and co-innovation programs that lock in multinational clients. AI roadmaps dominate investment narratives. ServiceNow and NVIDIA’s April 2025 agreement to co-develop the Apriel Nemotron 15B reasoning model underscores the race to embed generative agents into everyday workflows, promising lower latency and richer contextual insights.
Strategic M&A accelerates consolidation. A Goldman Sachs Alternatives and Blackstone consortium acquired a majority stake in NAVEX in July 2025, signaling private-equity confidence in recurring revenue streams tied to mandatory compliance. Kroll’s purchase of Resolver marries incident forensics with cloud risk intelligence, while Mitratech’s acquisition of Prevalent expands third-party risk depth. Start-ups secure outsized valuations by automating adjacent pain points; Vanta’s USD 4.15 billion price tag validates investor appetite for audit-ready, AI-first platforms that onboard clients in days rather than months.
White-space opportunity persists in cross-domain ESG reporting, real-time operational technology risk coverage and embedded compliance inside vertical SaaS. Vendors increasingly package pre-built connectors into ERP, PLM and DevOps pipelines, ensuring preventive controls trigger before code, products or payments move downstream. As buyer sophistication rises, procurement favors platforms offering composable micro-services, granular licensing and transparent AI explainability, reshaping the Policy and Audit Management Tools market toward platform marketplaces rather than monolithic suites.
Policy And Audit Management Tools Industry Leaders
Archer Technologies LLC
NAVEX Global, Inc.
MetricStream, Inc.
LogicManager, Inc.
SAI Global Pty Limited
- *Disclaimer: Major Players sorted in no particular order

Recent Industry Developments
- July 2025: Goldman Sachs Alternatives and Blackstone acquired a majority stake in NAVEX, amplifying sector-consolidation momentum.
- July 2025: Vanta raised USD 150 million at a USD 4.15 billion valuation to scale AI-driven compliance automation.
- July 2025: Diligent introduced ACL AI Studio, adding generative analytics to audit workflows.
- July 2025: PayChex bought SixFifty for USD 70–85 million to embed automated employment-law compliance into HR suites.


Global Policy And Audit Management Tools Market Report Scope
| Software |
| Services |
| On-premise |
| Cloud-based |
| Large Enterprises |
| Small and Medium Enterprises |
| Banking, Financial Services and Insurance (BFSI) |
| Healthcare and Life Sciences |
| Information Technology and Telecommunications |
| Manufacturing |
| Energy and Utilities |
| Government and Public Sector |
| Retail and E-Commerce |
| Transportation and Logistics |
| Education and Non-profit |
| Policy Management |
| Audit Management |
| Compliance Management |
| Risk Management |
| Incident and Issue Management |
| North America | United States | |
| Canada | ||
| Mexico | ||
| South America | Brazil | |
| Argentina | ||
| Rest of South America | ||
| Europe | Germany | |
| United Kingdom | ||
| France | ||
| Russia | ||
| Rest of Europe | ||
| Asia-Pacific | China | |
| Japan | ||
| India | ||
| South Korea | ||
| Australia | ||
| Rest of Asia-Pacific | ||
| Middle East and Africa | Middle East | Saudi Arabia |
| United Arab Emirates | ||
| Rest of Middle East | ||
| Africa | South Africa | |
| Egypt | ||
| Rest of Africa | ||
| By Component | Software | ||
| Services | |||
| By Deployment Mode | On-premise | ||
| Cloud-based | |||
| By Organization Size | Large Enterprises | ||
| Small and Medium Enterprises | |||
| By End-use Industry | Banking, Financial Services and Insurance (BFSI) | ||
| Healthcare and Life Sciences | |||
| Information Technology and Telecommunications | |||
| Manufacturing | |||
| Energy and Utilities | |||
| Government and Public Sector | |||
| Retail and E-Commerce | |||
| Transportation and Logistics | |||
| Education and Non-profit | |||
| By Application | Policy Management | ||
| Audit Management | |||
| Compliance Management | |||
| Risk Management | |||
| Incident and Issue Management | |||
| By Geography | North America | United States | |
| Canada | |||
| Mexico | |||
| South America | Brazil | ||
| Argentina | |||
| Rest of South America | |||
| Europe | Germany | ||
| United Kingdom | |||
| France | |||
| Russia | |||
| Rest of Europe | |||
| Asia-Pacific | China | ||
| Japan | |||
| India | |||
| South Korea | |||
| Australia | |||
| Rest of Asia-Pacific | |||
| Middle East and Africa | Middle East | Saudi Arabia | |
| United Arab Emirates | |||
| Rest of Middle East | |||
| Africa | South Africa | ||
| Egypt | |||
| Rest of Africa | |||


Key Questions Answered in the Report
What is the projected value of the Policy and Audit Management Tools market in 2030?
The Policy and Audit Management Tools market is forecast to reach USD 3.81 billion by 2030 at a 12.54% CAGR.
Which deployment mode is expanding fastest within the sector?
Cloud-based platforms post the highest 12.67% CAGR as enterprises prioritize scalability and lower up-front costs.
Why are SMEs adopting compliance platforms more aggressively?
Affordable SaaS pricing and expanding regulatory coverage allow SMEs to access enterprise-grade controls without heavy capital expenditure.
Which geographic region is expected to show the strongest growth?
Asia-Pacific leads with a 12.99% CAGR due to regulatory modernization and digital transformation across key economies.
How are insurers influencing demand for compliance software?
Underwriters increasingly require evidence of policy controls before coverage is approved, pushing organizations toward automated GRC suites.
What distinguishes leading vendors in this market?
Leaders combine AI-driven analytics, low-code configurability and extensive partner ecosystems to deliver end-to-end governance and real-time risk visibility.
Page last updated on:


