Insurance Software Market Size and Share
Market Overview
| Study Period | 2020 - 2031 |
|---|---|
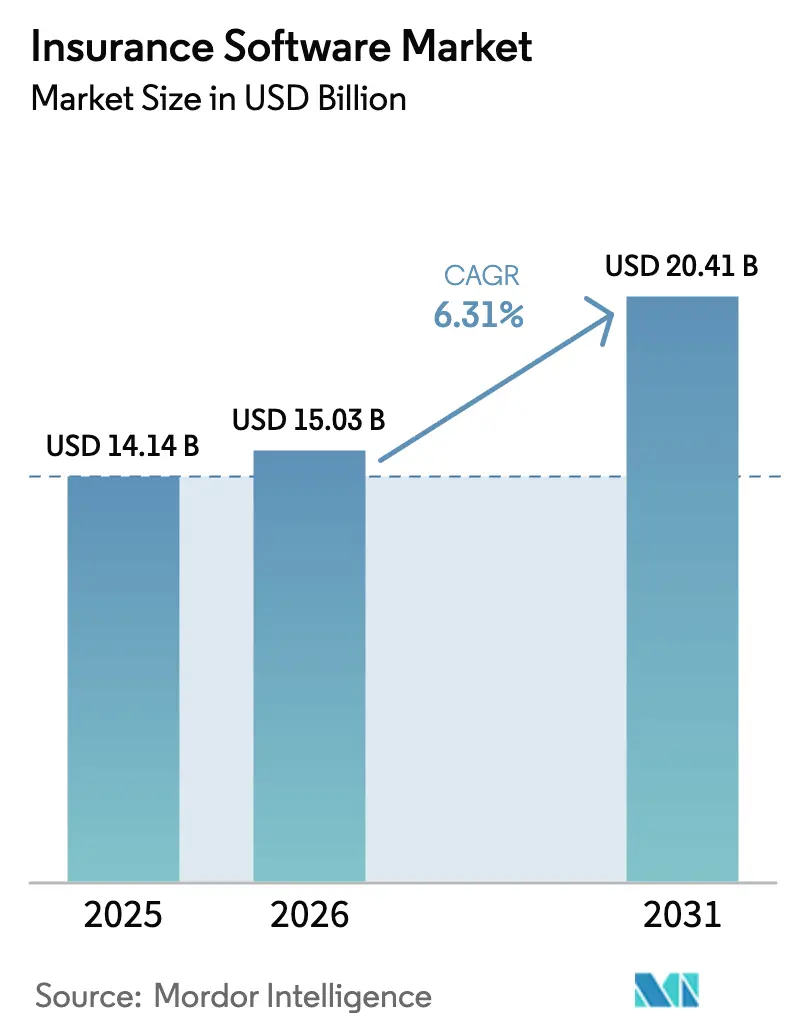
| Market Size (2026) | USD 15.03 Billion |
| Market Size (2031) | USD 20.41 Billion |
| Growth Rate (2026 - 2031) | 6.31% CAGR |
| Fastest Growing Market | Asia Pacific |
| Largest Market | North America |
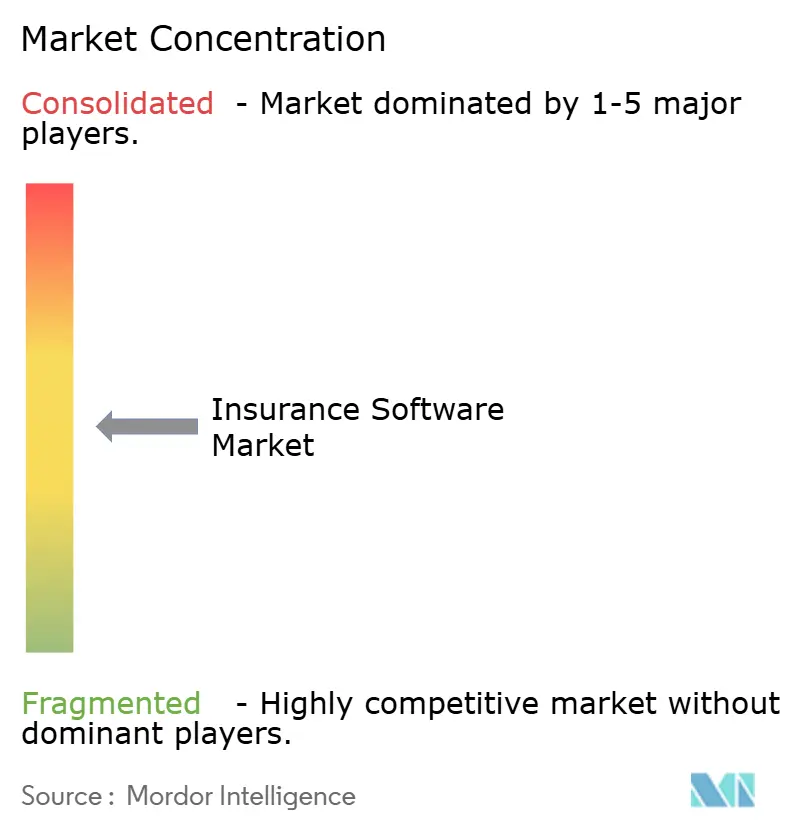
| Market Concentration | Medium |
Major Players *Disclaimer: Major Players sorted in no particular order Image © Mordor Intelligence. Reuse requires attribution under CC BY 4.0. | |
Insurance Software Market Analysis by Mordor Intelligence
The Insurance Software Market size was valued at USD 14.14 billion in 2025 and is estimated to grow from USD 15.03 billion in 2026 to reach USD 20.41 billion by 2031, at a CAGR of 6.31% during the forecast period (2026-2031).
Growth is propelled by insurers shifting from incremental IT upgrades to full-scale platform renewal that supports real-time pricing, embedded distribution, and continuous compliance reporting. Cloud-native deployment already accounts for 65.7% of current revenue and, at a 10.5% CAGR, will widen its lead as late adopters migrate from aging mainframes. Property and casualty (PandC) solutions dominate 2024 spending with 48.8% share, but health and accident systems grow the fastest at 12.3% CAGR on post-pandemic engagement mandates. Private equity has poured more than USD 6 billion into vendors since 2024, accelerating feature delivery cycles and intensifying price competition. Regionally, North America supplies the largest budgets, yet Asia-Pacific’s double-digit expansion highlights a greenfield advantage for API-first, mobile-led deployments.
Key Report Takeaways
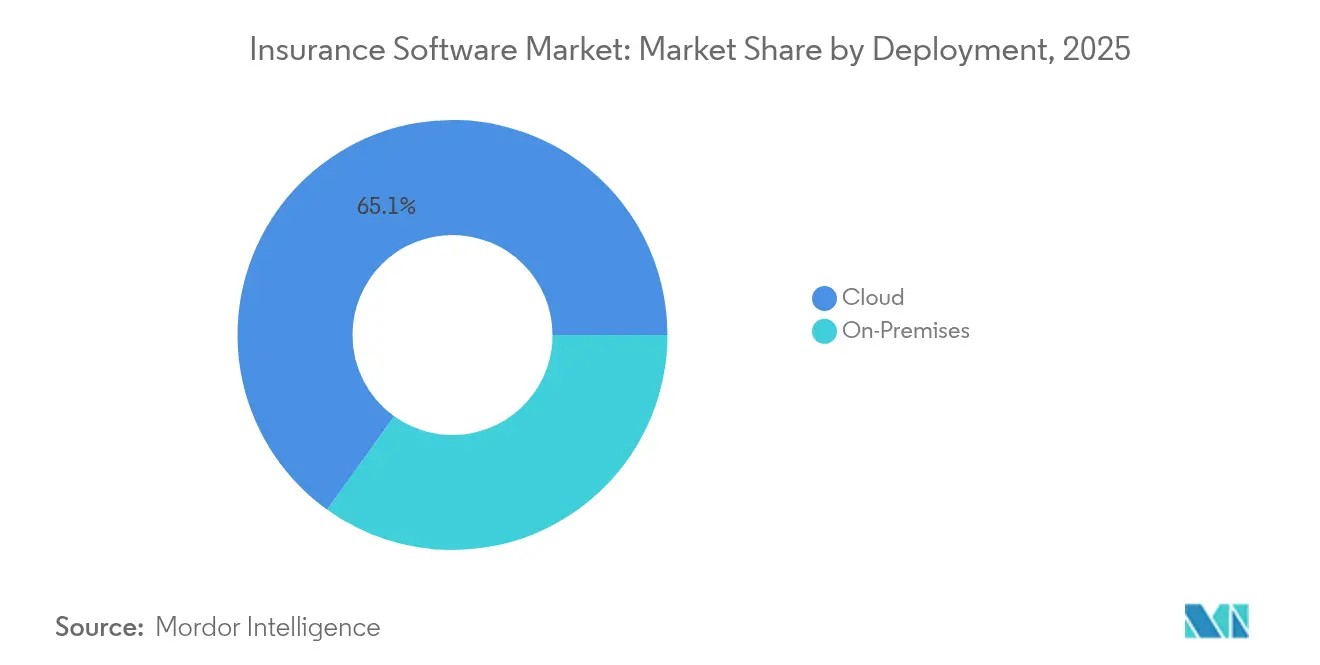
- By deployment, cloud delivery led with 65.10% of insurance software market share in 2025; the same model is projected to expand at 10.26% CAGR through 2031.
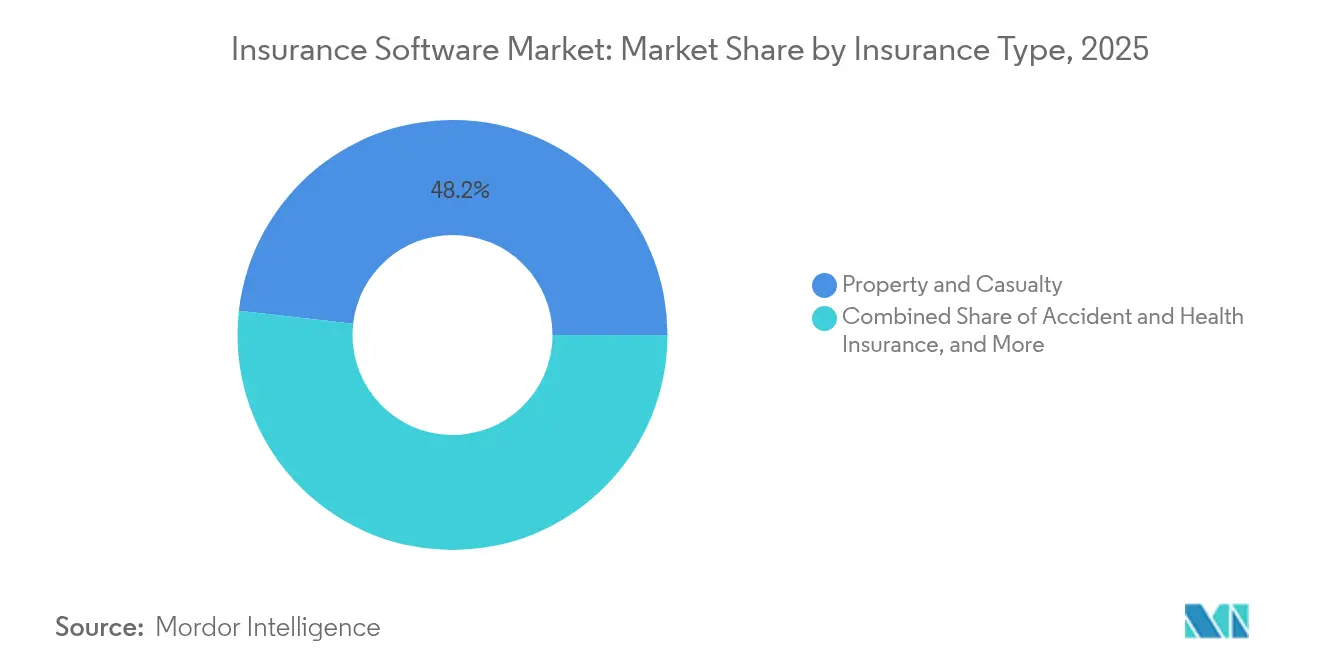
- By insurance type, the PandC segment held 48.20% of the insurance software market size in 2025, whereas accident and health solutions record the highest 11.85% CAGR to 2031.
- By end user, insurance companies commanded 61.60% revenue share in 2025; broker platforms post the fastest 7.92% CAGR to 2031.
- By geography, North America represented 38.35% of global revenue in 2025, while Asia-Pacific is forecast to grow at 10.45% CAGR between 2026-2031.
- Guidewire, Duck Creek, and Applied Systems together generated USD 918 million in annual recurring revenue in 2024, accounting for a combined 15.85% insurance software market share.
Note: Market size and forecast figures in this report are generated using Mordor Intelligence’s proprietary estimation framework, updated with the latest available data and insights as of 2026.
Global Insurance Software Market Trends and Insights
Drivers Impact Analysis*
| Driver | (~) % Impact on CAGR Forecast | Geographic Relevance | Impact Timeline |
|---|---|---|---|
| Cloud-native platform adoption | +1.8% | Global; early uptake in North America and Europe | Medium term (2-4 years) |
| AI-driven underwriting and claims automation | +1.2% | North America and Asia-Pacific core | Short term (≤ 2 years) |
| Usage-based and embedded insurance shift | +0.9% | Asia-Pacific core, expanding to North America and Europe | Long term (≥ 4 years) |
| Regulatory push for real-time APIs | +0.7% | Europe and North America stringent | Medium term (2-4 years) |
| PE-backed roll-ups of core vendors | +0.5% | North America and Europe, expanding to Asia-Pacific | Short term (≤ 2 years) |
| Climate-risk analytics adoption | +0.4% | Global; focus on climate-vulnerable economies | Long term (≥ 4 years) |
| Source: Mordor Intelligence | |||
Cloud-native platform adoption accelerates digital transformation
Insurers now view migration to the cloud as a competitive requirement, not a cost exercise. Lincoln Financial Group completed a two-year cloud switch that cut software licensing costs and shortened cycle times by 20-30% while creating flexible DevOps pipelines.[1]Lincoln Financial Group, “Lincoln Financial Group Completes Cloud Modernization,” newsroom.lfg.com Guidewire’s cloud suite already supports more than 570 insurers worldwide and lifted subscription revenue 35% in Q2 2025. Cloud architectures enable real-time data ingestion essential for dynamic pricing and embedded distribution, as seen in Duck Creek’s Policy solution that delivers bi-weekly updates through low-code tools. Variable infrastructure economics arising from these deployments free capital for rapid product iterations that legacy mainframes cannot match.
Rising insurer focus on AI-driven underwriting and claims automation
Artificial intelligence has advanced from pilot to production in underwriting, fraud detection, and claims adjudication. Guidewire’s Las Leñas release embeds machine-learning models that cut application review from days to minutes. LTIMindtree’s AI-Smart Underwriter on ServiceNow speeds risk assessment while halving administrative loads. Salesforce now offers pre-built AI components for policy administration that boost straight-through processing rates for mid-tier carriers. Sapiens’ UnderwritingPro v14 combines predictive analytics with agent portals, trimming processing costs by up to 40% and increasing customer satisfaction.[2]New York State Department of Financial Services, “23 NYCRR 500 Cybersecurity Requirements,” dfs.ny.gov
Shift to usage-based and embedded insurance products
Coverage is moving closer to the point of purchase. Smartpay and Chubb launched Japan’s first embedded insurance for Buy Now Pay Later transactions, opening new youth segments. Zendrive powers usage-based auto programs that price risk from real-time driving signals captured by mobile sensors. Chubb Studio has integrated with e-commerce and banking partners to reach more than 100 million customers across Asia and Latin America, demonstrating scale advantages for API-first distribution. These models demand open, event-driven architectures that legacy systems cannot deliver.
Regulatory pushes for real-time compliance and reporting APIs
Rules such as Europe’s Digital Operational Resilience Act and the NAIC Insurance Data Security Model Law require automated incident reporting and continuous monitoring. DORA obliges European insurers to map ICT supply chains and test cyber-resilience from 2025. At least 22 U.S. states have adopted the NAIC model, imposing 72-hour breach notifications. New York’s 23 NYCRR 500 mandates multi-factor authentication and annual compliance filings.[3]Source: Sapiens International, “UnderwritingPro v14 Release Notes,” sapiens.com Meeting overlapping mandates propels demand for integrated governance frameworks embedded into core platforms.
Restraints Impact Analysis*
| Restraint | (~) % Impact on CAGR Forecast | Geographic Relevance | Impact Timeline |
|---|---|---|---|
| Legacy core migrations remain complex | -1.1% | Global; acute in North America and Europe | Medium term (2-4 years) |
| Cyber-security and data-sovereignty hurdles | -0.8% | Europe and North America tightening | Short term (≤ 2 years) |
| Shortage of insurtech-skilled talent | -0.6% | Global; severe in North America | Long term (≥ 4 years) |
| Insurer M&A delays IT refresh decisions | -0.3% | North America and Europe selective | Medium term (2-4 years) |
| Source: Mordor Intelligence | |||
Legacy core migrations remain complex and costly
Many carriers still operate 20-year-old mainframes that lack APIs and present data-conversion risks. Life-policy data fields number into the thousands, making clean migrations prone to errors and extended testing. Equisoft notes that fear of disruption keeps some life insurers on legacy policy systems even as competitors gain agility with rules-based solutions. Balancing run-the-business continuity with phased replacement schedules inflates budgets and slows time-to-value.
Cyber-security and data-sovereignty regulations tighten
Insurers must simultaneously guard against rising ransomware and meet region-specific privacy rules. The NAIC model law forces carriers to maintain documented information-security programs and report incidents within three days. DORA extends oversight to cloud providers, requiring resilient multi-region deployments. New York’s Class A designation now compels larger insurers to implement continuous threat monitoring and maintain internal audit functions. Cloud vendors without in-region data centers face disqualification, limiting supplier pools and raising implementation costs.
*Our forecasts treat driver/restraint impacts as directional, not additive. The impact forecasts reflect baseline growth, mix effects, and variable interactions.
Segment Analysis
By Deployment: Cloud dominance accelerates
Cloud deployment captured 65.10% of 2025 revenue, equal to the largest slice of the insurance software market. At the same time, it is forecast to post a 10.26% CAGR, making it both the incumbent and the growth engine. The insurance software market size advantage arises because elastic infrastructure supports real-time rating, low-code configuration, and bi-weekly feature drops that on-premises stacks cannot match. Subscription models convert fixed CapEx into variable OpEx, freeing budgets for innovation. Guidewire Cloud reported 35% subscription growth on the back of 570 live insurers, while Duck Creek’s Active Delivery shows how automatic updates keep carriers evergreen. On-premises installations persist for regulated lines such as workers’ compensation where data-sovereignty rules still hinder cloud adoption, yet their share continues to erode as hyperscalers achieve compliance certifications across additional jurisdictions.
Cloud migrations also underpin embedded insurance rollouts, because retailers and mobility platforms demand API-first connections that can be spun up in weeks. Carriers running cloud cores report launch cycles that are one-quarter of those on legacy stacks, enabling them to test niche micro-products without sunk-cost risk. Moreover, vendors bundle cloud hosting with DevSecOps toolchains and continuous penetration testing, partially offsetting new cyber-compliance burdens. As a result, enterprise architects now rank portability and event-stream processing among top vendor-selection criteria, re-inforcing the flywheel for further cloud adoption in the insurance software market.


By Insurance Type: PandC leadership meets AandH innovation
Property and casualty systems held 48.20% of 2025 revenue, securing the single-largest vertical position in the insurance software market. Multi-line complexity, high claims volumes, and tight regulatory reporting requirements lock in ongoing PandC spend. Conversely, accident and health platforms grow at 11.85% CAGR through 2031, the fastest of all segments. Wellness programs, telehealth integration, and pandemic-driven digital mandates pull fresh IT budgets into this line. Consequently, accident and health applications will lift their share of the insurance software market size faster than any other segment over the forecast period.
PandC’s continued dominance is reinforced by climate-driven catastrophe modelling and usage-based auto programs that require petabyte-scale data ingestion. Vendors embed predictive scoring for wildfire or flood exposure and deliver AI-assisted claims triage to control loss ratios. In the health arena, API connections to wearable devices and pharmacy benefit platforms unlock real-time engagement, while rules engines personalize benefits for each cohort. Life and annuity software adoption is also rising, especially in Asia, where rising middle classes demand wealth-accumulation products managed via mobile apps. The result is a diversified yet synergistic demand profile that keeps multi-line vendors ahead of niche suppliers.
By End User: Brokers drive digital acceleration
Insurers themselves generated 61.60% of overall 2025 spending, reflecting control over core policy-administration decisions. Nevertheless, the broker channel is the fastest-growing buyer group at 7.92% CAGR. AI-powered prospecting, instant quoting, and automated renewals are essential for intermediaries defending margin against direct-to-consumer carriers. Applied Systems’ Marketing Automation module increased renewal productivity for the MacCormack Agency by 47%, showing tangible ROI. As new advisory-as-a-service models emerge, brokers will require CRM, commission management, and connectivity to comparative raters, broadening the addressable insurance software market.
Carrier IT budgets remain larger in absolute terms; however, their multi-year program timelines yield slower annual growth. Large insurers prioritize cloud migrations, IFRS 17 accounting engines, and cyber-resilience upgrades—all capital intensive and sequential. Brokers, by contrast, roll out SaaS plug-ins in quarters, fueling higher velocity for vendors that can prove out short payback periods. Agencies and managing general agents occupy the middle ground, integrating policy lifecycle tools with lead-generation platforms to preserve customer stickiness.

Geography Analysis
North America remains the largest regional buyer, accounting for 38.35% of 2025 global revenue. Carriers funnel budgets into cloud migration programs that unwind decades-old mainframes, comply with the NAIC Insurance Data Security Model Law, and satisfy New York’s 23 NYCRR 500 rules on multi-factor authentication and 72-hour breach notifications. Vendor selection favors established suites with proven integration accelerators, as illustrated by Guidewire’s USD 918 million annual recurring revenue in 2024.
Asia-Pacific delivers the fastest growth, clocking a 10.45% CAGR through 2031. Rising disposable incomes and favorable regulatory sandboxes allow carriers to launch API-centric products that bundle coverage with e-commerce, mobility, or wellness apps. When Chubb Studio integrated with a Southeast Asian super-app, it gained exposure to tens of millions of new users. China’s return to premium expansion and India’s 9% life-insurance growth guide vendors to localise interfaces and comply with on-shore data-residency rules.
Europe’s outlook is shaped by DORA, which formalizes ICT risk-management obligations and continuous testing from 2025. Carriers invest in observability, third-party vendor assessment, and centralized incident playbooks. Meanwhile, Latin America and Africa accelerate from a low base as regulators introduce digital-policy acceptance and e-signature frameworks that remove paper-based bottlenecks. Carriers in these regions often select cloud systems bundled with managed services to offset skill shortages, illustrating the diverse yet complementary growth vectors within the insurance software market.


Competitive Landscape
The insurance software market is moderately fragmented. Full-suite vendors such as Guidewire, Duck Creek, and Sapiens enjoy high renewal rates because switching core systems entails multi-year transformations. Guidewire alone serves over 570 insurers and generated USD 918 million in recurring revenue in 2024. Duck Creek, acquired by Vista Equity Partners for USD 2.6 billion in 2024, uses private-equity backing to accelerate cloud roadmap delivery. Applied Systems dominates broker management software and is extending into AI-driven prospecting that automates campaign design.
Niche disruptors such as Socotra, BriteCore, and Zendrive specialize in embedded distribution, policy-as-code, or telematics scoring. While they gain speed advantages, scale remains a hurdle, making them attractive acquisition targets for larger platforms seeking point-solution depth. Technology giants also court insurance workloads: Microsoft’s Copilot for Office automates claims correspondence, whereas Salesforce integrates policy and billing within its Financial Services Cloud. Oracle and SAP pursue core-admin upgrades using in-memory databases to satisfy IFRS 17 and DORA data-lineage demands.
Private equity has committed more than USD 6 billion since 2024, driving a roll-up strategy that bundles complementary modules and seeks cross-sell synergies. Vista’s pending USD 1.3 billion deal for Itel highlights sustained appetite for mid-market vendors offering specialized risk engines. Consolidation compresses pricing in mature modules such as billing yet injects capital for greenfield investments in climate-analytics or generative-AI underwriting, sharpening the competitive intensity across all tiers of the insurance software market.
Insurance Software Industry Leaders
Guidewire Software, Inc.
Duck Creek Technologies
Applied Systems
Insurity
Majesco
- *Disclaimer: Major Players sorted in no particular order

Recent Industry Developments
- June 2025: Vista Equity Partners nears completion of USD 2 billion acquisition of Acumatica Inc. to expand its business-software portfolio.
- June 2025: Datasite acquires Grata within a USD 500 million investment by CapVest Partners to enhance AI-powered M&A workflow solutions.
- March 2025: HDI Global Insurance Company selects Guidewire PolicyCenter on Guidewire Cloud to boost efficiency, starting with general liability lines.
- February 2025: Qantev and INSTANDA announce a partnership to modernize life and health distribution, operations, and claims via AI-driven tools.


Research Methodology Framework and Report Scope
Market Definitions and Key Coverage
Our study defines the insurance software market as all commercial off-the-shelf platforms and suites that let insurers, managing general agents, and brokers administer policies, rate and underwrite risks, process claims, handle billing, and analyze data across life, property and casualty, accident, and health lines. The valuation tracks vendor license, subscription, and maintenance revenues booked for these core functions in 2025, expressed in USD.
Scope exclusions: we do not count bespoke code written by in-house IT teams or revenue from non-insurance banking, wealth, or wider fintech modules.
Segmentation Overview
- By Deployment
- Cloud
- On-Premises
- By Insurance Type
- Life Insurance
- Accident and Health Insurance
- Property and Casualty Insurance
- Other Types
- By End User
- Insurance Companies
- Brokers
- Agencies
- By Geography
- North America
- United States
- Canada
- Mexico
- South America
- Brazil
- Argentina
- Rest of South America
- Europe
- Germany
- United Kingdom
- France
- Italy
- Spain
- Russia
- Rest of Europe
- Asia-Pacific
- China
- Japan
- India
- South Korea
- ASEAN
- Rest of Asia-Pacific
- Middle East and Africa
- Middle East
- Saudi Arabia
- United Arab Emirates
- Turkey
- Rest of Middle East
- Africa
- South Africa
- Nigeria
- Egypt
- Rest of Africa
- Middle East
- North America
Detailed Research Methodology and Data Validation
Primary Research
Several conversations with underwriting heads, regional CIOs, policy administration vendors, and insurtech investors across North America, Europe, and Asia helped us stress-test service scope, average selling prices, and deployment mix. Follow-up email questionnaires captured cloud share shifts, implementation backlogs, and expected renewal pricing, letting us reconcile gray areas left by desktop sources.
Desk Research
Mordor analysts first pulled base figures from public sources such as NAIC statutory filings, EIOPA Solvency reports, and the Swiss Re sigma database, which publish premium flows that signal software demand. We then reviewed technology adoption series released by the Insurance Information Institute, ISO claim trend digests, and patent data from Questel that show where product development is heading. Supplemental color came from company 10-Ks, investor decks, and regulatory consultation papers discussing cloud migration rules. These sources laid the factual groundwork, yet are illustrative only; many additional publications were referenced during data gathering and cross-checks.
The second pass synchronized macro inputs, including OECD GDP and Gartner IT-spend trackers, with segment cues such as Marklines' telematics statistics for usage-based auto policies and Asia Metal cyber-risk loss ratios, giving us a rounded view before primary validation.
Market-Sizing & Forecasting
A top-down premium pool to IT-spend conversion model anchors the 2025 baseline. We applied historical insurer software spend as a share of earned premiums, adjusted for cloud penetration rates, digital claims volume, and average policy complexity. Bottom-up checks, vendor revenue roll-ups and sampled license fee × install base, tempered the totals. Key drivers tracked include: proportion of policies processed through cloud cores, number of digital claims per thousand policies, insurer capital expenditure ratios, regulatory modernization deadlines, and regional premium growth. A multivariate regression blended with scenario analysis projects these variables through 2030; expert consensus refined outlier forecasts and filled data gaps where bottom-up coverage was thin.
Data Validation & Update Cycle
Before sign-off, senior researchers reran variance tests against independent metrics, flagged anomalies over three percent, and re-queried sources when needed. The model is refreshed every year, with interim revisions triggered by sizeable mergers, regulatory shocks, or material currency swings, ensuring clients always receive the latest vetted view.
Why Our Insurance Software Baseline Commands Reliability
Published figures often differ because firms draw wider digital platforms, bundle services, or push aggressive cloud price curves. Mordor's disciplined scope and annual refresh help executives compare like with like and plan budgets confidently.
Key gap drivers include differing inclusion of professional services, one-time customization fees, contrasting cloud adoption assumptions, and currency conversion points that vary across calendars.
Benchmark comparison
| Market Size | Anonymized source | Primary gap driver |
|---|---|---|
| USD 14.14 B (2025) | Mordor Intelligence | - |
| USD 116.16 B (2025) | Global Consultancy A | Bundles IT services and consulting along with software, uses aggressive cloud uplift factor |
| USD 4.56 B (2024) | Trade Journal B | Tracks only specialty lines software and excludes life & health modules |
| USD 3.81 B (2024) | Research Boutique C | Counts on-premise license deals, omits SaaS renewals and Asian vendors |
Taken together, the comparison shows how scope width, service inclusion, and refresh cadence can swing totals by more than a factor of ten. According to Mordor Intelligence, our transparent variable set and repeatable checks deliver a balanced starting point that strategy teams can rely on without second-guessing hidden assumptions.


Key Questions Answered in the Report
What is the current size of the insurance software market?
The market stands at USD 15.03 billion in 2026 and is projected to hit USD 20.41 billion by 2031.
Which deployment model is growing fastest?
Cloud delivery leads with 65.10% revenue share and a 10.26% CAGR through 2031.
Which insurance line shows the highest growth rate?
Accident and health software posts the quickest expansion at 11.85% CAGR because of digital-first healthcare mandates.
Why are brokers important buyers of insurance software?
Brokers adopt AI-based prospecting and automated renewals, driving an 7.92% CAGR in their software spending as they defend margins against direct channels.
Which region will add the most incremental revenue by 2031?
Asia-Pacific, expanding at 10.45% CAGR, will contribute the largest absolute growth due to greenfield implementations and embedded insurance uptake.
Page last updated on:


