Log Management Market Size and Share
Market Overview
| Study Period | 2020 - 2031 |
|---|---|
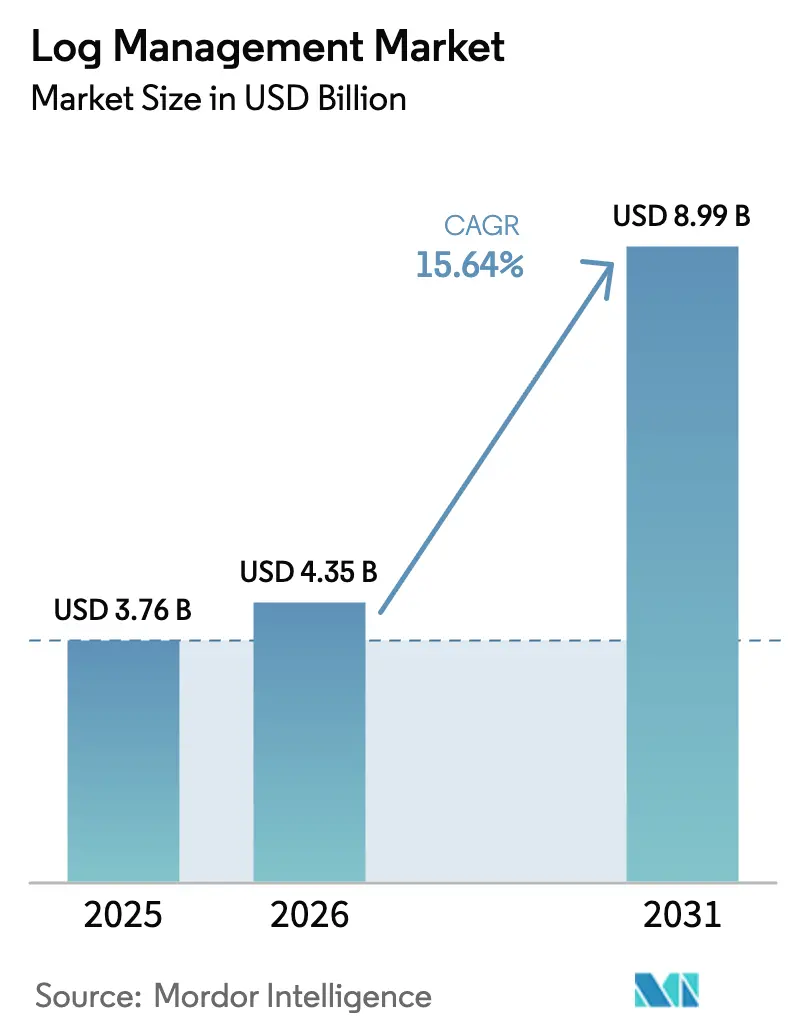
| Market Size (2026) | USD 4.35 Billion |
| Market Size (2031) | USD 8.99 Billion |
| Growth Rate (2026 - 2031) | 15.64% CAGR |
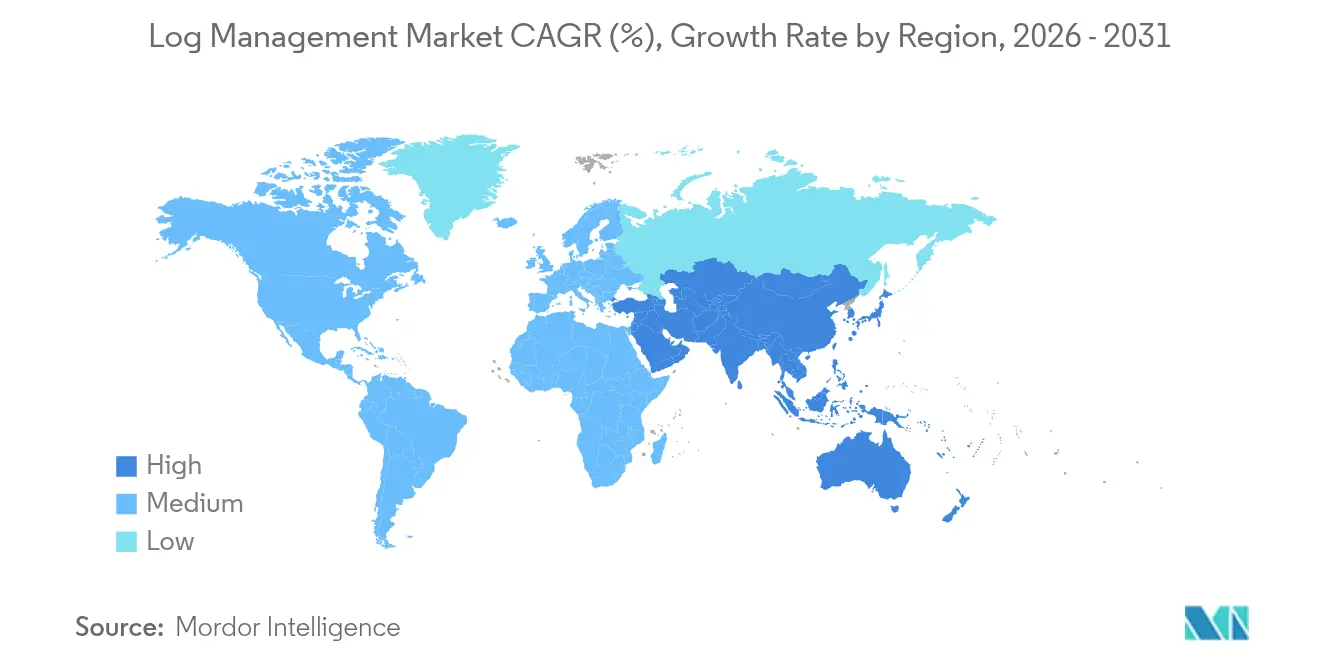
| Fastest Growing Market | Asia Pacific |
| Largest Market | North America |
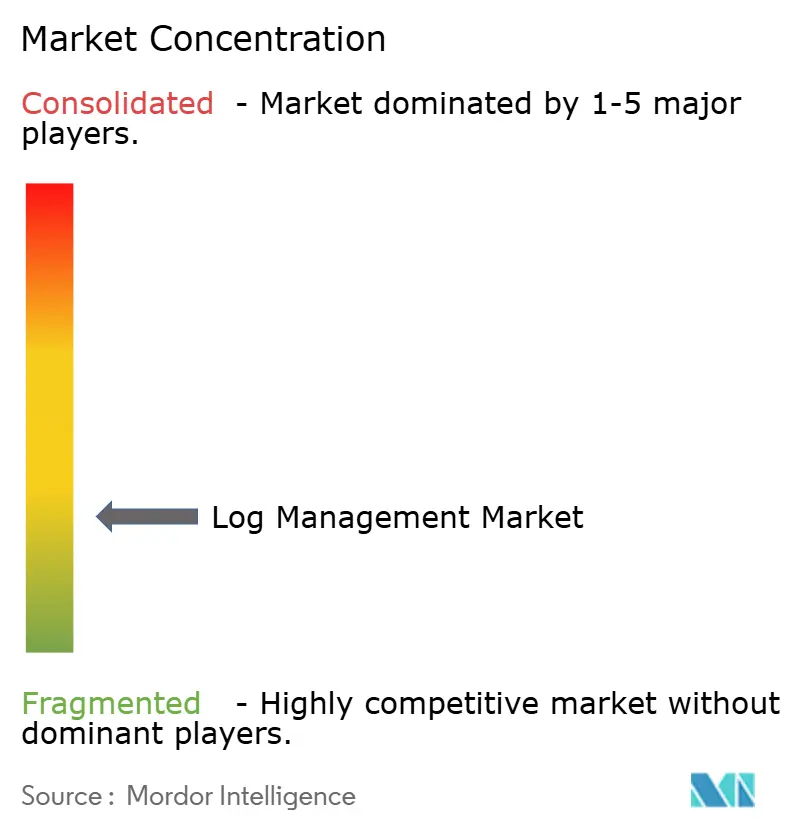
| Market Concentration | Low |
Major Players *Disclaimer: Major Players sorted in no particular order Image © Mordor Intelligence. Reuse requires attribution under CC BY 4.0. | |
Log Management Market Analysis by Mordor Intelligence
The log management market size is expected to grow from USD 3.76 billion in 2025 to USD 4.35 billion in 2026 and is forecast to reach USD 8.99 billion by 2031 at 15.64% CAGR over 2026-2031. Demand accelerates as enterprises treat log data as a strategic asset, deploying platforms that combine security analytics, IT operations, and cost-optimization features. Cloud deployment already accounts for more than two-thirds of revenue, reflecting the growing need for elastic scale and consumption pricing. Generative-AI observability is shortening mean time to resolution while easing the talent shortage by automating routine analysis. Industry consolidation—highlighted by Cisco’s purchase of Splunk—signals a shift toward end-to-end suites that replace fragmented toolchains and embed predictive capabilities. Asia-Pacific sets the growth pace on the back of national cybersecurity programs and rapid digital-infrastructure roll-outs.
Key Report Takeaways
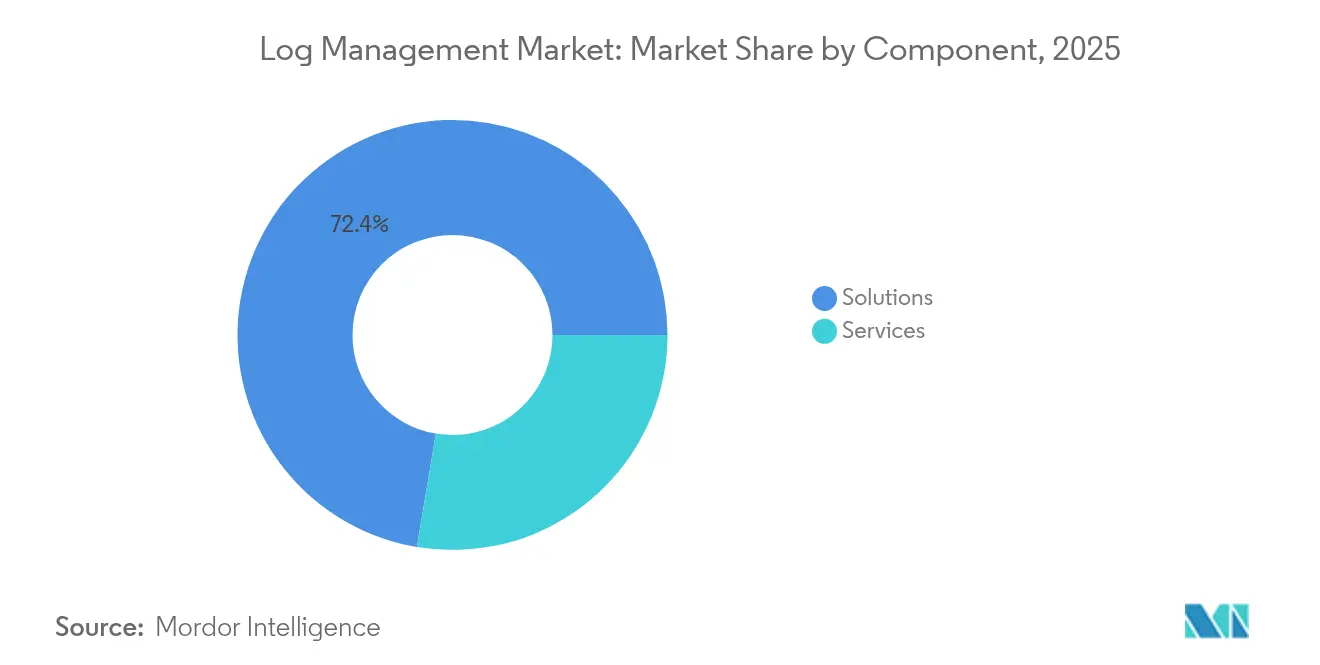
- By component, solutions held 72.35% of log management market share in 2025; services are projected to grow at a 16.55% CAGR through 2031.
- By deployment mode, cloud platforms represented 69.80% of 2025 revenue while expanding at an 18.25% CAGR to 2031.
- By enterprise size, large enterprises captured 61.55% of 2025 revenue, whereas SMEs are advancing at a 17.05% CAGR to 2031.
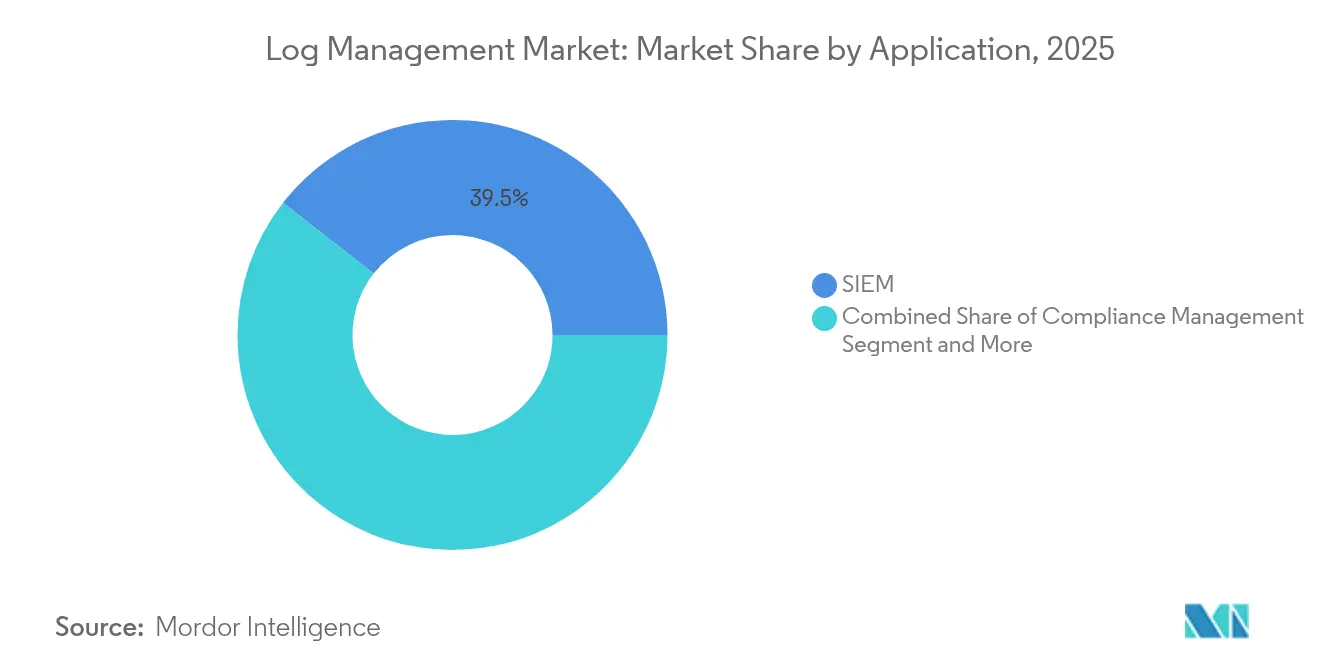
- By application, SIEM integration led with 39.45% of log management market size in 2025; end-to-end platforms are growing at a 16.95% CAGR.
- By industry, IT and Telecom commanded 28.10% of 2025 revenue, while Healthcare is forecast to post the fastest 17.95% CAGR to 2031.
- By geography, North America contributed 43.10% of 2025 revenue; Asia-Pacific is set to rise at a 18.70% CAGR over 2026-2031.
Note: Market size and forecast figures in this report are generated using Mordor Intelligence’s proprietary estimation framework, updated with the latest available data and insights as of 2026.
Global Log Management Market Trends and Insights
Drivers Impact Analysis*
| Driver | (~) % Impact on CAGR Forecast | Geographic Relevance | Impact Timeline |
|---|---|---|---|
| Increasing volume of log data | +3.2% | Global | Medium term (2-4 years) |
| Rapid adoption of cloud-based log management | +4.1% | North America and EU, Asia-Pacific adoption accelerating | Short term (≤ 2 years) |
| Stringent regulatory compliance and security mandates | +2.8% | Global, with concentration in North America and EU | Long term (≥ 4 years) |
| Generative-AI-driven observability reduces MTTR | +3.5% | North America and EU core, spill-over to Asia-Pacific | Medium term (2-4 years) |
| Edge and IoT proliferation creates distributed telemetry | +1.9% | Global, with early gains in Asia-Pacific manufacturing hubs | Long term (≥ 4 years) |
| FinOps convergence to optimize logging TCO | +1.8% | North America and EU enterprises, expanding globally | Short term (≤ 2 years) |
| Increasing volume of log data | +3.2% | Global | Medium term (2-4 years) |
| Source: Mordor Intelligence | |||
Rapid Adoption of Cloud-Based Log Management
Cloud-native platforms are replacing on-premises stacks because they compress, store, and query data at a fraction of legacy cost. Customers report 10-100× savings after shifting workloads to columnar engines such as ClickHouse, which delivers sub-second queries even at petabyte scale. Consumption pricing reinforces the case: Google Cloud’s log-specific tier now charges USD 0.50 per GB after a 50 GB free allowance, letting teams ingest more data without budget overruns.[1]Wasabi Technologies, “The True Cost of Cloud Storage for Log Retention,” wasabi.com As microservices multiply telemetry, elasticity ensures capacity is right-sized during peaks yet idle resources are avoided, pushing the log management market toward cloud preference.
Generative-AI-Driven Observability Reduces MTTR
Large-language-model add-ons let engineers convert plain-language questions into complex queries and receive prescriptive answers. Enterprises that deploy these features cut mean time to resolution from hours to under one minute, while achieving compression ratios near 169× by discarding noise with AI filters. Automated correlation across metrics, traces, and logs unlocks continuous improvement cycles and minimizes outage impact. As AI modules mature, they become core differentiators in the log management market rather than value-add options.
Stringent Regulatory Compliance and Security Mandates
OMB Memorandum M-21-31 forces every United States federal agency to reach intermediate log maturity within 18 months, providing a template many private firms adopt.[2]Executive Office of the President, “OMB Memorandum M-21-31: Improving the Nation’s Cybersecurity,” whitehouse.gov Healthcare providers must retain exhaustive audit trails to satisfy HIPAA rules, spurring hospitals and device makers to deploy enterprise-grade platforms. The upcoming EU AI Act introduces mandatory logging of algorithmic decisions, pushing multinationals to extend observability to AI pipelines. These overlapping mandates ensure the log management market maintains double-digit growth through 2030.
Edge and IoT Proliferation Creates Distributed Telemetry
Factories, vehicles, and smart cities now emit billions of events per day, overwhelming centralized pipelines. Vendors answer with edge collectors that pre-aggregate and filter data locally, cutting network overhead by sending only high-value events to the cloud. OpenTelemetry’s device-friendly SDKs standardize collection, while adaptive retention policies respect data-residency rules across jurisdictions. Edge-aware architectures have become decisive purchase criteria for global manufacturers and telcos selecting log management market platforms.
Restraints Impact Analysis*
| Restraint | (~) % Impact on CAGR Forecast | Geographic Relevance | Impact Timeline |
|---|---|---|---|
| High implementation and integration costs | -2.1% | Global, particularly affecting SMEs | Short term (≤ 2 years) |
| Data-privacy / data-residency concerns | -1.4% | EU and Asia-Pacific with strict data protection laws | Medium term (2-4 years) |
| Rising storage cost of long-term retention | -1.8% | Global, with higher impact in cloud-heavy regions | Long term (≥ 4 years) |
| Talent shortage in observability engineering | -2.3% | North America and EU, spreading to Asia-Pacific | Medium term (2-4 years) |
| Source: Mordor Intelligence | |||
Rising Storage Cost of Long-Term Retention
List prices for object storage have stagnated, yet add-on fees such as egress and API requests inflate real bills. Enterprises keeping petabytes of logs for multi-year compliance spend more than USD 1 million yearly even after compression.[3]Finout, “Google Cloud Announces Log-Specific Pricing,” finout.ioGDPR complicates cost-cutting: firms must retain certain datasets indefinitely while simultaneously minimizing personal data stored. To stay solvent, buyers favor engines that compress 15–20× and tier to cold archives without sacrificing analytics.
Talent Shortage in Observability Engineering
Nearly half of enterprises cite lack of skilled staff as the main hurdle to full observability, and only 10% achieve it. Specialists who can link telemetry to business KPIs are especially scarce, so 87% of organizations have formed platform-engineering squads to package best practices. Demand for managed services rises in parallel, explaining the 16.90% services CAGR embedded in the log management market forecast.
*Our forecasts treat driver/restraint impacts as directional, not additive. The impact forecasts reflect baseline growth, mix effects, and variable interactions.
Segment Analysis
By Component: Solutions Dominate Enterprise Investments
Solutions generated 72.35% of 2025 revenue, illustrating buyer preference for unified suites that bundle ingestion, analytics, and retention. Cisco’s integration of Splunk after its USD 28 billion deal exemplifies how vendors package security analytics, observability, and networking in one stack. Services are growing at a 16.55% CAGR because enterprises need advisory support to configure AI modules, tune storage tiers, and align deployments with compliance checkpoints.
The solutions wave also reflects board-level pressure to rationalize tool sprawl. Platforms that converge SIEM and observability shrink license counts and standardize data models, easing collaboration between security and DevOps teams. Services revenue gains stem from migration projects, ongoing optimization, and managed detection and response offerings that offset the observability talent gap.


By Deployment Mode: Cloud Platforms Reshape Infrastructure
Cloud options held 69.80% share in 2025 and are projected to post an 18.25% CAGR through 2031, the steepest among all modes. Consumption pricing, elastic scale, and instant global coverage outweigh lingering concerns about latency or sovereignty. When traffic spikes during incidents, capacity scales in seconds, protecting service-level objectives without long-term capital expense.
On-premises deployments persist in finance and government circles where data cannot cross borders. Hybrid models let sensitive logs stay onsite while analytics run on cloud engines. Vendors that offer transparent migration paths and unified control planes stand to capture incremental log management market share as regulations soften and encryption confidence rises.
By End-user Enterprise Size: SMEs Drive Democratization
Large enterprises accounted for 61.55% of 2025 spending, underpinning the log management market size through hefty multiyear licenses and add-ons. Their complex estates demand AI-based correlation across thousands of services. Yet SMEs are the fastest growers at a 17.05% CAGR because SaaS delivery removes infrastructure chores and pay-as-you-go tiers lower entry cost.
SMEs favor opinionated defaults, automated dashboards, and turnkey compliance packs. Vendors responding with simplified onboarding, per-GB pricing, and community templates unlock a vast greenfield. As more mid-market firms adopt DevSecOps practices, they narrow the historical capability gap with global conglomerates, broadening the addressable log management market.
By Application: SIEM Integration Drives Convergence
Security Information and Event Management claimed 39.45% of 2025 revenue, reflecting regulatory pressure for real-time threat detection. Coupling SIEM and observability gives security teams context previously siloed in IT operations tools. End-to-end observability platforms are expanding at a 16.95% CAGR because buyers want a single schema for logs, metrics, traces, and alerts, reducing swivel-chair fatigue.
Compliance reporting remains steady thanks to mandates like PCI DSS 4.0, while Application Performance Monitoring sustains a loyal user base optimizing latency and customer experience. Vendors winning share embed security analytics natively rather than through bolt-ons, ensuring the combined log management market size for SIEM and observability grows faster than either domain alone.
Segment 5
IT and Telecom delivered 28.10% of 2025 revenue as carriers and hyperscalers baked observability into always-on service models. Healthcare shows the highest 17.95% CAGR because HIPAA demands exhaustive logging and device telemetry is exploding as hospitals digitize equipment.
BFSI retains high spend due to fraud analytics and transaction forensics. Retail and e-commerce deploy log analytics to thwart bots and personalize experiences, while government modernization programs lift demand for FedRAMP-authorized platforms. Together, these verticals push vendors to create domain-specific rule packs and reporting templates that accelerate time to value across the log management market.
Geography Analysis
North America contributed 43.10% of 2025 revenue, underpinned by Fortune 500 roll-outs and federal logging mandates such as OMB M-21-31 that standardize telemetry formats. Consolidation—most notably Cisco’s Splunk acquisition—further entrenches platform deployments by bundling observability into broader network contracts. Continuous AI upgrades keep the region on a steady but not explosive path as most large enterprises have already adopted baseline solutions.
Asia-Pacific is the clear growth engine, advancing at a 18.70% CAGR through 2031 as India, China, Japan, and ASEAN economies digitize supply chains and public services. National cybersecurity acts and data-localization laws compel local logging, while rising cyber-incident volume—31% of global total in 2022—raises urgency. Domestic cloud providers partner with global vendors to host regional transit points, overcoming sovereignty hurdles and expanding the log management market footprint.
Europe sustains mid-teens growth anchored to GDPR’s audit-trail demands and the impending EU AI Act. Hybrid deployments flourish because firms keep raw data inside EU borders yet push analytics to zone-restricted clouds. South America and Middle East and Africa remain emerging segments; economic conditions slow adoption, but modernization programs and vendor partnerships lay groundwork for future gains.

Competitive Landscape
Competition intensified after two headline mergers reshaped the field. Cisco fused networking, security, and observability by acquiring Splunk for USD 28 billion, promising unified dashboards and lower integration friction. LogRhythm and Exabeam merged in February 2025, pooling UEBA and SIEM strengths into an AI-first operations vector. These moves encourage rivals to enhance automation features and expand ecosystem plug-ins to protect share.
Differentiation now pivots on generative AI. Vendors embed chat-style assistants that write queries, surface anomalies, and suggest remediations. Edge-focused newcomers such as Observo AI process 100 PB monthly with cost-aware pipelines that drop duplicate data before shipping to the cloud, capturing price-sensitive workloads. Incumbents counter by launching cold-storage tiers, unlimited ingest bundles, and service credits to blunt the rising storage-cost restraint.
Partner ecosystems also matter. Cloud hyperscalers certify third-party agents and offer marketplace incentives, while MSSPs bundle managed detection and response with log analytics for customers lacking staff. Vendor viability increasingly hinges on an ability to span the full lifecycle—collection, enrichment, analytics, retention, and governance—within a coherent single-pane experience that drives the log management market forward.
Log Management Industry Leaders
Splunk Inc.
IBM Corporation
Datadog Inc.
Elastic NV
LogRhythm Inc.
- *Disclaimer: Major Players sorted in no particular order

Recent Industry Developments
- February 2025: LogRhythm and Exabeam merged to form a unified AI-driven security-operations company.
- May 2024: Sumo Logic expanded AI and security-analytics features for its SaaS platform, supporting DevSecOps alignment.
- March 2024: Cisco closed its USD 28 billion Splunk acquisition, creating an integrated security and observability platform.
- March 2024: Sumo Logic launched Flex Licensing that offers free unlimited ingest with AI-based analytics.


Research Methodology Framework and Report Scope
Market Definitions and Key Coverage
Our study defines the log management market as the aggregated spending on software platforms and related services that collect, index, store, analyze, and visualize log events originating from applications, infrastructure, security systems, and public-cloud resources. Only licensed solutions and fee-based managed log monitoring, whether deployed on-premise or in multi-tenant clouds, are counted; free and community editions are excluded.
Scope Exclusion: Tools devoted solely to APM metrics, packet capture, or general data warehousing without purpose-built log parsers lie outside this market.
Segmentation Overview
- By Component
- Solutions
- Services
- By Deployment Mode
- Cloud
- On-premises
- By End-user Enterprise Size
- Large Enterprises
- Small and Medium-sized Enterprises (SMEs)
- By Application
- Security Information and Event Management (SIEM)
- Compliance Management
- Application Performance Monitoring (APM)
- End-to-End Log Management Platforms
- By End-user Industry
- IT and Telecom
- BFSI
- Healthcare and Life Sciences
- Retail and E-commerce
- Education
- Government and Public Sector
- Others
- By Geography
- North America
- United States
- Canada
- Mexico
- South America
- Brazil
- Argentina
- Rest of South America
- Europe
- United Kingdom
- Germany
- France
- Italy
- Spain
- Russia
- Rest of Europe
- Asia-Pacific
- China
- India
- Japan
- South Korea
- Australia and New Zealand
- Southeast Asia
- Rest of Asia-Pacific
- Middle East and Africa
- Middle East
- Saudi Arabia
- United Arab Emirates
- Turkey
- Rest of Middle East
- Africa
- South Africa
- Nigeria
- Kenya
- Rest of Africa
- Middle East
- North America
Detailed Research Methodology and Data Validation
Primary Research
Mordor analysts interviewed SecOps leads, cloud architects, and managed detection providers across North America, Europe, and Asia. These discussions verified log-volume growth rates, typical per-node pricing, and the speed at which AI-assisted triage is cutting mean-time-to-resolution. Follow-up surveys with mid-market IT managers helped adjust SME adoption curves and license-mix assumptions.
Desk Research
We launched our desk work by extracting usage metrics, host counts, and compliance filings from open security advisories, NIST's National Vulnerability Database, and ENISA breach notifications, which ground volume assumptions for enterprise log flows. Trade bodies such as the Cloud Security Alliance, the Uptime Institute, and the Payment Card Industry Council publish adoption ratios and prescribed retention periods that clarify demand inflections. Patent families retrieved through Questel guided understanding of emerging Gen-AI log correlation techniques, while D&B Hoovers and 10-K filings supplied revenue guardrails for leading vendors. News archives from Dow Jones Factiva added deal values and customer counts for triangulation. This list is illustrative; many additional public datasets and specialty publications informed source validation and context building.
The second sweep focused on shipment and workload indicators. We parsed quarterly CSP transparency reports, regional telecom traffic statistics, and IDC server shipments to anchor the addressable node base. Regulatory portals, including HIPAA's breach log and the EU's GDPR fines register, revealed compliance-driven spending spikes, which sharpened our temporal splits.
Market-Sizing & Forecasting
A top-down construct begins with our database of enterprise servers, containers, and edge devices; applying region-specific log generation factors and observed paid-solution penetration yields the demand pool, which is then cross-checked through selective bottom-up roll-ups of vendor bookings and sampled average selling prices. Key model drivers include: 1) average daily log volume per workload, 2) share of logs streamed to paid platforms versus open tools, 3) regulatory retention length, 4) cloud workload growth, and 5) price compression on tiered storage. Forecasts use multivariate regression that links spending to the above indicators while embedding scenario analysis for AI adoption shocks. Data gaps in supplier roll-ups are bridged with weighted channel checks and modest imputation rather than full extrapolation.
Data Validation & Update Cycle
Outputs pass a two-level analyst review, variance checks against fresh CSP billing data, and year-over-year trend consistency tests. Reports refresh annually; interim pulses occur when M&A of $1 billion-plus or new compliance mandates materially shift market dynamics.
Why Mordor's Log Management Baseline Stands Firm
Published values often diverge because firms pick different inclusion rules, baseline years, and currency conversions. Our disciplined scope and yearly refresh ensure buyers receive a number that mirrors real purchase behavior, not merely license lists.
Key gap drivers are usually narrower component coverage, omission of managed services, or reliance on historic revenues without validating current log-volume inflation.
Benchmark comparison
| Market Size | Anonymized source | Primary gap driver |
|---|---|---|
| USD 3.76 B (2025) | Mordor Intelligence | - |
| USD 3.27 B (2024) | Regional Consultancy A | Older baseline and limited service revenue captured |
| USD 2.85 B (2025) | Global Consultancy A | Revenue-only top-down, excludes cloud-native add-ons |
| USD 3.10 B (2024) | Trade Journal B | No application granularity; static FX assumptions |
These contrasts show that Mordor's blended approach, anchored to device-level demand and validated by primary checks, delivers a balanced, transparent baseline clients can replicate and trust.


Key Questions Answered in the Report
What is the current size of the log management market?
The log management market stands at USD 4.35 billion in 2026 and is projected to reach USD 8.99 billion by 2031.
Which deployment mode is growing fastest?
Cloud deployment leads growth with an 18.25% CAGR due to elastic scale and consumption pricing.
Why is healthcare the fastest-growing industry vertical?
Strict HIPAA audit requirements and the surge in connected medical devices push healthcare log volumes, resulting in an 17.95% CAGR.
How is generative AI changing log management?
Large-language-model features automate root-cause analysis, reducing mean time to resolution from hours to under one minute.
Page last updated on:


