Petrochemical & Chemical NDT Market Size and Share
Market Overview
| Study Period | 2019 - 2030 |
|---|---|
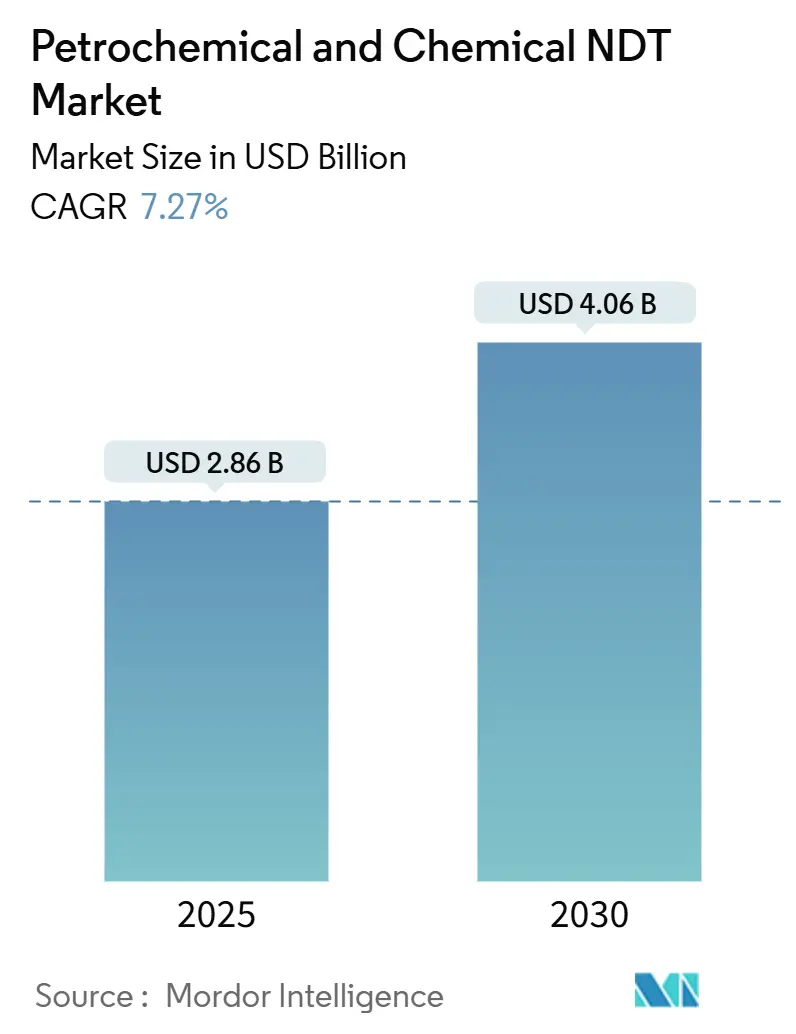
| Market Size (2025) | USD 2.86 Billion |
| Market Size (2030) | USD 4.06 Billion |
| Growth Rate (2025 - 2030) | 7.27% CAGR |
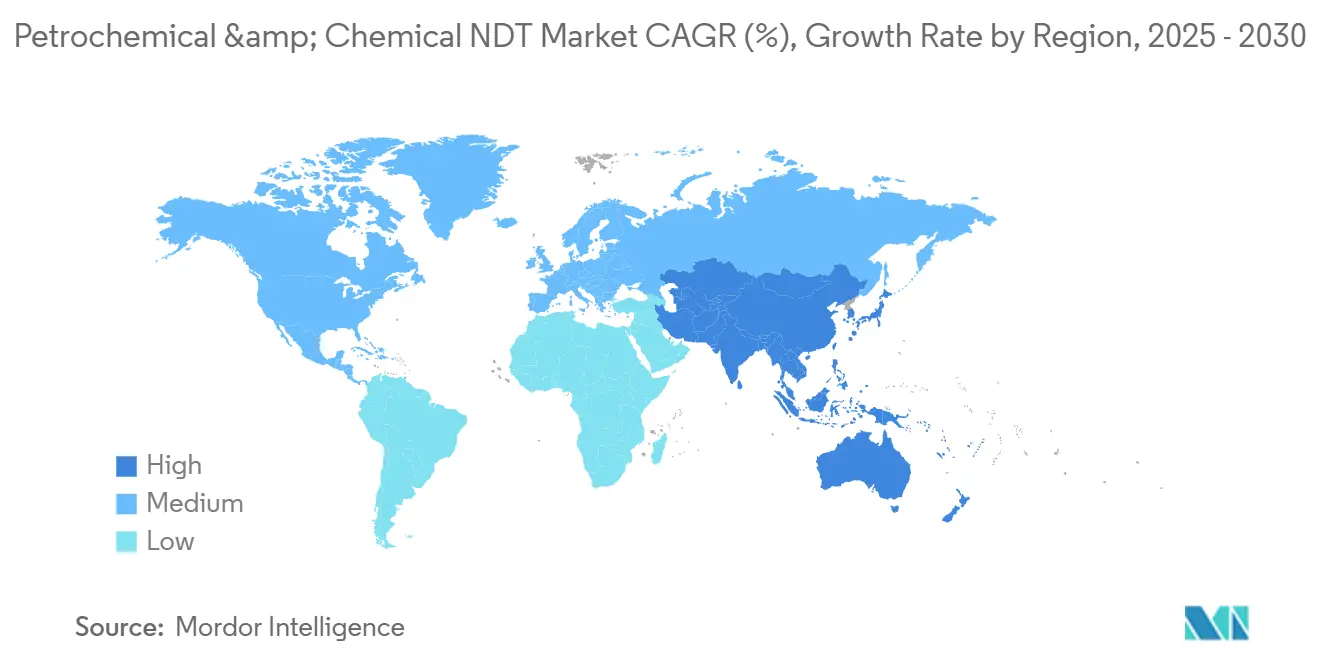
| Fastest Growing Market | Asia Pacific |
| Largest Market | Asia Pacific |
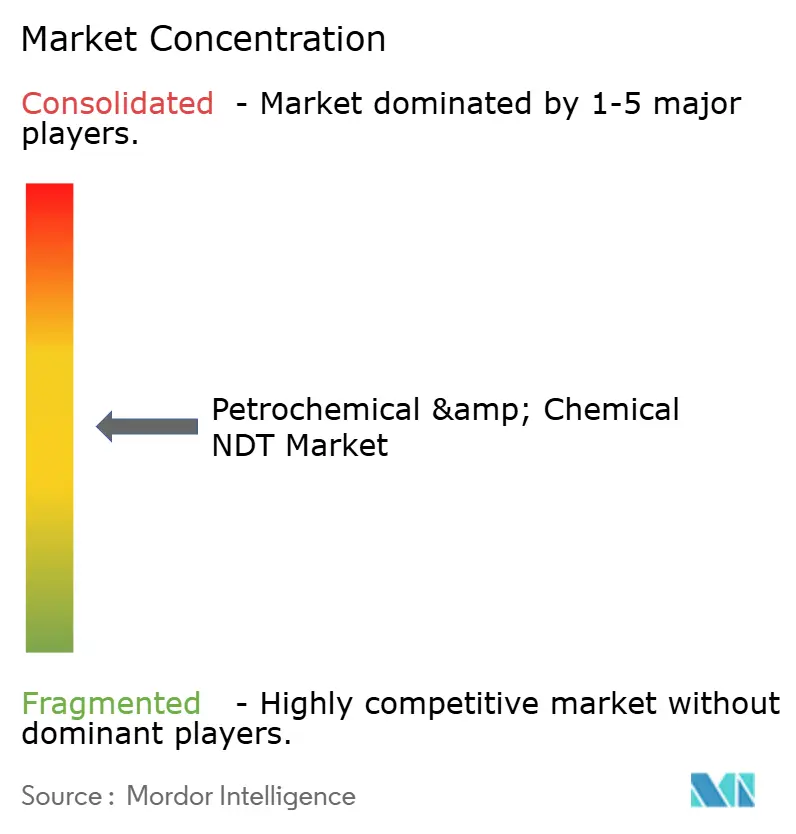
| Market Concentration | Medium |
Major Players *Disclaimer: Major Players sorted in no particular order Image © Mordor Intelligence. Reuse requires attribution under CC BY 4.0. | |
Petrochemical & Chemical NDT Market Analysis by Mordor Intelligence
The petrochemical and chemical NDT market size reached USD 2.86 billion in 2025 and is projected to advance to USD 4.06 billion by 2030 at a 7.27% CAGR. This expansion mirrors operators’ shift from reactive maintenance to predictive integrity programs, the rapid digitalization of inspection workflows, and regulatory frameworks that mandate more frequent, data-rich tests. Services remain the economic engine, capturing 79.8% revenue in 2024, while software accelerates as the digital control hub for inspection data. Ultrasonic testing retains its primacy due to its versatility, yet eddy-current and other advanced methods are gaining a share in corrosion-critical assets. Conventional techniques dominate volumes, but AI-enabled analytics are scaling rapidly, signaling an inflection point toward intelligent inspections that reduce downtime, shorten defect-finding cycles, and enhance safety across refineries worldwide. The Asia-Pacific region leads value demand, supported by aggressive capacity additions and stringent operating norms that drive the double-digit adoption of automated inspection robots and digital twin platforms.
Key Report Takeaways
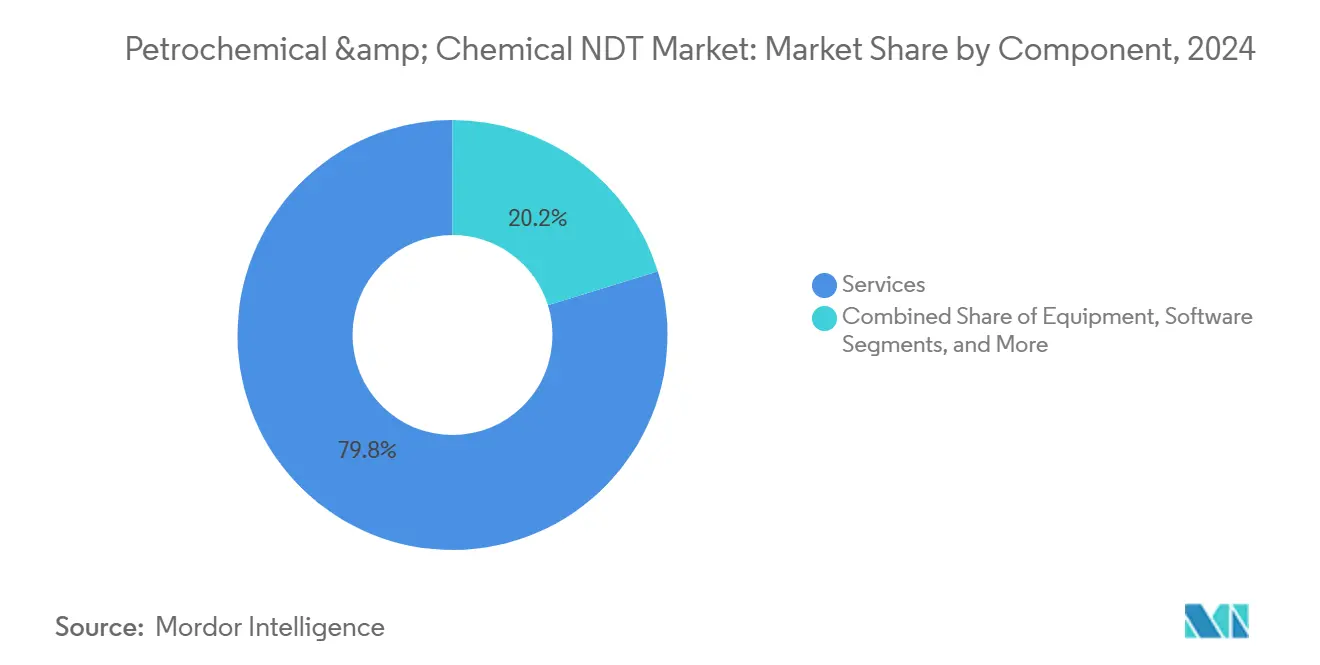
- By component, services led the petrochemical and chemical NDT market, accounting for a 79.8% share in 2024.
- By component, software is projected to post the fastest growth rate of 11.3% through 2030.
- By testing method, ultrasonic testing held a 28.5% share of the petrochemical and chemical NDT market size in 2024, and eddy-current testing is projected to advance at an 8.3% CAGR through 2030.
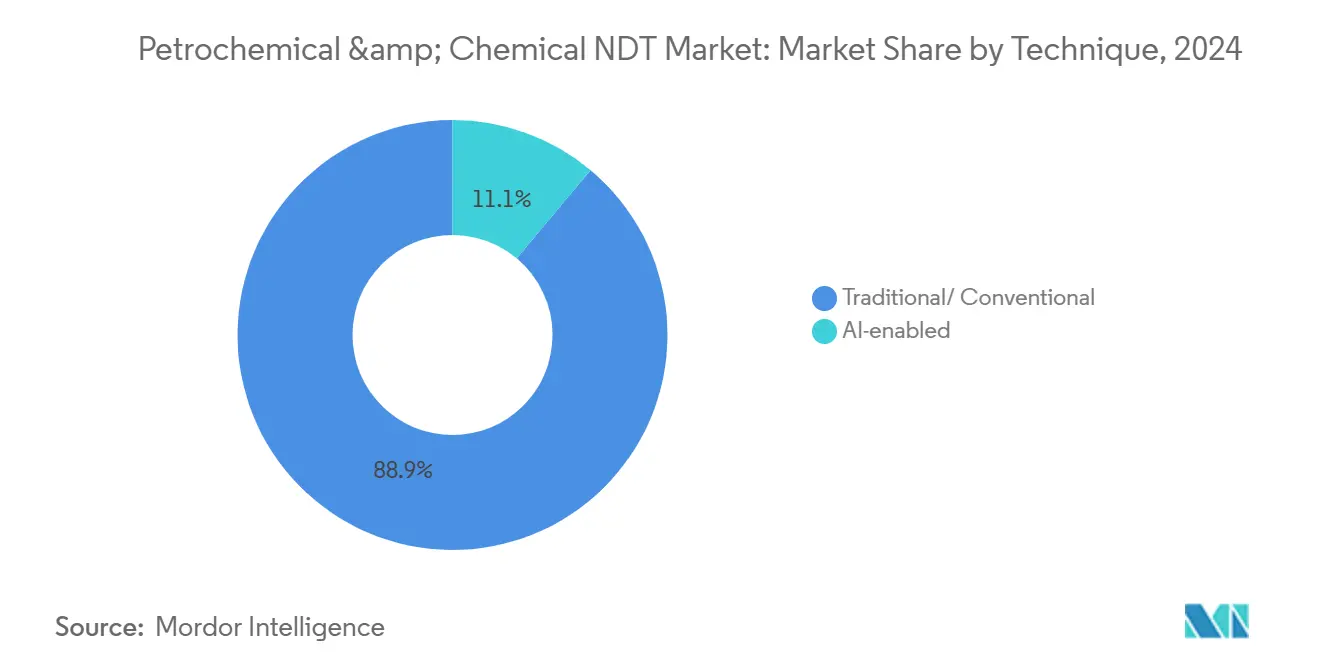
- By technique, AI-enabled solutions are forecast to grow at a 14.4% CAGR through 2030.
- By geography, the Asia-Pacific region commanded 37.1% of the revenue in 2024 and is expected to expand at a 7.8% CAGR through 2030.
Global Petrochemical & Chemical NDT Market Trends and Insights
Drivers Impact Analysis*
| Driver | (~) % Impact on CAGR Forecast | Geographic Relevance | Impact Timeline |
|---|---|---|---|
| Rising replacement of scheduled shutdowns with condition-based maintenance programs | +1.8% | Global, with early adoption in North America and Europe | Medium term (2-4 years) |
| Mandatory inspection frequencies set by OSHA, API, and EU-OSHA directives | +1.2% | North America and Europe, expanding to the Asia-Pacific | Long term (≥ 4 years) |
| Growing deployment of automated corrosion-mapping robots in refineries | +0.9% | Global, concentrated in advanced refining markets | Short term (≤ 2 years) |
| Expansion of greenfield petrochemical capacity in the Middle East and Asia-Pacific | +0.7% | Middle East and Asia-Pacific core, spillover to global markets | Long term (≥ 4 years) |
| Adoption of digital twin-based integrity management platforms | +0.6% | Global, with early gains in digitally mature markets | Medium term (2-4 years) |
| Increase in carbon-capture and hydrogen retrofits requiring new NDT protocols | +0.5% | North America and Europe, expanding to the Asia-Pacific | Long term (≥ 4 years) |
| Source: Mordor Intelligence | |||
Rising Replacement of Scheduled Shutdowns With Condition-Based Maintenance Programs
Global refiners are phasing out fixed-interval turnarounds in favor of data-driven inspections that baseline condition and trigger repairs only when risk crosses a preset threshold. At Saudi Aramco’s Ras Tanura site, the adoption of a digital twin, combined with continuous ultrasonic readings, resulted in a 15% reduction in unplanned outages while extending run lengths up to 18 months.[1]Saudi Aramco, “Digital Transformation and Industry 4.0 Implementation,” aramco.com These gains cut deferred production costs and free capital for asset upgrades. Adoption demands dense, high-resolution data that only advanced acoustic emission, phased-array UT, and permanent monitoring sensors can deliver. OEMs and service firms, therefore, see a rise in orders for automated scanners that can climb towers and map wall loss in real-time. Regulators are gradually accepting risk-based methodologies, provided that operators document equal or higher safety margins, ensuring steady revenue for vendors who integrate compliance reporting into their analytics suites.
Mandatory Inspection Frequencies Set by OSHA, API, and EU-OSHA Directives
Legal mandates underpin baseline demand regardless of oil price cycles. API 570 requires external piping exams at least every 5 years and stipulates internal intervals tied to corrosion rates, forcing operators to schedule work scopes well in advance. OSHA’s Process Safety Management rule compels certified integrity checks on pressure vessels containing highly hazardous chemicals, while the EU-OSHA Seveso III Directive imposes parallel obligations for European complexes. Recent revisions encourage advanced techniques such as phased-array UT and high-energy computed radiography to support API 579 fitness-for-service assessments. Because penalties for non-compliance can halt plant operations, asset owners consistently allocate budget to inspections, providing an embedded revenue floor for the petrochemical and chemical NDT market.
Growing Deployment of Automated Corrosion-Mapping Robots in Refineries
Magnetic crawler robots equipped with multi-channel UT arrays are revolutionizing the wall-thickness inspection of tanks, spheres, and large-diameter piping. ARIX Technologies’ VENUS platform captured full-surface A-scan data across 18 storage tanks in a Southeast Asian refinery, trimming a planned 15-day shutdown by six days while mapping corrosion with millimeter accuracy.[2]ARIX Technologies, “VENUS Automated Inspection Platform Deployment Results,” arix.com Robots slash human entry in confined spaces, improve data repeatability, and stream inspection records directly to cloud analytics dashboards. Payback periods have fallen below two years at many sites, motivating broader adoption even among mid-tier operators. As providers bundle robots with software subscriptions, recurring revenue grows, and technician shortages are partially offset.
Expansion of Greenfield Petrochemical Capacity in the Middle East and Asia-Pacific
ADNOC’s Borouge upgrade will lift polyolefin output to 6.6 million tpa by 2028 and is forecast to deliver AED 600-730 million (USD 163-199 million) incremental EBITDA, all contingent on rigorous phased testing of new reactors, exchangers, and high-pressure lines. Similar mega-projects in China and India each require baseline radiography, hydrostatic, and ultrasonic examinations during fabrication and commissioning, followed by a transition to risk-informed routines once operational. The concentration of capital investments fuels demand for service hubs near project clusters, encouraging global NDT majors to form joint ventures with regional contractors and train local inspectors to codified standards.
Restraints Impact Analysis*
| Restraint | (~) % Impact on CAGR Forecast | Geographic Relevance | Impact Timeline |
|---|---|---|---|
| Shortage of qualified ASNT Level-III inspectors | -1.1% | Global, acute in Asia-Pacific and the Middle East | Long term (≥ 4 years) |
| High capital cost of phased-array UT and CT scanners | -0.8% | Global, particularly impacting smaller service providers | Medium term (2-4 years) |
| Data privacy concerns are limiting cloud-based NDT analytics | -0.6% | Global, with heightened sensitivity in Europe and North America | Medium term (2-4 years) |
| Lack of harmonized standards for AI-enabled defect classification | -0.4% | Global, with varying regulatory approaches across regions | Long term (≥ 4 years) |
| Source: Mordor Intelligence | |||
Shortage of Qualified ASNT Level-III Inspectors
ASNT Level-III certification requires up to a decade of progressive field experience, along with mastery of multiple methods; however, retirements now outpace new entrants, especially in the fast-growing Asia-Pacific markets.[3]American Society for Nondestructive Testing, “ASNT Level-III Certification Requirements,” asnt.org The scarcity inflates day-rates and elongates turnaround windows. Operators offset risk by funding accelerated training programs and adopting automated acquisition systems that let fewer experts oversee more data. Vendors who embed AI-driven flaw screening reduce the workload placed on senior reviewers, but the talent gap persists and caps service throughput during peak outages.
High Capital Cost of Phased-Array UT and CT Scanners
High-energy CT setups exceed USD 400,000 for top-tier configurations, and phased-array UT sets average USD 40,000-60,000 per station, straining the balance sheets of smaller service firms. Although leasing models spread payments, utilization must remain high to break even, favoring large players that can redeploy assets across continents. As clients add AI and 3-D imaging specifications to bid lists, providers that delay upgrades risk disqualification. Capital intensity, therefore, accelerates consolidation, mirroring SGS’s USD 1.325 billion acquisition of ATS in 2025 that instantly broadened its automated UT fleet.
*Our forecasts treat driver/restraint impacts as directional, not additive. The impact forecasts reflect baseline growth, mix effects, and variable interactions.
Segment Analysis
By Component – Services Remain the Revenue Backbone While Software Escalates Digital Value
Services accounted for 79.8% of the petrochemical and chemical NDT market revenue in 2024 as refinery and chemical owners turned to certified contractors for on-site scans, data interpretation, and compliance documentation. The petrochemical and chemical NDT market size for services is projected to grow steadily alongside capital projects, while scalability stems from long-term integrity management contracts that index fees to asset counts. Labor intensity ensures that expert availability, certification depth, and safety records remain key competitive levers. MISTRAS Group booked USD 15.571 million from petrochemical inspections in 2024, underscoring the potential scale of its services.
Software revenue is currently smaller, but it is expected to accelerate at an 11.3% CAGR through 2030 as operators transition data from spreadsheets to cloud platforms that unify ultrasonic, radiography, and acoustic feeds. AI engines mine historical runs, predict defect propagation, and automate report generation, tightening the feedback loop between inspection and maintenance. Vendors are increasingly bundling licenses with hardware, ensuring recurring margins and fostering long-term customer relationships. Equipment upgrades persist as phased-array UT, high-energy CT, and thermography systems replace legacy gear, while consumables such as penetrants and magnetic particles rise in lockstep with field activity but remain a modest share of total spend.


By Testing Method – Ultrasonic Dominance Faces Niche Erosion From Advanced Techniques
Ultrasonic testing generated 28.5% of the revenue in 2024 due to its flexibility for thickness gauging, weld inspection, and crack sizing across carbon steel and low-alloy equipment. High scan speed, portability, and repeatability solidify its role, and advanced modes, such as phased-array and full-matrix capture, extend its capability to complex geometries. Eddy-current testing, although holding a smaller share, is growing at an 8.3% CAGR, driven by heat-exchanger tube inspections where ferritic materials are rare. Radiography maintains a stronghold in volumetric weld acceptance, particularly in high-pressure hydroprocessing units, whereas thermography and acoustic emission serve the niches of rapid screening or real-time monitoring.
The method mix is widening. Computed tomography addresses intricate castings and additive parts used in specialty chemical plants, providing 3D reconstructions that expedite defect root-cause diagnostics. Guided-wave UT screens long pipe runs and insulated lines with minimal scaffolding. As inspection regimes become risk-based, owners deploy complementary techniques, selecting the most cost-effective method that satisfies probability-of-detection targets and regulatory expectations.
By Technique – Conventional Workhorses Persist, AI-Enabled Analytics Accelerate
Traditional approaches still accounted for 88.9% of the 2024 volume, reflecting the entrenched nature of these procedures and the familiarity of auditors with them. Yet AI-enabled solutions are forecast to post a 14.4% CAGR, adding automated crack classification, noise-reduction algorithms, and predictive models that forecast remaining life. Early adopters feed terabytes of phased-array B-scan data into cloud engines that identify hotspots, ranking components by failure likelihood, and prioritizing worklists. Regulatory bodies are beginning to draft acceptance criteria for machine learning outputs, a precursor to wider rollout. The petrochemical and chemical NDT market will likely settle on hybrid schemes where machine intelligence filters data and human inspectors validate critical findings to maintain insurance and legal defensibility.
Geography Analysis
The Asia-Pacific region accounted for 37.1% of the 2024 spend, driven by new cracker builds in China, India, and Southeast Asia that incorporate advanced NDT specifications from the design stage forward. The region’s 7.8% CAGR is based on two pillars: greenfield mega-projects, such as the 1.8 million tpa Yasref steam cracker in Saudi-backed joint ventures, and an aging portfolio of first-wave refineries now approaching major overhaul windows. Digital twin pilots in Singapore and South Korea are accelerating the adoption of continuous thickness monitoring and remote defect verification, driving demand for high-volume data platforms.
North America remains a technology leader, leveraging OSHA-driven compliance budgets and robust reliability cultures. U.S. Gulf Coast operators are early buyers of automated crawlers for large petrochemical spheres, and Canadian oil sands sites invest in high-temperature UT sensors to monitor coke-lined upgraders in real time. Europe balances mature asset bases with the Green Deal’s decarbonization agenda, channeling capital into hydrogen and carbon-capture retrofits that require fresh inspection protocols. The Middle East’s integrated refining-petrochemical complexes, financed by sovereign funds, demand top-tier NDT scopes during construction and condition monitoring thereafter, opening local training markets in the United Arab Emirates, Saudi Arabia, and Oman.
Africa and South America are emerging as promising areas, as downstream gas expansion in Egypt and ethylene cracker projects in Brazil enter the FEED phase. Local providers are forming partnerships with international majors to upskill inspectors to Level II and Level III status, ensuring future service resiliency.

Competitive Landscape
The market is moderately fragmented. Top global firms include MISTRAS Group, SGS, Applus Services, TUV Rheinland, and Element Materials Technology, each holding multi-regional networks and broad method portfolios. Mid-tier specialists focus on robotics, automated UT, or cloud analytics. Consolidation gathered pace in 2024-2025, highlighted by SGS’s USD 1.325 billion ATS acquisition that bolstered its phased-array fleet, and Apave’s purchase of IRISNDT, adding USD 300 million of annual revenue.[4]SGS, “ATS Acquisition Announcement and Strategic Rationale,” sgs.com These moves underscore a core theme: scale plus technology integration creates margin defense and cross-selling potential.
Technology disruptors target pain points like inspector scarcity and data overload. Start-ups deploy AI-as-a-service platforms that classify defects in minutes, while robotics firms supply crawlers capable of 24-hour tank scans. Established leaders respond by embedding sensors into permanent monitoring networks and offering outcome-based contracts that align fees with uptime or failure-rate metrics. Certification rigor and safety records remain entry barriers, yet customer loyalty is increasingly tied to data transparency, report turnaround, and predictive accuracy.
Looking ahead, winners will combine asset-agnostic software, multi-sensor hardware suites, and global teams of certified engineers. Clients will favor providers who can support greenfield commissioning, deliver routine risk-based inspections, and feed live condition data into digital twins that link asset health to production scheduling.
Petrochemical & Chemical NDT Industry Leaders
MISTRAS Group Inc.
SGS SA
Eddyfi Technologies
Bureau Veritas SA
Evident (Olympus Corporation)
- *Disclaimer: Major Players sorted in no particular order

Recent Industry Developments
- July 2025: SGS completed its USD 1.325 billion acquisition of ATS, significantly expanding inspection reach and adding advanced automation platforms.
- March 2025: Institut Dr. Foerster acquired Prüftechnik NDT GmbH, deepening ultrasonic and eddy-current portfolios for German chemical plants.
- February 2025: USA DeBusk acquired CIMA Inspection, enhancing high-temperature UT competencies across North American refineries.
- December 2024: EKOSCAN acquired Nortech, broadening European robotic inspection coverage.


Global Petrochemical & Chemical NDT Market Report Scope
| Equipment |
| Software |
| Services |
| Consumables |
| Ultrasonic Testing |
| Radiographic Testing |
| Magnetic Particle Testing |
| Liquid Penetrant Testing |
| Visual Inspection Testing |
| Eddy-Current Testing |
| Acoustic Emission Testing |
| Thermography / Infrared Testing |
| Computed Tomography Testing |
| Traditional / Conventional |
| AI-enabled |
| North America | United States |
| Canada | |
| Mexico | |
| South America | Brazil |
| Argentina | |
| Rest of South America | |
| Europe | Germany |
| United Kingdom | |
| France | |
| Italy | |
| Spain | |
| Rest of Europe | |
| Asia Pacific | China |
| Japan | |
| India | |
| South Korea | |
| South-East Asia | |
| Rest of Asia Pacific | |
| Middle East | Saudi Arabia |
| United Arab Emirates | |
| Turkey | |
| Rest of Middle East | |
| Africa | South Africa |
| Nigeria | |
| Rest of Africa |
| By Component | Equipment | |
| Software | ||
| Services | ||
| Consumables | ||
| By Testing Method | Ultrasonic Testing | |
| Radiographic Testing | ||
| Magnetic Particle Testing | ||
| Liquid Penetrant Testing | ||
| Visual Inspection Testing | ||
| Eddy-Current Testing | ||
| Acoustic Emission Testing | ||
| Thermography / Infrared Testing | ||
| Computed Tomography Testing | ||
| By Technique | Traditional / Conventional | |
| AI-enabled | ||
| By Geography | North America | United States |
| Canada | ||
| Mexico | ||
| South America | Brazil | |
| Argentina | ||
| Rest of South America | ||
| Europe | Germany | |
| United Kingdom | ||
| France | ||
| Italy | ||
| Spain | ||
| Rest of Europe | ||
| Asia Pacific | China | |
| Japan | ||
| India | ||
| South Korea | ||
| South-East Asia | ||
| Rest of Asia Pacific | ||
| Middle East | Saudi Arabia | |
| United Arab Emirates | ||
| Turkey | ||
| Rest of Middle East | ||
| Africa | South Africa | |
| Nigeria | ||
| Rest of Africa | ||


Key Questions Answered in the Report
What is the current value of the petrochemical and chemical NDT market?
The petrochemical and chemical NDT market size stood at USD 2.86 billion in 2025.
How fast is global demand growing for petrochemical integrity inspections?
The market is forecast to expand at a 7.27% CAGR through 2030 as owners move toward predictive maintenance.
Which component is growing fastest in inspection programs?
Software is projected to grow at an 11.3% CAGR, driven by the adoption of analytics and digital twins.
Why does Asia-Pacific lead spending on nondestructive testing?
The aggressive capacity build in China, India, and Southeast Asia requires baseline inspections and ongoing monitoring, which will give the region a 37.1% share in 2024.
Which testing method dominates refinery inspections?
Ultrasonic testing remains the top choice with a 28.5% share in 2024, due to its versatility in examining thickness and welds.
What technology trend is reshaping inspection workflows?
AI-enabled analytics combined with robotic scanners are reducing cycle time and improving defect detection accuracy across global sites.
Page last updated on:


