NDT Services Market Size and Share
Market Overview
| Study Period | 2019 - 2030 |
|---|---|
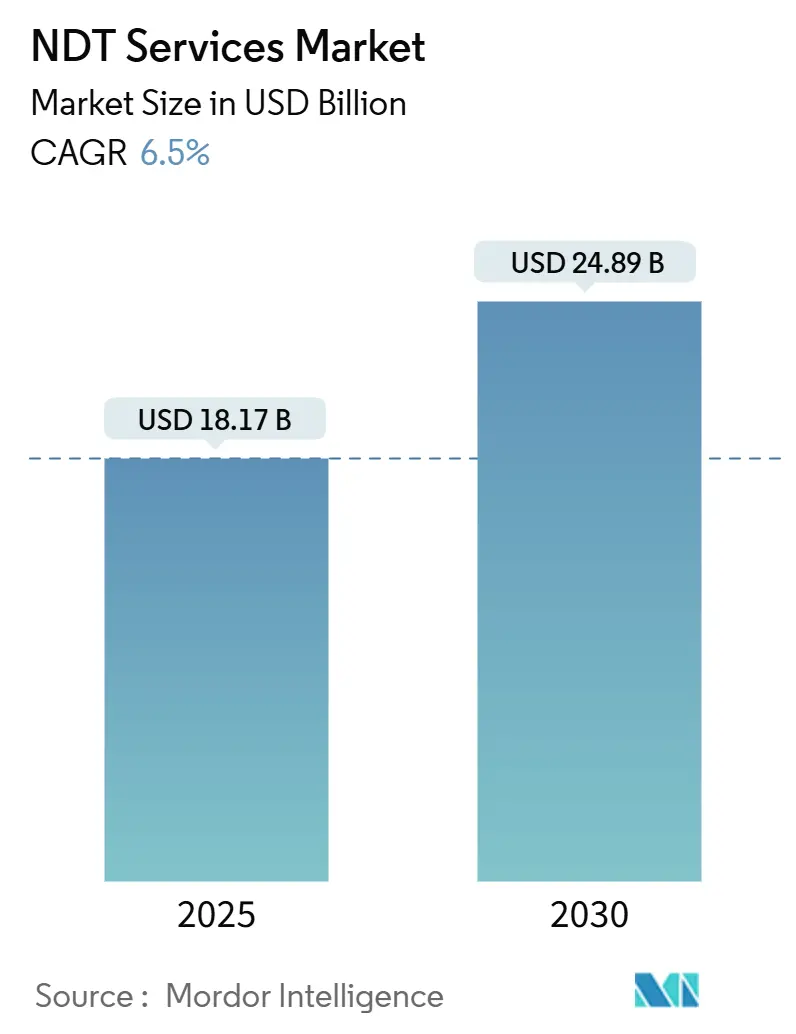
| Market Size (2025) | USD 18.17 Billion |
| Market Size (2030) | USD 24.89 Billion |
| Growth Rate (2025 - 2030) | 6.50% CAGR |
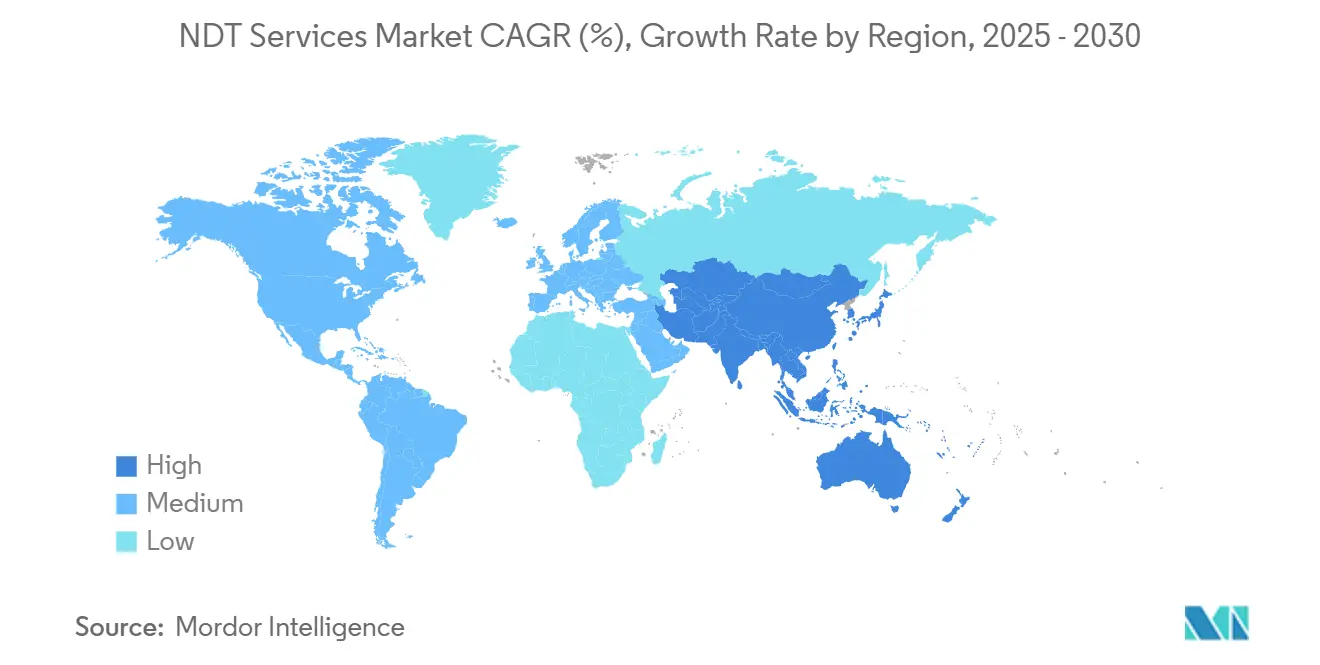
| Fastest Growing Market | Asia Pacific |
| Largest Market | North America |
| Market Concentration | Medium |
Major Players *Disclaimer: Major Players sorted in no particular order Image © Mordor Intelligence. Reuse requires attribution under CC BY 4.0. | |
NDT Services Market Analysis by Mordor Intelligence
The NDT services market size was USD 18.17 billion in 2025 and is projected to reach USD 24.89 billion by 2030, growing at a 6.5% CAGR. Momentum stems from aging industrial assets, stricter pressure-equipment codes, and expanding energy transition projects that require more frequent and sophisticated inspections.[1]American Society of Mechanical Engineers, “BPVC Section V - Nondestructive Examination,” ASME.org Higher uptime targets in refineries, pipelines, and LNG terminals heighten demand for advanced ultrasonic, eddy-current, and radiographic methods. Service providers that combine field execution with cloud-based data analytics gain a competitive edge as operators pursue predictive maintenance strategies. Ongoing consolidation indicates that scale, geographic reach, and AI-enabled defect recognition are becoming increasingly decisive factors in securing long-term contracts. Automation and robotics are accelerating as clients seek to cut permit delays and lower technician exposure in hazardous areas.
Key Report Takeaways
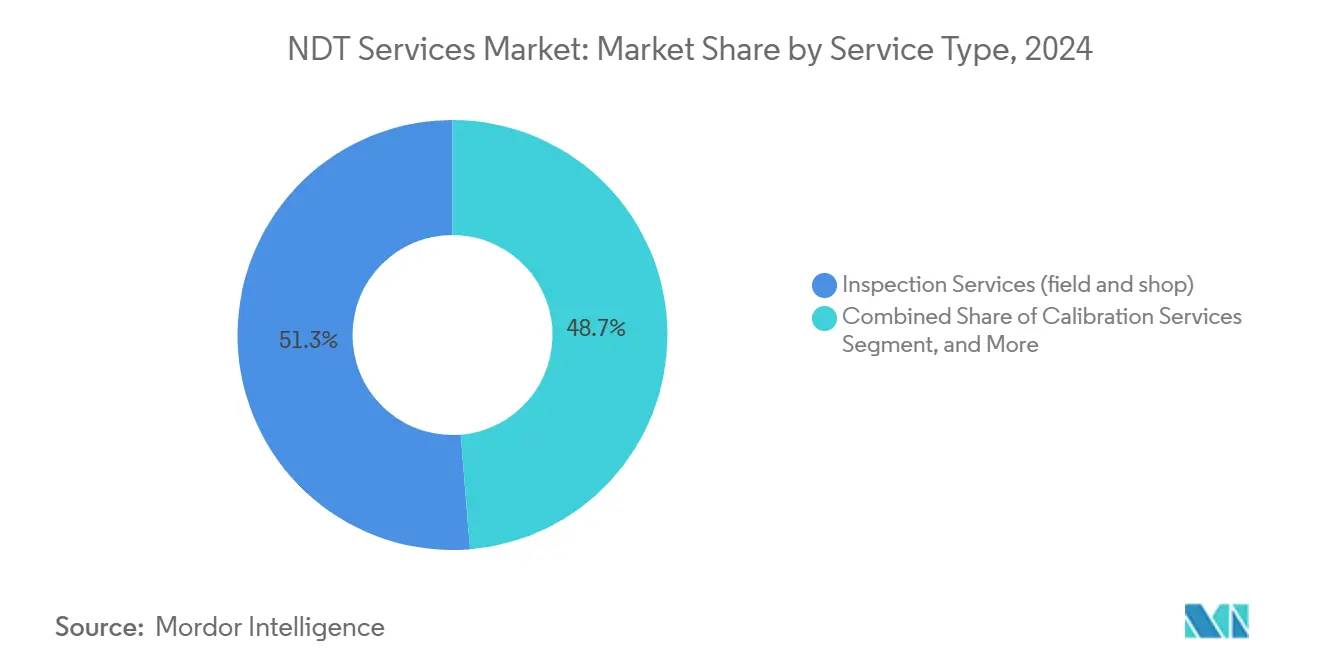
- By service type, inspection services led the NDT services market, accounting for a 51.3% revenue share in 2024. Meanwhile, asset integrity and condition monitoring are forecast to expand at an 8.9% CAGR through 2030.
- By service delivery mode, onsite field inspection accounted for 65.2% of the NDT services market share in 2024; automated and robotic inspection is projected to grow the fastest, at a 9.1% CAGR, through 2030.
- By testing method, ultrasonic testing accounted for 27.3% of the NDT services market size in 2024, whereas eddy-current testing is expected to rise at an 8.2% CAGR between 2025 and 2030.
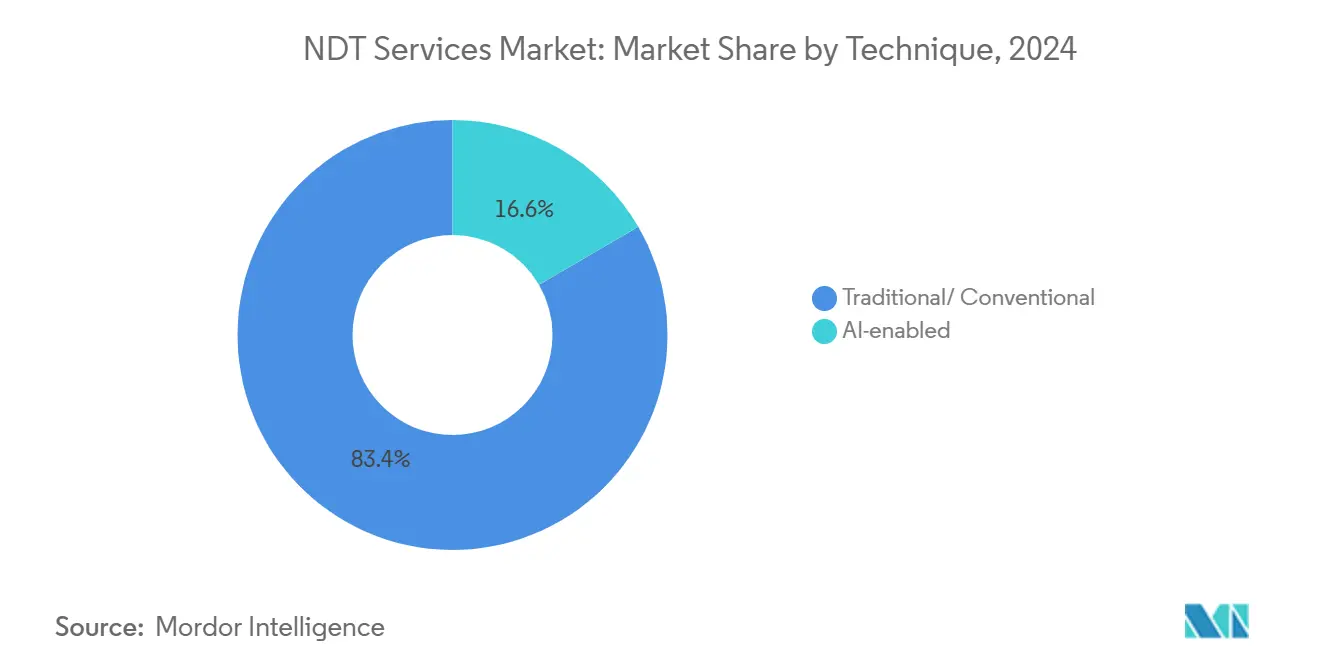
- By technique, traditional approaches accounted for 83.4% of the NDT services market size in 2024, while AI-enabled methods advanced at a 10.3% CAGR over the same period.
- By end-user industry, the oil and gas sector captured a 27.3% revenue share of the NDT services market in 2024, and the automotive and transportation sector is set to register the highest CAGR of 9.8% from 2024 to 2030.
- By geography, North America commanded 36.7% of the NDT services market in 2024, while the Asia-Pacific region exhibits the quickest regional expansion at an 8.4% CAGR toward 2030.
Global NDT Services Market Trends and Insights
Drivers Impact Analysis*
| Driver | (~) % Impact on CAGR Forecast | Geographic Relevance | Impact Timeline |
|---|---|---|---|
| Aging refinery and pipeline assets require frequent integrity inspections | +1.8% | Global, concentrated in North America and the Middle East | Long term (≥ 4 years) |
| Tightening global pressure-equipment codes (ASME, API 579) extends the mandatory inspection scope | +1.2% | Global, with the strongest impact in North America and Europe | Medium term (2-4 years) |
| Rapid shift to LNG and hydrogen infrastructure needing specialised advanced NDT | +0.9% | Global, early adoption in Asia-Pacific and North America | Long term (≥ 4 years) |
| IV–curve digitization - permanent sensors enabling recurring monitoring contracts | +0.7% | Global, with early gains in developed markets | Medium term (2-4 years) |
| Defense offsets and localisation programmes driving regional NDT outsourcing | +0.5% | Regional, concentrated in the Asia-Pacific and the Middle East | Short term (≤ 2 years) |
| AI-based defect-recognition software is slashing interpretation time and cost | +0.6% | Global, with faster adoption in North America and Europe | Short term (≤ 2 years) |
| Source: Mordor Intelligence | |||
Aging Refinery and Pipeline Assets Requiring Frequent Integrity Inspections
More than 60% of refineries worldwide have surpassed 30 years in service, prompting operators to halve traditional inspection intervals and adopt advanced ultrasonic and phased-array techniques for weld integrity checks.[2]Alyeska Pipeline Service Company, “Pipeline Operations - Integrity Management,” Alyeska-pipe.com Pipeline systems face comparable scrutiny, with stress-corrosion cracking assessments now scheduled every three to five years rather than every decade. Unsurprisingly, a single refinery shutdown can cost USD 50-100 million, so preventive NDT spending is viewed as a direct hedge against catastrophic downtime. Demand is especially strong for high-temperature ultrasonic probes and electromagnetic acoustic transducers that can characterize subsurface flaws under operating conditions. Service providers that offer turnkey inspection coupled with risk-based asset management frameworks continue to secure multi-year agreements across North America, the Middle East, and parts of Asia.
Tightening Global Pressure-Equipment Codes Extend Mandatory Inspection Scope
The 2023 revisions to ASME Section VIII, Division 2, and API 579-1 fitness-for-service standards require more frequent examinations of pressure vessels and piping in cyclic service. Critical welds now require time-of-flight diffraction or phased-array inspection, expanding market demand beyond straightforward visual or magnetic testing. Europe’s Pressure Equipment Directive 2014/68/EU likewise heightens documentation demands, stimulating adoption of integrated data-management platforms that unify inspection records with asset histories. These tighter rules extend beyond oil and gas into chemicals, power generation, and manufacturing, enlarging the addressable NDT services market.
Rapid Shift to LNG and Hydrogen Infrastructure Needs Specialized Advanced NDT
Projected 40% growth in LNG export capacity and more than USD 100 billion in annual hydrogen investments introduce new material and temperature challenges.[3]International Gas Union, “LNG 2024 World LNG Report,” IGU.org Cryogenic components at −162 °C require customized liquid-penetrant inspection protocols, while hydrogen embrittlement necessitates acoustic-emission monitoring and ultrasonic crack detection in composite pressure vessels. Eddyfi Technologies now channels 35% of its R&D toward hydrogen and LNG inspection solutions. Service providers that master these niche applications are commanding premium contract rates and gaining early-mover advantage in Asia-Pacific terminals and North American export projects, reinforcing the region’s elevated CAGR.
AI-Based Defect-Recognition Software Slashing Interpretation Time and Cost
Machine-learning platforms from Zetec and Olympus achieve 95% classification accuracy, reducing interpretation time by up to 80%. In refinery turnarounds, real-time analytics shorten decision cycles and reduce outage costs, which can reach USD 1 million per day. AI models now integrate eddy-current, ultrasonic, and visual data streams, providing rich defect characterization and confidence metrics acceptable to regulators. Adoption rates are highest in the aerospace and petrochemical industries, but cross-industry interest is expanding rapidly as users seek to mitigate the shortage of Level-III technicians.
Restraints Impact Analysis*
| Restraint | (~) % Impact on CAGR Forecast | Geographic Relevance | Impact Timeline |
|---|---|---|---|
| Shortage of Level-III certified technicians inflates labour cost and turnover | -1.4% | Global, most severe in North America and Europe | Long term (≥ 4 years) |
| Radiography dose-control regulations are slowing down onsite work permits | -0.8% | Global, with the strictest enforcement in Europe and North America | Medium term (2-4 years) |
| Cap-ex deferrals in petrochemicals amid energy-price volatility | -0.6% | Global, with cyclical regional variations | Short term (≤ 2 years) |
| Competitive price-undercutting by low-margin regional firms | -0.5% | Regional, concentrated in the Asia-Pacific and the Middle East | Medium term (2-4 years) |
| Source: Mordor Intelligence | |||
Shortage of Level-III Certified Technicians Inflates Labor Cost and Turnover
ASNT data indicate that 58% of Level-III professionals will retire within a decade, while certification throughput lags behind replacement needs. Salary premiums of 25-30% and bonuses exceeding USD 25,000 escalate project costs. The shortage also creates bottlenecks because Level-III oversight is mandatory for final report sign-off. Major firms have responded by establishing in-house academies and forming partnerships with technical colleges, but smaller regional providers struggle to attract the necessary expertise, thereby reinforcing consolidation trends in the NDT services market.
Radiography Dose-Control Regulations Slowing Onsite Work Permits
Enhanced ALARA protocols, as outlined under IAEA standards, extend permit lead times by up to 72 hours and necessitate rigorous dosimetry programs.[4]International Atomic Energy Agency, “Radiation Protection and Safety of Radiation Europe’s Basic Safety Standards Directive further tightens exposure limits, prompting some operators to shift their focus on weld inspection toward phased-array ultrasonics, despite the higher equipment costs. Where radiography remains irreplaceable for thick-section welds, providers absorb additional administrative overhead, which lengthens project timelines and dampens overall service throughput in the NDT services market.
*Our forecasts treat driver/restraint impacts as directional, not additive. The impact forecasts reflect baseline growth, mix effects, and variable interactions.
Segment Analysis
By Service Type: Inspection Dominance Meets Predictive Shift
Inspection services contributed 51.3% of 2024 revenue, confirming their status as the backbone of the NDT services market. Asset integrity and condition monitoring, although smaller, is forecasted at an 8.9% CAGR to 2030 as operators install permanent sensors that feed continuous data streams into cloud analytics platforms. The NDT services industry is increasingly valuing solutions that integrate field tests, sensor deployment, and data interpretation, replacing purely transactional engagements. Calibration and consulting maintain steady but limited growth, tied to regulatory obligations, whereas training demand rises in tandem with the complexity of techniques, yet remains constrained by an insufficient number of instructors. Managed services surface as a viable outsourcing option, combining equipment, technicians, and software under long-term contracts.
The value proposition has shifted from isolated defect detection to lifecycle risk management. Inspection firms that integrate ultrasonic, eddy-current, and digital radiography with integrity analytics deliver measurable improvements in plant uptime and reliability. In turn, asset owners are migrating spending from capital projects to operating budgets, favoring subscription-like monitoring agreements, a model that expands recurring revenue within the NDT services market.


By Service Delivery Mode: Onsite Strength Faces Robotic Momentum
On-site field inspection still accounts for 65.2% of 2024 revenue, thanks to the immobility of large refineries, pipelines, and power plants. However, automated and robotic modes exhibit a 9.1% CAGR, propelled by safety imperatives and repeatability needs in confined or radiological environments. The NDT services market size for robotic inspection of offshore pipelines is estimated to be USD 1.9 billion in 2025, growing to USD 3.0 billion by 2030. Remote digital delivery is gaining traction, as permanent sensors enable centralized data interpretation, a trend accelerated by pandemic-driven travel restrictions. Laboratory testing, although it accounts for a lower share, retains critical importance for aerospace metallography and additive manufacturing samples.
Customers increasingly evaluate vendors on their ability to deploy drones, crawlers, and autonomous underwater vehicles. The operational uptick is evident on offshore platforms, where Oceaneering’s robots now perform routine riser inspections without requiring additional shutdowns. Meanwhile, remote operations centers in Houston, Rotterdam, and Singapore analyze field data in near real-time, shortening feedback loops and reducing technician travel costs across the NDT services market.
By Testing Method: Ultrasonic Leadership Under Surface-Crack Pressure
Ultrasonic testing generated 27.3% of 2024 revenue and remains the default for volumetric weld evaluation. Yet eddy-current testing posts the fastest 8.2% CAGR, underpinned by the shift toward lightweight metals in aerospace and automotive assemblies. Eddyfi’s high-frequency array probes detect micrometer-scale flaws in aluminum fuselage skins and electric-vehicle battery casings, unlocking new addressable spend within the NDT services market. Radiography, strengthened by digital imaging, remains relevant for thick sections but faces regulatory challenges and rising source leasing costs. Magnetic particle and liquid-penetrant testing have niche applications, while digital visual inspection is seeing renewed uptake as AI-powered cameras flag anomalies during routine walk-downs.
Method selection is increasingly hybrid. Comprehensive programs might start with visual drones, proceed to phased-array scans for suspect welds, and finish with digital radiography for confirmation. Providers capable of orchestrating these layered protocols secure longer master service agreements, reinforcing their revenue resilience against single-method commoditization in the NDT services market.
By Technique: AI-Enabled Tools Challenge Traditional Certainty
Conventional techniques captured 83.4% of the 2024 expenditure, owing to the regulator's preference for proven methods. AI-enabled inspection, although representing just 16.6%, is expanding at a 10.3% CAGR, as validated algorithms demonstrate speed and reproducibility. The NDT services industry is witnessing the emergence of hybrid devices, where traditional phased-array hardware streams data into embedded neural networks, enabling instant classification of defects. Aerospace composites led to early adoption, and petrochemicals are now piloting similar systems to offset Level III shortages. Regulatory bodies remain conservative, yet several have begun drafting guidance on AI acceptance criteria, a milestone likely to accelerate the uptake.
Cost-benefit equations already favor AI in applications with high data volume and tight outage windows. For example, a 400-kilometer pipeline run that once required two Level-III interpreters over three days can now be analyzed in six hours with AI verification and the assistance of one senior reviewer. Such efficiencies underpin the sustained CAGR advantage AI enjoys over traditional modalities within the NDT services market.
By End-User Industry: Oil and Gas Reliance Meets Automotive Acceleration
Oil and gas delivered 27.3% of 2024 revenue, driven by refinery turnarounds and pipeline integrity mandates. However, the automotive and transportation sector is projected to climb at a 9.8% CAGR as electric-vehicle production scales and battery safety needs intensify. Lightweight aluminum and carbon fiber components demand eddy-current and thermography inspections that legacy oil assets seldom require. Power generation, particularly wind and solar installations, keeps a steady inspection cadence for blades and photovoltaic modules.
Aerospace and defense rebound post-pandemic, buoyed by backlog deliveries and fighter-jet procurement. The manufacturing, construction, and marine segments each contribute modest but steady growth, supported by broader industrial output. Across all segments, digitization and data-driven maintenance are sharpening the focus on continuous rather than episodic inspections, steadily expanding the NDT services market across diverse verticals.
Geography Analysis
North America generated 36.7% of the 2024 revenue, driven by mature refinery networks, shale pipeline expansions, and stringent federal safety mandates. The NDT services market size for the region is projected to increase from USD 6.67 billion in 2025 to USD 8.85 billion by 2030. Contract awards increasingly bundle multi-site inspections across the Gulf Coast, Mid-Continent, and Alberta corridors, compelling vendors to maintain technician pools and equipment depots nationwide. Corporate ESG commitments further encourage asset owners to adopt predictive maintenance, thereby deepening service penetration.
Europe ranks second by revenue, supported by the Pressure Equipment Directive and ongoing decarbonization projects such as offshore wind farms in the North Sea. Service providers integrate rope-access teams with advanced ultrasonic and composite-blade inspection tools, opening new revenue lanes in renewable infrastructure. Radiography work faces steeper compliance hurdles, encouraging a gradual shift toward automated ultrasonics. Regional players are also tapping nuclear-plant life-extension programs in France and the United Kingdom, diversifying their exposure within the NDT services market.
Asia-Pacific is the growth engine, logging an 8.4% CAGR amid gargantuan infrastructure spending under China’s Belt and Road Initiative and large-scale LNG export terminals in Australia and Malaysia. Rising adoption of international safety standards expands the addressable base beyond state-owned enterprises to include joint-venture and private operators that demand globally benchmarked inspection quality. The region is also tackling a chronic technician shortage through massive training initiatives, as evidenced by TÜV Rheinland’s new Mumbai center designed to certify 500 professionals annually. Middle East and Africa round out the landscape, buoyed by petrochemical investments yet tempered by geopolitical risks. Overall, providers that establish local entities and talent pipelines are positioned to capture outsized growth across emerging regions of the NDT services market.

Competitive Landscape
The NDT services market remains moderately fragmented, though 2024 marked an uptick in consolidation. Global majors such as SGS, Bureau Veritas, and Mistras Group leverage cross-sector expertise and worldwide laboratories to serve multinational clients requiring uniform protocols. Mid-tier operators focus on niche domains, such as hydrogen embrittlement testing or nuclear steam generator inspections. Competitive intensity centers on technology leadership; AI-driven platforms and robotic crawlers increasingly differentiate bids.
Strategic deals underscore scale imperatives. Apave’s EUR 45 million (USD 48.6 million) purchase of CND Service and IRISNDT expanded its European nuclear footprint. Acuren’s USD 425 million merger with NV5 delivered vertical integration from civil engineering through field inspections, enhancing cross-sell potential. Bureau Veritas has earmarked USD 85 million for cloud-based analytics, and Intertek has forged a partnership with Microsoft Azure to expedite predictive maintenance services. These moves illustrate a pivot toward data-centric value propositions within the NDT services market.
Barriers to entry are rising. Capital outlays for multi-modal robots, AI software, and high-frequency probes stretch beyond the reach of small entrants. At the same time, severe Level-III talent shortages enable market leaders to secure technicians with premium packages, thereby constraining the capacity of challengers. Yet white-space opportunities persist in additive manufacturing verification and composite-airframe inspection, where legacy standards are still evolving. Firms that develop proprietary techniques or secure early regulatory endorsements are likely to carve out profitable niches before commoditization sets in.
NDT Services Industry Leaders
Applus Services S.A. (Applus+)
Mistras Group Inc.
SGS S.A.
Intertek Group plc
Baker Hughes Company
- *Disclaimer: Major Players sorted in no particular order

Recent Industry Developments
- May 2025: MISTRAS Group announced 3.4% revenue growth in 2024, reaching USD 729.6 million, with aerospace and defense up 13%.
- February 2025: Fairley Gunn Group acquired Axi-Tek and Metrix NDT, enhancing specialized service capacity.
- October 2024: Eddyfi Technologies completed its acquisition of NDT Global for USD 240 million, forming a pipeline-integrity powerhouse that marries sensors with robotic platforms.
- October 2024: Apave Group completed the acquisition of IRISNDT, expanding its NDT footprint across 48 branches in North America, Australia, and the United Kingdom.


Global NDT Services Market Report Scope
| Inspection Services (field and shop) |
| Asset Integrity and Condition Monitoring (AIM/CM) |
| Calibration Services |
| Consulting and Engineering |
| Training and Certification |
| Other Service Type (Managed Services / Long-term Contracts) |
| On-site / Field Inspection |
| In-house / Laboratory Testing |
| Remote / Digital Services |
| Automated / Robotic Inspection |
| Ultrasonic Testing |
| Radiographic Testing |
| Magnetic Particle Testing |
| Liquid Penetrant Testing |
| Visual Inspection Testing |
| Eddy-Current Testing |
| Traditional/ Conventional |
| AI-enabled |
| Oil and Gas |
| Power Generation |
| Aerospace |
| Defense |
| Automotive and Transportation |
| Manufacturing and Heavy Engineering |
| Construction and Infrastructure |
| Chemical and Petrochemical |
| Marine and Ship Building |
| Electronics and semiconductor |
| Mining |
| Medical Devices |
| Other End-user Industries |
| North America | United States | |
| Canada | ||
| Mexico | ||
| South America | Brazil | |
| Argentina | ||
| Rest of South America | ||
| Europe | Germany | |
| United Kingdom | ||
| France | ||
| Italy | ||
| Spain | ||
| Rest of Europe | ||
| Asia-Pacific | China | |
| Japan | ||
| India | ||
| South Korea | ||
| South East Asia | ||
| Rest of Asia-Pacific | ||
| Middle East and Africa | Middle East | Saudi Arabia |
| United Arab Emirates | ||
| Turkey | ||
| Rest of Middle East | ||
| Africa | South Africa | |
| Nigeria | ||
| Rest of Africa | ||
| By Service Type | Inspection Services (field and shop) | ||
| Asset Integrity and Condition Monitoring (AIM/CM) | |||
| Calibration Services | |||
| Consulting and Engineering | |||
| Training and Certification | |||
| Other Service Type (Managed Services / Long-term Contracts) | |||
| By Service Delivery Mode | On-site / Field Inspection | ||
| In-house / Laboratory Testing | |||
| Remote / Digital Services | |||
| Automated / Robotic Inspection | |||
| By Testing Method | Ultrasonic Testing | ||
| Radiographic Testing | |||
| Magnetic Particle Testing | |||
| Liquid Penetrant Testing | |||
| Visual Inspection Testing | |||
| Eddy-Current Testing | |||
| By Technique | Traditional/ Conventional | ||
| AI-enabled | |||
| By End-user Industry | Oil and Gas | ||
| Power Generation | |||
| Aerospace | |||
| Defense | |||
| Automotive and Transportation | |||
| Manufacturing and Heavy Engineering | |||
| Construction and Infrastructure | |||
| Chemical and Petrochemical | |||
| Marine and Ship Building | |||
| Electronics and semiconductor | |||
| Mining | |||
| Medical Devices | |||
| Other End-user Industries | |||
| By Geography | North America | United States | |
| Canada | |||
| Mexico | |||
| South America | Brazil | ||
| Argentina | |||
| Rest of South America | |||
| Europe | Germany | ||
| United Kingdom | |||
| France | |||
| Italy | |||
| Spain | |||
| Rest of Europe | |||
| Asia-Pacific | China | ||
| Japan | |||
| India | |||
| South Korea | |||
| South East Asia | |||
| Rest of Asia-Pacific | |||
| Middle East and Africa | Middle East | Saudi Arabia | |
| United Arab Emirates | |||
| Turkey | |||
| Rest of Middle East | |||
| Africa | South Africa | ||
| Nigeria | |||
| Rest of Africa | |||


Key Questions Answered in the Report
How big is the NDT services market in 2025?
The NDT services market size reached USD 18.17 billion in 2025 and is forecast to grow to USD 24.89 billion by 2030.
Which region leads global demand?
North America held a 36.7% revenue share in 2024, primarily due to its extensive refinery infrastructure and strict safety codes.
What is the fastest-growing end-user sector?
The automotive and transportation sector is projected to expand at a 9.8% CAGR through 2030 as electric-vehicle production scales.
How is AI influencing inspection?
AI-enabled defect recognition cuts interpretation time by up to 80% and is growing at a 10.3% CAGR within the market.
Why are Level-III technicians in short supply?
A retirement wave means 58% of certified experts will leave the workforce within ten years, pushing salary premiums above 25%.
Which service delivery mode is gaining traction?
Automated and robotic inspection is the fastest-growing mode, with a 9.1% CAGR, favored for its safety and consistency benefits.
Page last updated on:


